Keywords
Instrumental music; Arousal; Valence; EEG; MFDFA; Alpha and theta multi-fractal width
Introduction
Music is a common phenomenon that crosses all borders of nationality, race, and culture. A tool for arousing emotions and feelings, music is said to be far more powerful than language. An increased interest in how the brain processes musical emotion can be attributed to the way in which it is described as a “language of emotion” across cultures [1]. More than any other stimulus, music has the ability to conjure up images and feelings that need not necessarily be directly reflected in memory. The overall phenomenon in how music evokes emotion still contains a veil of mystery; the reasons behind the ‘thrill’ or ‘chills’ generated while listening to music are strongly tied in with various theories based on synesthesia [2]. Instrumental music is said to be brain’s food. Earlier studies have found that listening and training in instrumental music has positive effects on cognitive development in children [3]. Training in instrumental music results in greater growth in manual dexterity and music perception skills, significantly improved verbal and mathematical performance and more gray matter volume in the brain [4-6]. People perform logic tasks better in the presence of instrumental music as opposed to vocal music, according to another study [7]. Researchers found that those listening to classical music seemed more involved in the task, possibly brought on by the relaxing nature of the music [8]. Those suffering from pain and/ or depression should listen to instrumental music for relaxation and relief [9,10]. Music therapy is instituted in many hospitals and hospices to relieve stress and provide comfort. Researchers have also found that playing slow instrumental music, including jazz, harp and piano music, reduced pain and anxiety in patients following open-heart surgery [11].
Music has the unique ability to evoke a wide variety of emotions involving valence (quality of a particular emotion) as well as arousal (quantity or bodily activation corresponding to a particular emotion) based affects [12]. Valence is a subjective feeling of pleasantness or unpleasantness while arousal is a subjective state of feeling activated or deactivated [13]. A number of studies have been conducted to test the validity of arousalvalence model in musical emotions, of which mostly are based on human response data [14-16], while few studies use neurobio sensors [17,18]. Most of the studies related to emotional aspects of music are centered around Western music, while only a few studies deal with Hindustani music [19,20] and its neural correlates. A number of issues like universality, arousal-valence and its linkage with modularity or neural correlates have been baffling scientists for quite some time. This prompted us to use a wide variety of instrumental music originating from different parts of the globe and study their arousal and valence based effects in human brain using electroencephalography (EEG) using robust non-linear analysis techniques.
A number of previous studies speak in favor of the valence lateralization model, according to which positive emotions are associated with greater left frontal activity while the negative emotions are associated with increased right frontal activity [17,21-23], although it seems a bit unrealistic to think that specific regions of the brain will be involved in processing a particular emotion, while others remain inert. A number of studies thus report against this lateralization theory claiming that a number of regions work together for the processing of musical emotions [24,25] mainly happiness and sadness, as these are the most reliably induced musical emotions [26]. A common feature of most of these studies is that they concentrate on the frontal lobe mainly during the perception and cognition of emotion, but a few studies have also reported the involvement of temporal lobe in the processing of musical emotions [27-29] as well as occipital lobe in some cases [30,31]. Though the occipital lobe is mostly attributed to information and visual stimuli processing, the debate whether musical stimuli is able to produce mental imagery is well known. Thus, it would be interesting to see the response of occipital electrodes along with others when presented with musical stimulus conveying a palette of emotions. Most of the referred studies here use fMRI (functional Magnetic Resonance Imaging) or PET (Positron Emission Tomography) techniques which generally have high spatial resolution but lack in temporal precision. EEG data on the other hand have high temporal resolution in the form of time series data obtained from different corners of the brain which help in identifying specifically the regions which are more stimulated or activated in response to a particular emotional stimuli. A number of previous EEG studies based on linear analysis in the form of Power Spectral Density (PSD) have marked alpha activity as a mediator to identify emotional response [17,21-32] while a few also consider theta power [22,33]. Most of these studies speak in favor of asymmetric processing, where a decrease in left frontal alpha power is a mark of positive emotional processing, while a decrease in right frontal alpha power is a mark of negative emotion processing [17,21,22]. The rise in Frontal Midline (Fm) theta power was seen to be associated with processing of pleasant music [22,33]. But all these studies are based on linear Fourier Transform (FT) technique which has some obvious drawbacks as illustrated in [34,35]. The FT technique assumes the EEG signals to be linear and stationary, does not involve the inherent spikes in the time series, thus involving a major loss in data [36].
EEG is a neuro-scientific bio-sensor which provides plentiful information about the complex human brain dynamics according to electrical activity in brain tissues (waves i.e., plot of voltage over time between electrodes by using the summation of many action potentials sent by neurons in brain) against human emotion elicited by music. The scalp EEG arises from the interactions of a large number of neurons whose interactions generally nonlinear and thus they can generate fluctuations that are not best described by linear decomposition. On the other hand, the classical nonlinear dynamics method such as correlation dimension and Lyapunov exponents are very sensitive to noise and require the stationary condition, while EEG signals often are highly non-stationary. In recent past, the DFA has become a very useful technique to determine the fractal scaling properties and long-range correlations in noisy, non-stationary time-series. It has been widely applied to diverse fields such as DNA sequences, heart rate dynamics, neuron spiking, human gait, and economic time-series and also to weather related and earthquake signals [37-40]. DFA has also been applied to EEG signals to identify music induced emotions in a number of studies [41]. Gao et al. [42] related emotional intensity with the scaling exponent, while a recent study [43] relate the variation of alpha scaling exponent generated from DFA technique with the retention of musical emotions – an evidence of hysteresis in human brain. But DFA has its own limitations. Many geophysical signals as well as biosignals do not exhibit mono-fractal scaling behavior, which can be accounted for by a single scaling exponent [44-46], therefore different scaling exponents are required for different parts of the series [47]. Consequently a multi-fractal analysis should be applied.
The Multi-fractal Detrended Fluctuation Analysis (MFDFA) technique was first conceived by Kantelhardt et al. [48] as a generalization of the standard DFA [49,50]. MFDFA has been applied successfully to study multi-fractal scaling behavior of various non-stationary time series [51-53] as well as in detection or prognosis of diseases [54,55], scaling of music signals [55]. The multi-fractal s are fundamentally more complex and inhomogeneous than mono-fractals [56] and describe time series featured by very irregular dynamics, with sudden and intense bursts of high-frequency fluctuations [57]. EEG signals are essentially multi-fractal s as they consist of segments with large variations as well as segments with very small variations, hence when applied to the alpha and theta EEG rhythms, the multi-fractal spectral width will be an indicator of emotional arousal corresponding to particular clip. In case of music induced emotions, a recent study [58,59] used the multi-fractal spectral width as an indicator to assess emotional arousal corresponding to the simplest musical stimuli – a tanpura drone.
The objective of this study is to analyze the effect of cross-cultural instrumental music signals on brain activity during the normal relaxing condition, using a robust non-linear analysis technique – MFDFA. It is well known that listening to music is a complex process for the brain, since it triggers a sequel of cognitive and emotional components. The choice of instrumental music was done so as to avoid any conflict that may arise due to cognition of language present in the musical clips (Table 1). Our study therefore focuses on measuring the emotions elicited by the instrumental music stimuli in terms of neuron arousals. For this, we chose eight (8) 30 second instrumental clips originating from across different cultural attributes. The clips were chosen keeping in mind they convey a wide range of emotional arousal so that we can get a method to automatically identify the amount of arousal each clip causes. The clips were first standardized on the basis of a human response data of 100 respondents. The informants were asked to rate the clips in 2-dimensional emotional axes comprising of four basic emotions namely – joy, sorrow, anxiety and calmness in a 5 point scale. The clips which have maximum rating in the scale of 4/5 are those which have maximum arousal corresponding to a particular emotion. In this way, we can identify the clips which cause maximum arousal in the listeners. Next, EEG is conducted on 10 participants chosen arbitrarily from the 100 respondents who participated in the listening tests. The participants are made to listen to the 30 second clips in the same order in which they gave the listening test. The EEG signals were obtained from five frontal electrodes (F3, F4, F7, F8 and Fz), two temporal electrodes (T3/T4) and two occipital electrodes (O1/O2). The signals from each electrode were preprocessed with the well-known EMD [59] technique to make it free from blink/ muscular artifacts [60-62]. The artifact-free EEG signals were then subject to Wavelet Transform (WT) [63] technique to extract the theta and alpha time series data. Next the alpha and theta EEG brain rhythms were subject to the MFDF analysis which gives the alpha and theta multi-fractal spectral width corresponding to each musical clip. These neuronic arousals might be a manifestation of change of complexity as obtained from the variation of the multi-fractal width. The multi-fractal spectral width is known to be a measure of complexity of the EEG signal. The spectral width corresponding to the alpha and theta domain varies significantly from one clip to another and has unique manifestation in frontal, temporal and occipital lobe. This could be helpful as a parameter for emotion identification from music stimuli. Also, the arousal based effects from a musical clip can be localized with the help of this technique along with the identification of a parameter from which we can nullify or support the valence lateralization theory. Summing up, in this study, we provide a novel technique where, with the help of a single parameter (i.e., multi-fractal width) we can categorize, quantify musical emotion processing accomplished by different regions of human brain (Table 1).
| Clip No. |
Clip Name |
Artist |
Instrument Used |
| Clip 1 |
Amelie Road Crossing |
YannTiersen |
Accordion |
| Clip 2 |
Raga Bhairavi |
UstadAmjad Ali Khan |
Sarod |
| Clip 3 |
Tocotta and Fugue in D’ minor |
J.S. Bach |
Organ |
| Clip 4 |
Earthquake |
UstadZakirHussain |
Tabla |
| Clip 5 |
Hachiko Soundtrack |
Jan A.P. Kaczmarek |
Piano |
| Clip 6 |
Raga Mishra gara |
Pt. Nikhil Banerjee |
Sitar |
| Clip 7 |
Raga SudhSarang |
V.G. Jog |
Violin |
| Clip 8 |
Water Dewdrops |
Pt. Shivkumar Sharma |
Santoor |
Table 1: Details of the instrumental clips chosen for our study.
Materials and Methods
Subjects summary
Participants were recruited through word of mouth and social media platforms. Since the study was conducted both on online and offline basis, participants from across the country participated in the study, but more than half the participants were from Kolkata. All the offline data were collected at the Sir C.V. Raman Centre for Physics and Music, Jadavpur University. In this study, ratings from 100 participants (F = 37, M = 63) were considered for analysis presented herewith. The subjects chosen had no formal musical training.
Ten (M=7, F=3) musically untrained adults chosen randomly from the pool created from listening test data who voluntarily participated in this study. The average age was 23 years (SD= 2.35 years) and average body weight was 65 kg. Informed consent was obtained from each subject according to the guidelines of the Ethical Committee of Jadavpur University. All experiments were performed at the Sir C.V. Raman Centre for Physics and Music, Jadavpur University, Kolkata. The experiment was conducted in the afternoon with a normal diet in a normally conditioned room sitting on a comfortable chair and performed as per the guidelines of the Institutional Ethics Committee of SSN College for Human volunteer research.
Experimental details
The subjects were asked to listen to eight (8) cross cultural instrumental musical clips of 30 second duration with a gap of 30 seconds between consecutive clips and mark their emotional arousal in a scale of 5. The markings on the emotional scale were based on a subject’s perception of the meaning of “happy”, “sad”, “calm” or “anxious”. There was no biasing imposed on the listener regarding the marking of clips. Corresponding to each musical clip, two pairs of emotion in a 5 point scale were given as shown in Figure 1.
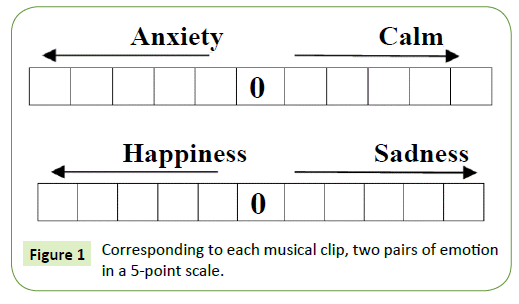
Figure 1: Corresponding to each musical clip, two pairs of emotion in a 5-point scale.
An Instruction Sheet was given along with a Response form to each subject, and the subjects were asked to mark each clip on the emotional scale shown. If the subjects were not emoted by any clip, they were asked not to mark the scale. When a subject marked an emotional rating in 4/5, it implies high arousal corresponding to that particular musical clip. In this way, the average emotional grading corresponding to each musical clip is obtained, with which we compare the data obtained from EEG. The following instrumental clips each of 30 second duration were chosen for our study:
During the EEG acquisition period, the 10 subjects were made to listen to the same clips as in the listening test. Each experimental condition lasted for around 10 min. Each song clip of 30 second was followed by a resting period of 30 seconds during which no music was played. Subjects were asked to keep their eyes closed and to sit calmly during each condition. First, the baseline (that is, a resting condition) was recorded for each subject before the start of the experiment with 1 min of ‘no music’ condition.
The music was presented with the computer-sound system (Logitech R _ Z-4 speakers) with very low S/N ratio was used in the measurement room for giving music input to the subjects ca. 120 cm behind the head of the subjects with a volume of 45–60 dB. The volume was adjusted individually within this range since the individually chosen pieces of music were typically listened at different sound volumes. For example, Hard-Rock is typically louder than classical music. The EEG experiment was conducted in the afternoon (around 2 PM) in a room with the volunteers sitting in a comfortable chair.
Experimental protocol
Since the objective of this study was to analyze the effect of cross-cultural contemporary instrumental music on brain activity during the normal relaxing condition, the frontal, temporal and occipital lobes were selected for the study. EEG was done to record the brain-electrical response of 10 subjects. Each subject was prepared with an EEG recording cap with 19 electrodes (Ag/AgCl sintered ring electrodes) placed in the international 10/20 system. Figure 2 depicts the positions of the electrodes. Impedances were checked below 50 kΩ. The EEG recording system (Recorders and Medicare Systems) was operated at 256 samples/s recording on customized software of RMS. The data was band-pass-filtered between 0.5 and 35Hz to remove DC drifts and suppress the 50Hz power line interference. The ear electrodes A1 and A2 linked together have been used as the reference electrodes. The same reference electrode is used for all the channels. The forehead electrode, FPz has been used as the ground electrode. Each subject was seated comfortably in a relaxed condition in a chair in a shielded measurement cabin. They were also asked to close their eyes. After initialization, a 10 minutes recording period was started, and the following protocol was followed:
1. 60 seconds: No Music (Resting Condition).
2. 30 seconds: Clip 1.
3. 30 seconds: No Music.
4. 30 seconds: Clip 2.
5. 30 seconds: No Music.
6. 30 seconds: Clip 3.
7. 30 seconds: No Music.
8. 30 seconds: Clip 4.
9. 30 seconds: No Music.
10. 30 seconds: Clip 5.
11. 30 seconds: No Music.
12. 30 seconds: Clip 6.
13. 30 seconds: No Music.
14. 30 seconds: Clip 7.
15. 30 seconds: No music.
16. 30 seconds: Clip 8.
17. 60 seconds After Music
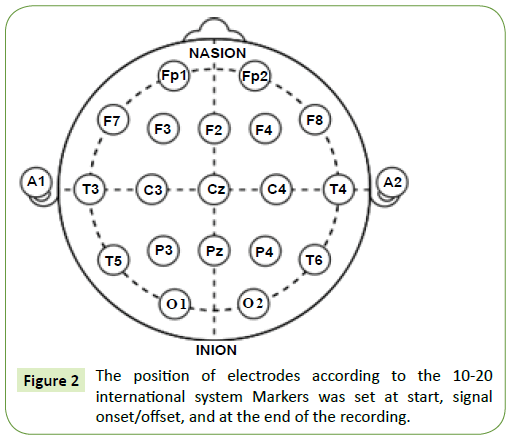
Figure 2: The position of electrodes according to the 10-20 international system Markers was set at start, signal onset/offset, and at the end of the recording.
Methodology
Pre-processing of EEG signals
A number of earlier studies speak in favour of hemispheric lateralization of brain, when it comes to processing of emotions [17,18,21-24,64]. In these works it was seen that the left hemisphere is mostly involved in processing positive emotions while the right hemisphere is engaged in processing of negative emotions. So, we decided to select a pair of odd-even electrodes each from temporal (T3/T4), occipital (O1/O2) lobes while 5 electrodes were chosen from the frontal lobe (F3, F4, F7, F8 and Fz) as the frontal lobe has proved to be the most important when it comes to higher order cognitive processing of musical emotion. The time series data obtained from each of these electrodes were cleaned using the EMD technique first proposed by Huang [59] and it is considered as one of the most vital techniques for the analysis of non-stationary and non-linear EEG data.
We have obtained noise free EEG data for all the electrodes using the EMD technique as in [57] and used this data for further analysis and classification of acoustic stimuli induced EEG features. The following figure (Figure 3) is a representative one showing a 30 seconds filtered EEG signals and the residue that was removed as artifact from the raw EEG signals. In order to eliminate all frequencies outside the range of interest, data was filtered within a range of 0.5-50 Hz using a finite impulse response (FIR) filter. The filter order for the FIR filter is set to two cycles of the lower frequency limit of that particular band, in order to accurately detect the oscillations while also limiting the temporal integration caused by the filter. Thus, in case of alpha band (8-13Hz), the filter order is set to be two cycles of 8Hz each, similar procedure was used for the other frequency bands. The amplitude envelope of the alpha (8-13 Hz) and theta (4-7 Hz) frequency range was obtained using wavelet transform technique. Data was extracted for these electrodes according to the time period given in the Experimental protocol section i.e., for Experimental conditions 1 to 17.
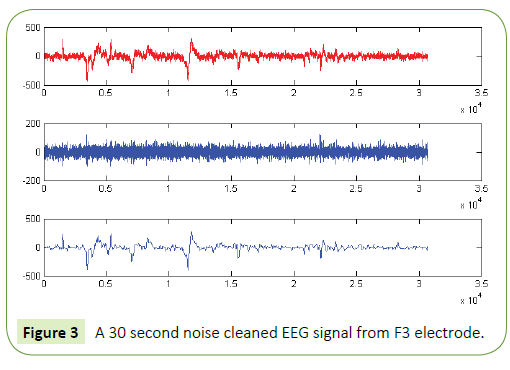
Figure 3: A 30 second noise cleaned EEG signal from F3 electrode.
Wavelet transform
Wavelet transform (WT) forms a general mathematical tool for time-scale signal analysis and decomposition of EEG signal. We have used WT technique to decompose the EEG signal into various frequency bands i.e., alpha and theta. The DWT [65] analyzes the signal at different frequency bands with different resolutions by decomposing the signal into a coarse approximation and obtains detailed information. DWT generally employs two sets of functions, called the scaling functions and wavelet functions, associated with low pass and high pass filters, respectively. The decomposition of the signal into different frequency bands is done by successive high pass and low pass filtering of the time domain signal. In this way time series data of alpha and theta waves were obtained corresponding to each experimental condition. On the obtained time series data, MFDFA analysis was performed.
Method of multi-fractal analysis of EEG signals
The analysis of the alpha and theta EEG signals are done using MATLAB [66] and for each step an equivalent mathematical representation is given which is taken from the prescription of Kantelhardt et al. [49].
The complete procedure is divided into the following steps:
Step 1: Converting the noise like structure of the signal into a random walk like signal. It can be represented as:
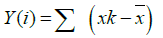
Where  is the mean value of the signal?
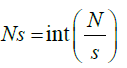
Step 2: The whole length of the signal is divided into Ns no of segments consisting of certain no. of samples. For s as sample size and N the total length of the signal the segments are
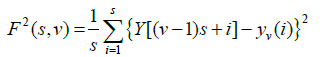
Step 3: The local RMS variation for any sample size s is the function F(s,v). This function can be written as follows:
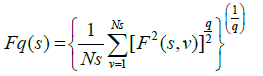
Step 4: The q-order overall RMS variation for various scale sizes can be obtained by the use of following equation
Step 5: The scaling behaviour of the fluctuation function is obtained by drawing the log-log plot of Fq(s) vs. s for each value of q.
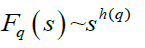
The h(q) is called the generalized Hurst exponent. The Hurst exponent is measure of self-similarity and correlation properties of time series produced by fractal. The presence or absence of long range correlation can be determined using Hurst exponent. A mono-fractal time series is characterized by unique h(q) for all values of q.
The generalized Hurst exponent h(q) of MF-DFA is related to the classical scaling exponent τ(q) by the relation
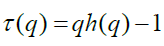
A mono-fractal series with long range correlation is characterized by linearly dependent q order exponent τ(q) with a single Hurst exponent H. Multi-fractal signal on the other hand, possess multiple Hurst exponent and in this case, τ(q) depends nonlinearly on q [67]. The singularity spectrum f(α) is related to h(q) by
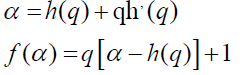
where α is the singularity strength and f(α) specifies the dimension of subset series that is characterized by α. The multifractal spectrum is capable of providing information about relative importance of various fractal exponents in the series e.g., the width of the spectrum denotes range of exponents. A quantitative characterization of the spectra may be obtained by least square fitting it to a quadratic function [65] around the position of maximum α0,
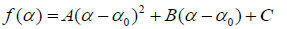
where C is an additive constant C = f(α0) = 1. B indicates the asymmetry of the spectrum. It is zero for a symmetric spectrum. The width of the spectrum can be obtained by extrapolating the fitted curve to zero.
Width W is defined as,

with 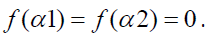
The width of the spectrum gives a measure of the multi-fractal ity of the spectrum. Greater is the value of the width W greater will be the multi-fractal ity of the spectrum. For a mono-fractal time series, the width will be zero as h(q) is independent of q.
The origin of multi-fractal ity in a EEG time series can be verified by randomly shuffling the original time series data [57,60,68]. All long range correlations that existed in the original data are removed by this random shuffling and what remains is a totally uncorrelated sequence. Hence, if the multi-fractal ity of the original data was due to long range correlation, the shuffled data will show non-fractal scaling. On the other hand, if the shuffled data has the same variation of h(q) as in the original data, it can be inferred that multi-fractal ity in the EEG time series is not due to long range correlation but is a result of broad probability density function (or a non-Gaussian distribution) of the time series. If any series has multi-fractal ity both due to long range correlation as well as due to probability density function, then the shuffled series will have smaller width W and hence weaker multi-fractal ity than the original time series. In this case we have seen that the original alpha and theta waves show multi-fractal ity values much higher than their corresponding shuffled values. This corroborates the findings of our previous work [60] where the origin of multi-fractal ity in alpha and theta waves is ascribed both due to long range correlation and probability distribution function.
Results and Discussion
The emotional ratings for each clip given by the respondents in the listening test are given in tabular form in Table 2. All the markings by the listeners from 1 to 5 corresponding to a particular emotion have been grouped under that emotion in the Table 2. It must be noted that we have listed the valence part of the emotional response and neglected the arousal part of the emotion. Thus, the percentage in each box corresponds to the number of people who have marked that particular emotion(s) in their response sheet.
| Clip No. |
Joy |
Anxiety |
Sorrow |
Calm |
| Clip 1 |
96 |
52 |
4 |
37 |
| Clip 2 |
13 |
6 |
83 |
93 |
| Clip 3 |
32 |
99 |
53 |
1 |
| Clip 4 |
58 |
100 |
5 |
10 |
| Clip 5 |
50 |
15 |
50 |
68 |
| Clip 6 |
16 |
10 |
78 |
83 |
| Clip 7 |
6 |
13 |
86 |
86 |
| Clip 8 |
100 |
3 |
0 |
93 |
Table 2: Strength of emotional response of the clips from listening test of 100 informants (in percentage).
Since the respondents were asked to mark more than one emotion in the response sheet, the use of radar plots had to be done to visually represent the human response data. On the basis of Table 2, the following radar plots are shown (Figures 4a- 7h)) which gives the level of arousal and valence of the listeners in response to each instrumental clip:
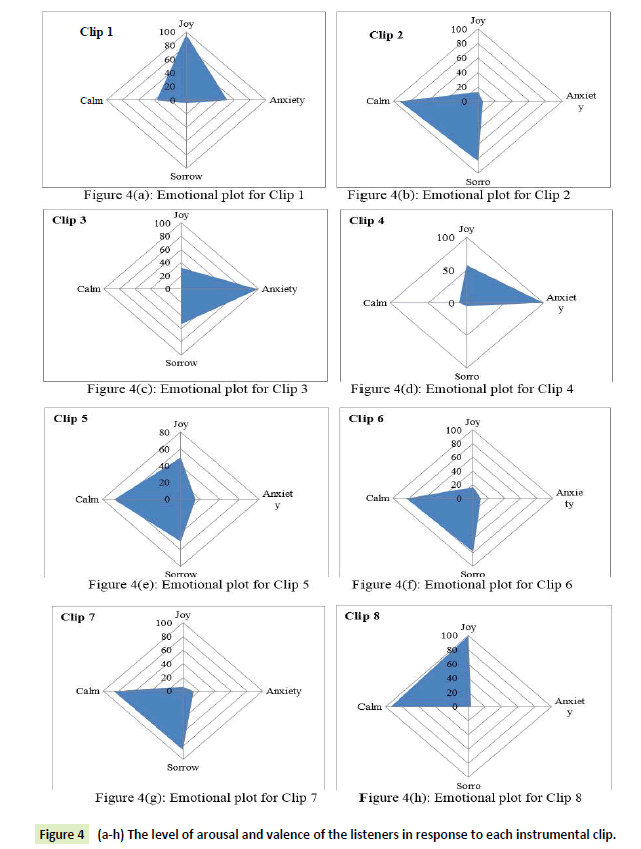
Figure 4 (a-h): The level of arousal and valence of the listeners in response to each instrumental clip.
It is evident from the figures that Clips 1/8 and 2/7 have similar arousal but are of opposite valence, as Clips 1 and 8 have been rated to be joyful with almost 90% accuracy while Clips 2 and 7 have been rated to be sorrowful with almost 80% accuracy. In a similar manner Clips 3/4 have been reported with 95% accuracy to convey anxiety while Clips 5/6 have been shown to be calm with 80% and 70% accuracy respectively. In this way, we have identified the arousal and valence corresponding to each instrumental clip and standardized the emotional appraisal pertaining to the clips. Next, the obtained EEG data for 10 participants for the same set of 8 cross cultural instrumental clips were analyzed with the help of well-known MFDFA technique [47]. Initially, the noise free EEG data was subjected to WT technique where from the amplitude envelope for alpha and theta waves were obtained for all the chosen electrodes. Figures 5 and 6 show the amplitude envelope of alpha and theta waves for a representative F3 electrode in response to Clip 1. The time series data of the alpha and theta waves so obtained were analyzed with MFDFA method. The qth order fluctuation function Fq(s) for 10 points of q in between −5 to +5 was obtained. The slope of the best fit line obtained from ln (Fq(s)) vs. ln(s) plot gives the values of h (q). A representative figure for variation of h(q) with q in response to Clip 1 for a particular electrode F3 (for a sample person) in both alpha and theta domain have been shown in Figures 7 and 8. The shuffled values of h(q) has also been shown in the same figure (in blue dotted lines). The variation of h(q) with q clearly indicates a multi-fractal behavior for both alpha and theta waves, as the shuffled values show remarkable difference from that of the original values. It is also evident from the figures that in most cases the values of h(q) decreases with increasing q which as another evidence of multi-fractal ity in the time series. The shuffled values of the time series, on the other hand shows very little variation or sometimes no variation, showing mono-fractal behavior, since all the long range correlations are destroyed during random shuffling of the time series data.
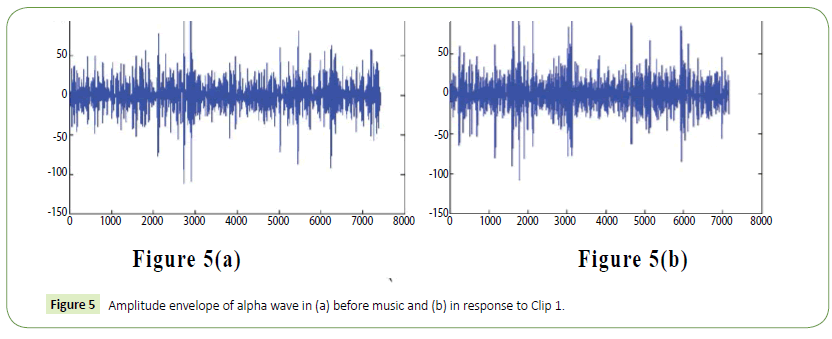
Figure 5: Amplitude envelope of alpha wave in (a) before music and (b) in response to Clip 1.
Figure 6: Amplitude envelope of theta wave in (a) before music and (b) in response to Clip 1.
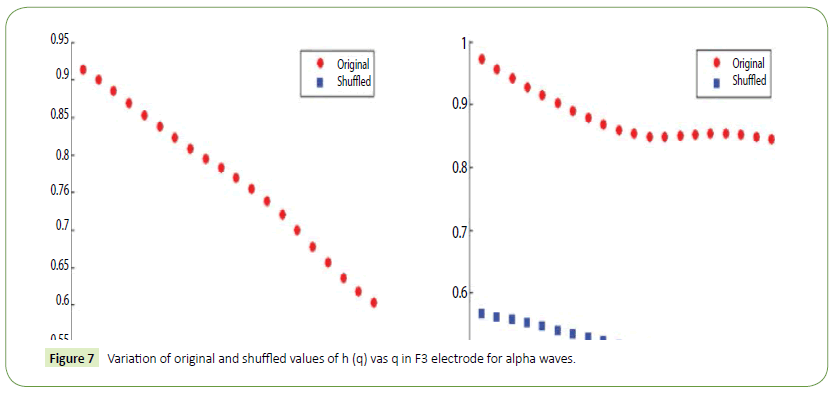
Figure 7: Variation of original and shuffled values of h (q) vas q in F3 electrode for alpha waves.
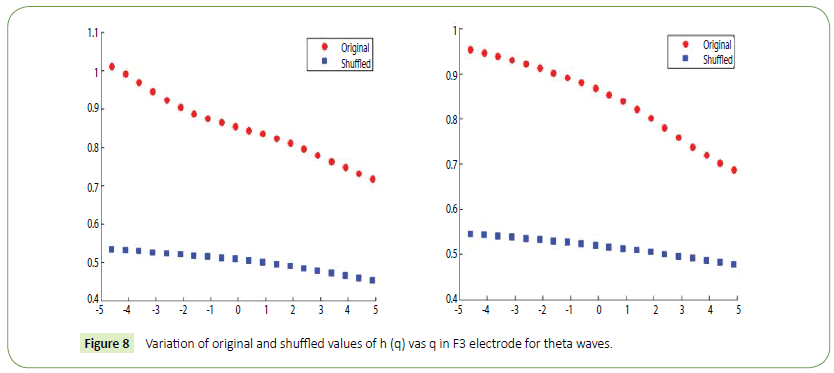
Figure 8: Variation of original and shuffled values of h (q) vas q in F3 electrode for theta waves.
The amount of multi-fractal ity can be determined quantitatively in each of the electrode from the width of the multi-fractal spectrum [f(α) vs α]. A representative figure showing the multifractal spectrum for alpha and theta waves (both original and shuffled for a single person) before and after playing Clip 1 for electrode F3 have been shown in Figures 9 and 10. As is evident from the figure the values of Wshuffled are in general lower than the values of Woriginal. This indicates that the multi-fractal ity in the EEG signal is due to both broad probability distribution as well as long range correlation. But, multi-fractal ity due to long range correlation is more effective as the shuffled values show much less multi-fractal ilty as compared to the original value in both the frequency domains. In case of shuffled values, the spectral width shows a peak value at around 0.5, which shows mono-fractal behavior for the shuffled signals. For the sake of comparison, in Figure 11 we have shown the variation of multifractal width in both alpha and theta domain the response to Clip 1. It is evident that the spectral width is significantly different for the different experimental conditions ascribed to the emotional intensity of the clips and the arousal caused in different locations of the brain.

Figure 9: Multi-fractal spectrum [f(α) vs. α] of alpha waves for a particular electrode F3.

Figure 10: Multi-fractal spectrum [f(α) vs. α] of theta waves for a particular electrode F3.

Figure 11: Variation of multi-fractal width in alpha and theta domain for F3 electrode in response to Clip 1.
The values of spectral width were averaged for all the persons and the averaged values are presented in Table 3 along with the Standard deviation (SD) values computed for each experimental condition.
| |
F3 |
F4 |
F7 |
F8 |
Fz |
O1 |
O2 |
T3 |
T4 |
| |
Alpha |
Theta |
Alpha |
Theta |
Alpha |
Theta |
Alpha |
Theta |
Alpha |
Theta |
Alpha |
Theta |
Alpha |
Theta |
Alpha |
Theta |
Alpha |
Theta |
| Part 1 |
0.94 + 0.05 |
1.21 +
0.07 |
0.89 +
0.06 |
1.08 +
0.11 |
0.97 +
0.07 |
1.19 +
0.06 |
1.02 +
0.08 |
1.22 +
0.08 |
0.89 +
0.07 |
1.15 +
0.08 |
0.75 +
0.08 |
1.06 +
0.07 |
0.76 +
0.08 |
1.06 +
0.09 |
0.87 +
0.10 |
1.02 +
0.08 |
0.84 +
0.09 |
1.11 +
0.07 |
| Part 2 |
0.83 +
0.06 |
0.92 +
0.05 |
0.84 +
0.05 |
0.88 +
0.12 |
0.83 +
0.08 |
1.06 +
0.05 |
0.94 +
0.07 |
1.06 +
0.13 |
0.78 +
0.05 |
0.94 +
0.07 |
0.64 +
0.06 |
0.95 +
0.04 |
0.68 +
0.04 |
0.93 +
0.11 |
0.73 +
0.09 |
0.94 +
0.06 |
0.76 +
0.04 |
1.03 +
0.06 |
| Part 3 |
0.81 + 0.08 |
1.01 +
0.06 |
0.86 +
0.07 |
1.14 +
0.08 |
0.81 +
0.03 |
1.04 +
0.09 |
1.01 +
0.06 |
1.06 +
0.11 |
0.67 +
0.06 |
1.07 +
0.05 |
0.78 +
0.17 |
1.03 +
0.08 |
0.72 +
0.07 |
1.01 +
0.13 |
0.82 +
0.13 |
0.9 +
0.07 |
0.73 +
0.06 |
0.92 +
0.03 |
| Part 4 |
0.86 +
0.09 |
0.93 +
0.04 |
0.79 +
0.04 |
0.98 +
0.06 |
0.85 +
0.06 |
1.01 +
0.08 |
0.88 +
0.09 |
1.05 +
0.04 |
0.78 +
0.04 |
0.97 +
0.06 |
0.87 +
0.09 |
1.13 +
0.05 |
0.66 +
0.09 |
0.92 +
0.09 |
0.73 +
0.09 |
1.16 +
0.05 |
0.77 +
0.08 |
1.08 +
0.11 |
| Part 5 |
0.88 +
0.07 |
1.14 +
0.08 |
0.91 +
0.08 |
1.06 +
0.04 |
0.89 +
0.05 |
1.12 +
0.09 |
0.86 +
0.05 |
1.02 +
0.03 |
0.87 +
0.08 |
0.97 +
0.08 |
0.81 +
0.07 |
0.98 +
0.06 |
0.76 +
0.08 |
0.91 +
0.08 |
0.84 +
0.11 |
0.91 +
0.04 |
0.82 +
0.04 |
1.01 +
0.08 |
| Part 6 |
0.72 +
0.13 |
1.04 +
0.05 |
1.01 +
0.11 |
1.12 +
0.03 |
0.8 +
0.04 |
0.99 +
0.04 |
0.69 +
0.04 |
1.02 +
0.05 |
0.78 +
0.04 |
1.06 +
0.11 |
0.67 +
0.05 |
0.94 +
0.04 |
0.69 +
0.13 |
1.1 +
0.08 |
0.77 +
0.09 |
1.01 +
0.06 |
0.76 +
0.05 |
1.09 +
0.07 |
| Part 7 |
0.84 +
0.11 |
0.94 +
0.09 |
0.91 +
0.09 |
1.01 +
0.02 |
0.8 +
0.06 |
1.04 +
0.07 |
0.86 +
0.03 |
1.02 +
0.08 |
0.81 +
0.09 |
0.94 +
0.13 |
0.79 +
0.04 |
0.95 +
0.07 |
0.71 +
0.09 |
1.08 +
0.15 |
0.81 +
0.06 |
0.97 +
0.05 |
0.76 +
0.06 |
0.91 +
0.09 |
| Part 8 |
0.67 +
0.10 |
1.07 +
0.11 |
0.98 +
0.06 |
1.18 +
0.10 |
0.73 +
0.08 |
0.95 +
0.05 |
0.78 +
0.04 |
0.93 +
0.07 |
0.73 +
0.07 |
1.01 +
0.07 |
0.64 +
0.11 |
0.88 +
0.05 |
0.67 +
0.08 |
0.92 +
0.06 |
0.73 +
0.11 |
1.06 +
0.04 |
0.72 +
0.03 |
0.98 +
0.11 |
| Part 9 |
0.92 +
0.07 |
0.96 +
0.12 |
0.88 +
0.07 |
0.97 +
0.06 |
0.77 +
0.07 |
1.08 +
0.06 |
0.76 +
0.06 |
1.04 +
0.03 |
0.77 +
0.06 |
0.98 +
0.09 |
0.69 +
0.08 |
1.02 +
0.08 |
0.67 +
0.06 |
1.26 +
0.09 |
0.82 +
0.08 |
1.01 +
0.08 |
0.71 +
0.08 |
1.03 +
0.09 |
| Part 10 |
0.82 +
0.04 |
1.01 +
0.14 |
0.84 +
0.05 |
0.95 +
0.07 |
0.78 +
0.04 |
0.97 +
0.08 |
0.94 +
0.05 |
0.94 +
0.08 |
0.78 +
0.02 |
1.05 +
0.04 |
0.68 +
0.09 |
0.98 +
0.11 |
0.73 +
0.04 |
1.06 +
0.07 |
0.79 +
0.04 |
1.04 +
0.07 |
0.78 +
0.06 |
0.9 +
0.06 |
| Part 11 |
0.94 +
0.08 |
1.04 +
0.08 |
0.89 +
0.06 |
0.94 +
0.05 |
0.81 +
0.06 |
1.12 +
0.05 |
0.77 +
0.04 |
0.91 +
0.06 |
0.86 +
0.07 |
0.93 +
0.06 |
0.69 +
0.06 |
0.88 +
0.08 |
0.7 +
0.05 |
0.95 +
0.05 |
0.74 +
0.06 |
1.01 +
0.06 |
0.66 +
0.08 |
1.01 +
0.07 |
| Part 12 |
0.88 +
0.14 |
1.07 +
0.06 |
0.78 +
0.04 |
0.95 +
0.04 |
0.8 +
0.05 |
1.07 +
0.09 |
0.76 +
0.08 |
0.87 +
0.06 |
0.92 +
0.09 |
0.83 +
0.08 |
0.61 +
0.09 |
1.08 +
0.06 |
0.78 +
0.03 |
1.12 +
0.12 |
0.72 +
0.07 |
0.93 +
0.04 |
0.73 +
0.05 |
1.01 +
0.05 |
| Part 13 |
0.79 +
0.13 |
0.99 +
0.07 |
0.79 +
0.05 |
1.12 +
0.08 |
0.78 +
0.07 |
1.04 +
0.13 |
0.84 +
0.06 |
1.08 +
0.04 |
0.74 +
0.12 |
0.91 +
0.03 |
0.62 +
0.07 |
1.05 +
0.05 |
0.69 +
0.06 |
0.95 +
0.11 |
0.78 +
0.05 |
0.97 +
0.08 |
0.74 +
0.09 |
0.91 +
0.03 |
| Part 14 |
0.87 +
0.12 |
0.84 +
0.09 |
0.72 +
0.06 |
1.11 +
0.09 |
0.82 +
0.09 |
1.17 +
0.014 |
0.79 +
0.05 |
1.01 +
0.03 |
0.9 +
0.14 |
0.83 +
0.04 |
0.67 +
0.1 |
1.12 +
0.04 |
0.73 +
0.08 |
0.86 +
0.09 |
0.68 +
0.04 |
1.16 +
0.07 |
0.71 +
0.04 |
1.02 +
0.11 |
| Part 15 |
0.88 +
0.16 |
1.1 +
0.11 |
0.89 +
0.05 |
1.06 +
0.06 |
0.86 +
0.06 |
1.05 +
0.17 |
0.96 +
0.03 |
0.95 +
0.07 |
0.86 +
0.17 |
1.09 +
0.06 |
0.68 +
0.06 |
0.99 +
0.07 |
0.67 +
0.06 |
1.02 +
0.08 |
0.88 +
0.05 |
0.88 +
0.05 |
0.82 +
0.05 |
1.17 +
0.06 |
| Part 16 |
0.72 +
0.11 |
1.02 +
0.09 |
0.77 +
0.08 |
0.97 +
0.05 |
0.73 +
0.07 |
0.96 +
0.09 |
0.84 +
0.08 |
0.9 +
0.06 |
0.8 +
0.15 |
0.93 +
0.07 |
0.58 +
0.04 |
1.08 +
0.03 |
0.61 +
0.07 |
0.99 +
0.03 |
0.8 +
0.06 |
0.98 +
0.09 |
0.72 +
0.06 |
1.07 +
0.02 |
| Part 17 |
0.84 +
0.09 |
1.18 +
0.04 |
0.74 +
0.07 |
0.93 +
0.08 |
0.84 +
0.05 |
1.14 +
0.07 |
0.80 +
0.09 |
1.22 +
0.06 |
0.97 +
0.11 |
1.05 +
0.13 |
0.74 +
0.08 |
0.90 +
0.13 |
0.84 +
0.08 |
1.30 +
0.05 |
0.81 +
0.07 |
1.04 +
0.07 |
0.88 +
0.09 |
1.0 +
0.07 |
Table 3: Variation of alpha and theta multifractality in different experimental conditions.
Table 3 shows the variation of multi-fractal width in different experimental conditions 1 to 17 for the different electrodes chosen in our study in both the frequency domains. We have computed the changes in multi-fractal widths for the four different categories of emotional arousal chosen. Thus, we have tried to see the changes in brain response when the valence is kept constant for two different clips. In this way, the following figures show the changes in multi-fractal spectral width of alpha and theta waves for the four emotional categories chosen (computed in percentage). Figures 12 to 15 gives the change in multi-fractal width (in percentage) corresponding to alpha wave for the nine electrodes chosen.

Figure 12: Change in alpha multi-fractal width for the two high joy clips.

Figure 13: Change in alpha multi-fractal width for the two high sorrow clips.

Figure 14: Change in alpha multi-fractal width for the two high anxiety clips.

Figure 15: Change in alpha multi-fractal width for the two high serenity clips.
The figures have the following interesting observations:
Clips 1 and 8 which were rated as ~ 90% joy in the listening test data have reported a decrease in spectral width unanimously across all the scalp electrodes of the frontal, temporal and occipital lobes. The maximum dip, however are seen in the odd electrodes, i.e., F3, F7, O1 and T3 respectively, though the even electrodes have significant fall in spectral width as is evident from the figures. The simultaneous involvement of the different lobes of brain in the processing of joyful musical clips points in a direction opposite to the conventional valence lateralization theory, which says that only the left frontal lobe is involved in processing of joyful emotions. Here, we see that though the percentage of fall in complexity is higher in the left electrodes (of all the lobes), the complexity changes significantly for the even electrodes as well.
In case of Clips 2 and 7 rated as ~80% sorrow, we see differential processing of the sad emotion in respect to left and right frontal electrodes. The left frontal electrodes F3 and F7, as well as the left occipital electrode O1 show an increase in complexity of alpha rhythms while, the right frontal electrodes F4 and F8 register a dip in complexity. The temporal electrodes show opposite phenomenon compared to the frontal one, with T3 showing a dip in complexity while in T4 complexity increases a little.
In case of valence anxiety, we again find unanimous response across all the scalp electrodes which show a dip in complexity, except for F4 where a rise in complexity is seen for both Clips 3 and 4. The arousal effects corresponding to alpha rhythms are more significant again for the frontal electrodes F3, F8 and an occipital electrode O1, while F4 demonstrates a considerable increase in alpha multi-fractal ity. We thus hypothesize that both anxiety (alias fear) and joy (alias happy) can be regarded as intense emotions which cause an arousal in almost all the lobes of the brain, manifested in a sharp dip in the multi-fractal ity of alpha rhythms generated from the respective lobes.
The emotion “serene” failed to generate any significant response from other electrodes except the frontal F3 and F4, which have registered a dip in the complexity. This can be attributed to the intensity of the valence “serene”. We have seen that emotions with high intensity have generated an uniform response in alpha rhythms across the electrodes, while the emotions with low intensity have generated lateralized or negligible response in the electrodes.
Another interesting observation is that, whatever be the valence of the musical clips, the frontal electrodes F3 and F4 have always shown significant increase or decrease of alpha multi-fractal ity. This corroborates the findings of previous works where the frontal lobe was attributed to be the main contributor for processing of musical emotions. Though, in these work we have seen electrodes from other regions getting aroused while processing of musical emotions.
The figures also provide a new knowledge regarding the age old debate of universality of music [69]. Here Clips 1 and 8 consists of instrumental clips of different cultures namely Western and Indian classical respectively, but the response obtained across the wide variety of subjects in listening test as well as in the EEG alpha rhythm analysis is strikingly uniform. In the same way Clips 3 and 4 are cross cultural clips which have shown to convey anxiety (or fear) valence in the listeners significantly. Also the response in the EEG alpha rhythm multi-fractal ity is consistent in all the electrodes. The clips 5 and 6 though cross-cultural and induce consistent amount of same valence (i.e., calm or serenity) in the listeners, report ambiguous response in the listening test. The arousal caused is more significant in Clip 6 (Indian Classical) as compared to Clip 5 (Western).
One way ANOVA [69] tests were conducted separately for the clips belonging to the same valence. While the clips with valence joy and anxiety yielded 95% confidence in results, clips belonging to the valence sorrow and serene yielded 90% and 80% confidence in results respectively.
The following figures show the response of the same clips in theta domain. The difference in multi-fractal spectral width (in percentage) in response to each of the Clips is computed from Table 3 and plotted in Figures 16-19.

Figure 16: Change in theta multi-fractal width for the two high joy clips.

Figure 17: Change in theta multi-fractal width for the two high sorrow clips.

Figure 18: Change in theta multi-fractal width for the two high anxiety clips.

Figure 19: Change in theta multi-fractal width for the two high serenity clips.
In case of theta domain, the responses of EEG data to the different cross cultural instrumental clips shows to have a certain level of inconsistency as compared to the values obtained in the alpha domain. Nevertheless, we have the following observations from the graphs of multi-fractal width obtained from analysis of theta frequency:
The two cross-cultural instrumental clip 1 and 8, having high joy content again show uniform dip in theta multi-fractal width throughout all the electrodes in general. All the frontal electrodes show significant dip in theta complexity along with the frontal midline electrode Fz, which has been earlier reported to play a significant role in theta domain to be a marker for pleasantness of a musical clip. An interesting point to be noted here is that Clip 8 i.e., the Hindustani instrument consistently has a lesser dip in spectral with compared to the 1st clip, the Western accordion. In electrodes O1 and T3, even an increase in theta multi-fractal ity is manifested in Clip 8, which hints in the direction of differential cognitive engagement to some extent in the theta domain when it comes to processing of different types of music.
In case of the two sad clips, most of the electrodes remain inert to some extent except for the two temporal electrodes T3 and T4, where sufficient increase in theta multi-fractal ity is noted. The two occipital electrodes, O1 and O2, also shows differential processing of the sorrow clips, the multi-fractal ity in the odd electrode increase, while it decreases in the even ones. Clips 2 and 7, though instruments of Indian classical show different arousal in different positions of brain as is evident from the figures, thus in F3 we have sharp dip for Clip 7, while for Clip 2 we have sharp dip in F4 electrode. This can be attributed to the differential arousal caused by the two same valence clips. Thus, in the theta domain we have identified the regions in which the valence, sorrow is processed from the arousal caused in the particular lobes manifested in the changes of theta complexity.
The two high anxiety cross-cultural clips show distinct ambiguity in the arousal activities corresponding to different electrodes. In the two temporal electrodes, consistent increase in theta multifractal ity is noted along with two frontal electrodes, F4 and Fz. Electrodes F3 and O1 show differential processing of the two cross-cultural high anxiety clips. While in F3, Clip 3 causes a dip in multi-fractal ity, in O1 we have significant increase for Clip 3, the reverse effect is seen for Clip 4 (Indian classical instrument). This may be the cause of different intensities of the valence anxiety induced by the Western classical instrument Organ and the Indian classical instrument, Tabla.
The two cross cultural clips conveying the valence calmness or serenity has given inconsistent results even in the theta domain, as in the alpha domain. In the valence, calm, the temporal lobes remain almost unaffected showing little or no change in most cases. The theta multi-fractality decreases for frontal electrodes F7 and F8, while differential arousal based activities are seen in O1 and O2. In both these occipital electrode, theta multifractal ity increases for Clip 5 (Western instrument, piano) while it increases considerably for Clip 6 (Indian classical instrument, sitar). The reverse effect is seen for the frontal midline electrode Fz. Again, this observation hints in the direction of different cognitive engagement for the musical clips of two different genres.
One way ANOVA [70] gave 90% confidence in results for the happy clips. 85% for the sorrow and anxiety clips respectively, 70% for the serenity clips.
The following Table (Table 4) gives the detailed ANOVA tests for alpha and theta EEG frequency ranges where statistical difference is shown for the pair of similar valence clips. Tukey-Kramer HSD test was performed as post-hoc analysis for those pairs which show significant difference in the ANOVA test.
| |
ANOVA Test |
Tukey- HSD Test
(Post hoc analysis) |
Confidence Level |
| Clips |
F-value |
p-value |
p-value |
|
|
| |
Alpha |
Theta |
Alpha |
Theta |
Alpha |
Theta |
Alpha |
Theta |
| 1 vs 8 |
(1, 34)=7.9 |
(1,34)=26 |
<0.08 |
<0.00015 |
<0.008 |
<0.0001 |
95% |
90% |
| 2 vs 7 |
(1,34)=117 |
(1,34)=20.0 |
<0.00001 |
<0.01 |
<0.0001 |
<0.015 |
90% |
85% |
| 3 vs 4 |
(1,34)=24. |
(1,34)=33.5 |
<0.00002 |
<0.00002 |
<0.0001 |
<0.0001 |
95% |
85% |
| 5 vs 6 |
(1,34)=11.2 |
(1,34)=6.58 |
<0.035 |
<0.046 |
<0.005 |
<0.04 |
70% |
70% |
Table 4: ANOVA and Tukey HSD (post hoc) analysis results.
Thus, we have compared the clips belonging to the same valence but having different arousal intensity in the theta domain. The musical clips which have the same arousal and different valence can also be identified by their specific response in the different electrodes as briefed above. With these observations, we look forward to device an algorithm which can be applied as an automated one for the identification of musical emotions using latest state of the art non-linear techniques.
Conclusion
Music has been in the human civilization for eons. It has often been referred to as the universal language which is, and has been present in all human civilization known. A group of researchers even claim that music came much before speech. The effect of music on brain has been well documented in the past; one of them even goes to the extent to claim that individuals with Alzheimer’s disease often recognize songs to the end of life. Recognizing and categorizing musical emotion thus remains a challenging problem primarily due to the inherent ambiguities of human emotions. The perception of emotion is particularly important in the musical domain because music appears to be primarily dedicated to evoking emotions. According to Yehudi Menuhin, a well-known violinist “Music creates order out of chaos: for rhythm imposes unanimity upon the divergent, melody imposes continuity upon the disjointed, and harmony imposes compatibility upon the incongruous” [71].
In this study, we envisaged to do the task of categorization and differentiation of four basic musical emotions with the help of robust non-linear MFDFA analysis and develop a parameter with which we can quantify and differentiate arousal and valence effects of cross cultural musical clips. The protocol for studying the effect of different music signals on brain has been described in detail in the earlier sections. Step 1 is to obtain the degree of complexity of brain in terms of quantitative parameter, w (multifractal spectral width). Step 2 is the outcome of the effect of music signals, again in terms of w, and ultimately Step 3 is the status of the complexity of brain signals after the removal of music signals. The values ‘w’ changes with the three different steps which has been elaborated earlier in the table. The changes in the value of ‘w’ in different experimental conditions (before, with and after music conditions) is quite significant and of course logically is not a manifestation of only spontaneous EEG, rather indicates a change of complexity due to the input of music stimuli. The main findings of this work can be pointed as under:
The multi-fractal analysis of alpha frequency data points strongly in the direction of universality of music predominantly in the processing of two strong emotions (joy and anxiety) uniformly throughout the brain areas. The strong involvement of all the scalp electrodes in the processing of these two emotions is substantiated by the decrease in alpha complexity uniformly for the two instrumental clips of different origin. The decrease in alpha multi-fractal width can thus be a strong indicator of the valence of emotions and the amount of change can give a measure of arousal corresponding to that clip.
The other two emotions i.e., sorrow and calm give an indication of the lateralization processing of valence, leading to differential increase or decrease of alpha multi-fractal ity in odd-even (left/right) electrodes. Thus, we have an idea about electrode specificity also, regarding which emotion is processed by which electrodes, or whether all the electrodes take part simultaneously in the processing of valence.
In case of multi-fractal analysis on theta frequency, we have distinguishable response for Indian and Western instrumental clips of the same valence. Though the musical Clips for joy uniformly caused a decrease in multi-fractal ity across all the electrodes, but the arousal (measured from the amount of change of multi-fractal ity of theta) is significantly different for the two cross-cultural clips. This may be caused due to familiarity or other effects as the participants of the EEG test are all of Indian origin. Other clips gave electrode (alias lobe) specific arousal corresponding to a specific valence in the theta domain.
This work presents new and interesting data shedding light on universality of human brain functions as well as domain specificity of arousal valence in musical emotion. We have developed the multi-fractal spectral width (of alpha or theta EEG waves) as a parameter through which we can explore the arousal and valence based effects of different musical clips. The application of this work in the direction of cognitive music therapy on psychological patients utilizing a diverse variety of instrumental clips is immense. Investigating with more number and variety of clips and greater respondents in EEG study would lead to more robust and definite results.
Finally, we can conclude that this work provides, for the first time, new data which may link the concept of arousal-valence based emotion with domain specific activity of the brain and shows a window to the comprehension of interactive brain function with the help of cross-cultural music.
Acknowledgements
The first author, AB acknowledges the Department of Science and Technology (DST), Govt. of India for providing (A.20020/11/97- IFD) the DST Inspire Fellowship to pursue this research work. One of the authors, SS acknowledges the West Bengal State Council of Science and Technology (WBSCST), Govt. of West Bengal for providing the S.N. Bose Research Fellowship Award to pursue this research (193/WBSCST/F/0520/14).
18613
References
- Bukofzer S, Manfred F (1949) Music in the Baroque era from Monteverdi to Bach.
- Schlaug G (2005) Effects of music training on the child's brain and cognitive development. Ann NY AcadSci1060: 219-230
- Hyde KL (2009) Musical training shapes structural brain development.JNeurosci29: 3019-3025.
- Hallam S (2010) The power of music: Its impact on the intellectual, social and personal development of children and young people. Int J Music Educ28: 269-289.
- Wan CY, Gottfried S (2010) Music making as a tool for promoting brain plasticity across the life span. Neuroscientist 16: 566-577.
- Chamorro P, Tomas P (2009) The effects of background auditory interference and extraversion on creative and cognitive task performance. Int J Psychol Stud 1: p2
- Phillips C (2004) Doesbackground music impact computer task performance? Usability News 6: 1-4.
- Erkkila J (2008) The effect of improvisational music therapy on the treatment of depression: protocol for a randomized controlled trial. BMC psychiatry 8: 50.
- Ozdemir L, Nuran A (2009) Effects of multisensory stimulation on cognition, depression and anxiety levels of mildly-affected Alzheimer’s patients. J NeurolSci283: 211-213.
- Voss Jo A (2004) Sedative music reduces anxiety and pain during chair rest after open-heart surgery. Pain 112: 197-203.
- Russell JA (1980) A circumplex model of affect. J PersSocPsychol39: 1161-1178
- Russell JA (1989) Measures of emotion. In R. Plutchik and H. Kellerman (Eds.), Emotion: Theory, research, and experience. Toronto: Academic 4: 83-111.
- Scherer KR (2004) Which emotions can be induced by music? What are the underlying mechanisms? And how can we measure them?J New Music Res 33: 239-251.
- Juslin PN, Petri L (2004) Expression, perception, and induction of musical emotions: A review and a questionnaire study of everyday listening.J New Music Res 33: 217-238.
- Salimpoor VN (2009) The rewarding aspects of music listening are related to degree of emotional arousal. PloS one 4: e7487
- Schmidt LA, Trainor LJ (2001) Frontal brain electrical activity (EEG) distinguishes valence and intensity of musical emotions. Cognition & Emotion15: 487-500.
- Jonghwa K, Elisabeth A (2008) Emotion recognition based on physiological changes in music listening. Pattern Analysis and Machine Intelligence, IEEE Transactions on 30: 2067-2083.
- Mathur A, Vijayakumar SH, Chakrabarti B, Singh NC (2015) Emotional responses to Hindustani raga music: The role of musical structure. Front Psychol6.
- Wieczorkowska AA, Datta AK, Sengupta R, Dey N, Mukherjee B (2010) On search for emotion in Hindusthani vocal music. In Advances in music information retrieval. Springer Berlin Heidelberg. pp. 285-304.
- Trainor LJ, Louis A (2003) Schmidt. Processing emotions induced by music. The Cognitive Neuroscience of Music pp: 310-324.
- Sammler D (2007) Music and emotion: Electrophysiological correlates of the processing of pleasant and unpleasant music. Psychophysiology 44: 293-304.
- Koelsch S (2009) Investigating emotion with music: an fMRI study.Human Brain Mapping 27: 239-250.
- Khalfa S (2005) Brain regions involved in the recognition of happiness and sadness in music. Neuro-report 16: 1981-1984.
- Hamann S, Mao H (2002) Positive and negative emotional verbal stimuli elicit activity in the left amygdala. Neuroreport 13: 15-19.
- Khalfa S (2008) Evidence of lateralized anteromedial temporal structures involvement in musical emotion processing. Neuropsychologia 46: 2485-2493.
- Balkwil L, Thompson W (1999) A cross-cultural investigation of the perception of emotion in music: psychophysical and cultural cues. Music Perception 17: 43–64.
- Blood AJ (1999) Emotional responses to pleasant and unpleasant music correlate with activity in paralimbic brain regions. Nature neuroscience 2: 382-387.
- Olson IR, Alan P, Youssef E (2007) The enigmatic temporal pole: a review of findings on social and emotional processing. Brain 130: 1718-1731.
- Kosslyn SM (1996) Image and brain: The resolution of the imagery debate. MIT press.
- Mellet E (1995) A positron emission tomography study of visual and mental spatial exploration. J CognNeurosc 7: 433-445.
- Schmidt B, Simon H (2009) Resting frontal EEG alpha-asymmetry predicts the evaluation of affective musical stimuli. NeurosciLett460: 237-240.
- Aftanas LI, Golocheikine SA (2001) Human anterior and frontal midline theta and lower alpha reflect emotionally positive state and internalized attention: High-resolution EEG investigation of meditation. NeurosciLett310: 57-60.
- Conte E (2009) Fractal fluctuations and quantum-like chaos in the brain by analysis of variability of brain waves: A new method based on a fractal variance function and random matrix theory: A link with El-Naschie fractal Cantorian space–time and V. Weiss and H. Weiss golden ratio in brain. Chaos, Solitons and Fractals41: 2790-2800.
- Klonowski W (2007) From conformons to human brains: an informal overview of nonlinear dynamics and its applications in biomedicine. Nonlinear Biomedical Physics 1:5.
- Huang NE, Shen Z, Long SR, Wu MC, Shih HH, et al. (1998) The empirical mode decomposition and the hilbert spectrum for non linear and non stationary time series analysis. Proc R Soc A 454: 903–995.
- Ossadnik SM, Buldyrev SV, Goldberger AL, Havlin S, Mantegna RN, et al. (1994) Correlation approach to identify coding regions in DNA sequences. Biophys J 67: 64–70.
- Peng CK, Buldyrev SV, Havlin S, Simons M, Stanley HE, et al. (1994) Mosaic organization of DNA nucleotides. Phys Rev E 49: 1685–1689.
- Blesic S, Milosevic S, Stratimirovic D, Ljubisavljevic M (1999) Detrended fluctuation analysis of time series of a firing fusimotor neuron. Physica A 268: 275–282.
- Ashkenazy Y, Ivanov PC, Havlin S, Peng CK, Goldberger AL, et al. (2001) Magnitude and sign correlations in heartbeat fluctuations. Phys Rev Lett 86: 1900–1903.
- Blesic S, Milosevic S, Stratimirovic D, Ljubisavljevic M (1999) Detrended fluctuation analysis of time series of a firing fusimotor neuron. Physica A 268: 275–282.
- Gao T (2007) Detrended fluctuation analysis of the human EEG during listening to emotional music. J Elect Sci Tech Chin 5: 272-277.
- Karthick NG, Thajudin AVI, Joseph PK (2006) Music and the EEG: A study using nonlinear methods. Biomedical and Pharmaceutical Engineering, 2006. ICBPE 2006. International Conference on IEEE.
- Banerjee A (2015) Study on brain dynamics by non linear analysis of music induced eeg signals (in press) Physica A.
- Hu K, Ivanov PC, Chen Z, Carpens P, Stanley HE (2001). Effects of trends on detrended fluctuation analysis. Phys Rev E 64: 011114.
- Kantelhardt JW, Bunde EK, Henio HAR, Havlin S, Bunde A (2001) Detecting long-range correlations with detrended fluctuation analysis. Physica A 295: 441–454.
- Chen Z, Ivanov PC, Hu K, Stanley HE (2002) Effect of non-stationarities on detrended fluctuation analysis. Phys Rev E 65: 041107.
- Kantelhardt JW, Zschiegner SA, Bunde EK, Havlin S, Bunde A, et al. (2002) Multifractal detrended fluctuation analysis of nonstationary time series. Physica A 316: 87-114.
- Peng CK, Buldyrev SV, Havlin S, Simons M, Stanley HE, et al. (1994) Mosaic organization of DNA nucleotides. Physical review e 49: 1685.
- Banerjee A, Sanyal S, Patranabis A, Banerjee K, Guhathakurta T, et al. (2016) Study on brain dynamics by non linear analysis of music induced EEG signals. Physica A: Statistical Mechanics and its Applications 444: 110-120.
- Kantelhardt JW, Rybski D, Zschiegner SA, Braun P, Bunde EK, et al. (2003) Multifractality of river runoff and precipitation: comparison of fluctuation analysis and wavelet methods. Physica A 330: 240–245.
- Sadegh MM, Jafari GR, Ghasemi F, Rahvar S, Reza RTM (2006) Multifractal detrended fluctuation analysis of sunspot time series. J Stat Mech 0602: P02003.
- Telesca L, Lapenna V, Macchiato M (2004) Mono- and multi-fractal investigation of scaling properties in temporal patterns of seismic sequences. Chaos SolitonFract 19: 1-15.
- Dutta S, Dipak G, Sucharita C (2013) Multifractaldetrended fluctuation analysis of human gait diseases. Front Physiol4.
- Sanyal S, Banerjee A, Patranabis A, Banerjee K, Sengupta R, et al. (2016) A study on improvisation in a musical performance using multifractaldetrended cross correlation analysis. Physica A 462: 67-83.
- Stanley HE (1999) Statistical physics and physiology: monofractal and multifractal approaches. Physica A 270: 309-324.
- Davis A (1994) Multifractal characterizations of non-stationarity and intermittency in geophysical fields: Observed, retrieved, or simulated. J Geophys Res Atmos(1984–2012) 99. D4: 8055-8072.
- Maity AK (2015) Multifractaldetrended fluctuation analysis of alpha and theta EEG rhythms with musical stimuli. Chaos, Solitons & Fractals 81: 52-67.
- Wu Z, Norden E (2009) Ensemble empirical mode decomposition: A noise-assisted data analysis method. Adv Adapt Data Anal 1: 1-41.
- Looney D (2008) Ocular artifacts removal from EEG using EMD.Advances in Cognitive Neurodynamics ICCN 2007. Springer Netherlands pp: 831-835.
- Chen X (2014) Apreliminary study of muscular artifact cancellation in single-channel EEG. Sensors 14: 18370-18389.
- Hazarika N (1997) Classification of EEG signals using the Wavelet transform, Signal Processing. H.W. Wilson - AST 59: 61.
- Bengtsson SL (2005) Extensive piano practicing has regionally specific effects on white matter development. Nat Neurosci 8: 1148-1150.
- Akin M, Arserim MA, Kiymik MK, Turkoglu I (2001) A new approach for diagnosing epilepsy by using wavelet transform and neural networks. In: Engineering in Medicine and Biology Society, 2001. Proceedings of the 23rd Annual International Conference of the IEEE 2: 1596-1599.
- Ihlen EAF (2012) Introduction to multifractaldetrended fluctuation analysis in Matlab. Front Physiol3.
- Ashkenazy Y (2003) Nonlinearity and multifractality of climate change in the past 420,000 years. Geophys Res Lett 30: 22.
- Figliola A (2007) Study of EEG brain maturation signals with multifractaldetrended fluctuation analysis. Nonequilibrium Statistical Mechanics and Nonlinear Physics (AIP Conference Proceedings). 913.
- Fritz T, Jentschke S, Gosselin N, Sammler D, Peretz I, et al. (2009) Universal recognition of three basic emotions in music.Current Biology 19: 573-576.
- John E (2004) Fruend’smathematical statistics with application, Chapter 15: Design and analysis of experiments.
- Coakes SJ, Steed L (2009) SPSS: Analysis without anguish using SPSS version 14.0 for Windows. John Wiley & Sons, Inc. NY, USA.