Keywords
Ovarian cancer; Protein oxidative modification; Cytokines
Introduction
Ovarian cancer (OC) remains the leading cause of death from cancer among gynecologic tumors [1]. According to EuroCare-5 Study statistics, the 5-year survival rate for OC is 30% [2]. 11,700 ovarian malignant tumors and 7,300 deaths from them are registered annually in Russia [3]. Low survival rate of ovarian cancer patients results from late diagnosis. At present, 70% of cases are diagnosed advanced disease [4]. The observed increase in 5-year survival of patients with malignant ovarian tumors in Europe by 3% and in the U.S. by 4% over the past decade can be explained not so much by diagnostics improvement, as by effective application of platinum-based chemotherapy in a treatment of disseminated forms of ovarian cancer and germ cell tumors.
Economic loss resulting from the consequences of malignant tumors incidence is about 90 billion rubles per year and, according to some authors, is going to increase [5]. Therefore it is necessary to correlate the response to treatment with economic factors to determine the cost efficiency of the management of patients with OC. At present, there is a view of chemotherapy futility for cancer patients in terminal stages [6-9]. In this regard, the urgency of clarifying diagnostics methods of advanced (III-IV) disease stage is enhancing.
Ovarian malignant tumors are characterized by absence of symptoms. There are no pathognomonic symptoms of gonadal neoplasia. According to National guidelines [10], diagnosis of OC includes not only precise history taking, full physical, bimanual, recto-vaginal examination, abdominal and transvaginal ultrasound and CT scan, but also chemistry panel and detailed biochemical and clinical blood tests, and determination of the level of tumor markers. For final diagnosis appropriate surgical staging is performed. Due to the complexity of diagnosis and staging of ovarian cancer, the search is conducted for markers that would help to clarify the stage of the tumor process.
Protein oxidative modification is considered one of the earliest and reliable indicators of redox homeostasis disruption [11]. The aim of our research was to develop a clarifying diagnosis method of progressive OC forms on the basis of determining the blood plasma POMP level.
Methods
We studied 300 patients with primary OC stage III-IV according to the classification of the International Federation of Obstetrics and Gynecology (FIGO) and the TNM (7th edition 2010), who were treated the first time during the period from January 2010 till August 2013 in Ulyanovsk Regional Clinical Oncology Center. FIGO staging of ovarian cancer changed from 1 January 2014. However, a study was carried out on the basis of the previous FIGO classification, which has been used on the territory of the Russian Federation until 2015. FIGO stage based on surgical data and TNM categories based on clinical and/or pathological classification. Using the standardized methods, 21 indicators were defined in blood plasma of each patient: leukocyte count, neutrophil count, levels of metalloproteinases MMP-2 and MMP- 9 in neutrophils and blood serum, levels of cytokines IL-1β, IL-6, IL-10, IFN-γ, TNF-α, levels of Her-2/neu and CA125, 4 indicators of POMP in plasma: the level of malondialdehyde (MDA), the activity of glutathione reductase (GR), glutathione S-transferases (GTs), and catalase. The parameters are shown in Tables 1-4 and distributed randomly.
| IndicatorStage |
Le |
PMN |
Her-2/neu |
MMP-2 PMN |
-9 PMN |
| IIIstage |
0,79675 |
0,596502 |
1,96315 |
0,650714 |
1,380432 |
| IVstage |
1,86213 |
0,8433268 |
1,94747 |
0,63294 |
2,034398 |
Table 1: Optimal values σ (Le, PMN, Her-2/neu, MMP-2, 9 in PMN) for stages III and IV ovarian cancer
| IndicatorStage |
POMP356nm |
POMP 370 nm |
POMP 430 nm |
POMP 530nm |
MDA |
Catalase |
| III stage |
5,25719 |
6,46599 |
3,93999 |
2,17439 |
0,996194 |
3,54199 |
| IV stage |
2,29001 |
2,63601 |
1,53241 |
0,53801 |
0,617518 |
0,28201 |
Table 2: Optimal values σ (POMP, MDA, Catalase) for stages III and IV ovarian cancer.
| IndicatorStage |
IL-6 |
IL-10 |
IL-1β |
IFN-λ |
CA-125 |
| IIIstage |
3,69995 |
0,88705 |
2,4446012 |
1,237234 |
1,20299 |
| IVstage |
1,35715 |
1,25999 |
2,304716 |
1,155144 |
1,18701 |
Table 3:Optimal values σ (IL-1β, IL-6, IL-10, IFN-λ, CA-125) for stages III and IV ovarian cancer
| IndicatorStage |
GR |
GST |
TNF-α |
MMP-2 serum |
MMP-9 serum |
| IIIstage |
1,89599 |
1,57761 |
1,044316 |
2,0501928 |
3,932618 |
| IVstage |
4,01999 |
0,67055 |
0,9374848 |
1,780624 |
3,879402 |
Table 4:Optimal values σ (GR, GST, TNF-α, MMP-2, 9 in serum) for stages III and IV ovarian cancer.
For each indicatorχi, i = 1, …, N  ,functions
were constructed, where each function describes probability density of reaching each stage out of two under consideration.
On the basis of these functions, likelihood ratio was constructed for each indicator (P.410) [3].
 (1)
(1)
Thus, for each indicator  , , intervals
  were defined, where
  ,correspondingly (D-threshold level). We united intervals
  into the multitude
  into the multitude
  , correspondingly.
For each indicator xi,i=1,....21 characteristic values were simply ordered by a tenfold-hundredfold reduction in each disease stage.
Consider three situations:
1) if  is with the property that
  ,
,  ,then it is necessary to check that
  ,
,  . If there is no contradiction, then disease stage j can be diagnosed.
1) if is with the property that  , then it is necessary to check that ,.If there is a contradiction, then D should be increased by 3%-10%.
3)if there is no  with the property that
  , then one should calculate the value
 (2)
(2)
If 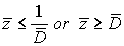 , then a corresponding disease stage can be diagnosed exactly. But if,
  then a patient’s disease stage can’t be determined exactly.
According to statistics, each parameter was divided into 5 groups. Statistics approximation of the distribution density 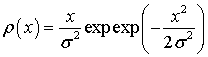 was made by the least square method. Optimal values σ are presented in Tables 1-4 Suppose threshold level D =1, then indicators intervals are defined as follows (Tables 5-8).
| IndicatorStage |
Le |
PMN |
Her-2/neu |
MMP-2 PMN |
-9 PMN |
| IIIstage |
[0;1,278] |
[0;0,993] |
(2,765;+∞] |
(0,907;+∞] |
[0;2,341] |
| IVstage |
(1,278;+∞] |
(0,993;+∞] |
[0;2,765] |
[0;0,907] |
(2,341;+∞] |
Table 5:Indicator intervals for stages III and IV ovarian cancer: Le, PMN, Her-2/neu, MMP-2,9 in PMN.
| Indicator Stage |
POMP 356 nm |
POMP 370 nm |
POMP 430nm |
POMP530nm |
Catalase |
MDA |
| III stage |
(4,638;+∞] |
(5,469; +∞] |
(3,232;+∞] |
(1,312; +∞] |
(0,900;+∞] |
(1,088;+∞] |
| IV stage |
[0;4,638] |
[0;5,469] |
[0;3,232] |
[0;1,312] |
[0;0,900] |
[0;1,088] |
Table 6:Indicator intervals for stages III and IV ovarian cancer: POMP, catalase, MDA.
| IndicatorStage |
IL-6 |
IL-10 |
IL-1β |
IFN-λ |
CA-125 |
| IIIstage |
(2,922;+∞] |
[0;1,480] |
(3,355;+∞] |
(1,690;+∞] |
(1,690;+∞] |
| IVstage |
[0;2,922] |
(1,480;+∞] |
[0;3,355] |
[0; 1,690] |
[0;1,690] |
Table 7:Indicator intervals for stages III and IV ovarian cancer: IL-1β, IL- 6, IL-10, CA-125 in serum
| IndicatorStage |
GR |
GST |
TNF-α |
MMP-2 serum |
MMP-9 serum |
| IIIstage |
[0;3,728] |
(1,370; +∞] |
(1,398; +∞] |
(2,697; +∞] |
(5,523;+∞] |
| IVstage |
(3,728;+∞] |
[0; 1,370] |
[0; 1,398] |
[0;2,697] |
[0;5,523) |
Table 8:Indicator intervals for stages III and IV ovarian cancer: GR, GST, TNF-α, MMP-2,9 in serum.
Results
Let's consider a patient in disease stage III (Table 9).
| Indicator |
Value |
Likelihood function, zi |
Stage |
| Le |
0,66 |
0,678 |
III |
| PMN |
0,4818 |
0,588 |
III |
| POMP 356 |
3.5 |
2,04 |
IV |
| POMP 370 |
7.1 |
0,292 |
III |
| POMP 430 |
5.5 |
0,027 |
III |
| POMP 530 |
3.4 |
1,179E-07 |
III |
| Her2 |
2.05 |
1,007 |
IV |
| CA125 |
3.1 |
0,938 |
III |
| MMP-2 serum |
2.4062 |
0,0007 |
IV |
| MMP-9 serum |
6.258 |
1 |
III |
| MMP-2 PMN |
0.403 |
1,06 |
IV |
| MMP-9 PMN |
1.6141 |
0,992 |
III |
| IL-6 |
6,27 |
1,045 |
III |
| IL-10 |
0 |
0,665 |
III |
| IL-1 β |
1.9942 |
1,079 |
IV |
| IFN- λ |
0.9932 |
1,094 |
IV |
| TNF-α |
0.8572 |
1,144 |
IV |
| MDA |
1.109 |
1,083 |
III |
| Catalase |
0 |
1 |
IV |
| GST |
1 |
1,1111 |
III |
| GR |
1.65 |
0,463 |
III |
Table 9:Likelihood function value Z1 for diagnostics parameters of ovarian cancer (stage III).
With reference to the 13 parameters (? 1, 2, 4, 5, 6, 8, 10, 12, 13, 14, 18, 20 and 21)-stage III can be diagnosed, with reference to the rest 8 parameters (? 3, 7, 9, 11, 15, 16, 17 and 19)-stage IV. As it is impossible to diagnose the stage exactly in this case, then using formula (2) we get = 2, 74796E-13. Suppose  ,then
,then  , consequently the patient has stage III of disease.
Let's consider a patient in disease stage IV (Table 10).
| Indicator |
Value |
Likelihood function, zi |
Stage |
| Le |
1.28 |
1,001 |
IV |
| PMN |
1.0624 |
1,1051 |
IV |
| POMP 356 |
1,1 |
4,7999 |
IV |
| POMP 370 |
2,9 |
3,632 |
IV |
| POMP 430 |
1,9 |
3,442 |
IV |
| POMP 530 |
1,0 |
3,227 |
IV |
| Her2 |
0,41 |
1,015 |
IV |
| CA125 |
1 |
1,017 |
IV |
| MMP-2 serum |
2,2355 |
1,093 |
IV |
| MMP-9 serum |
6,502 |
0,989 |
III |
| MMP-2 PMN |
0,345 |
1,048 |
IV |
| MMP-9 PMN |
2,1737 |
0,859 |
III |
| IL-6 |
2,08 |
2,689 |
IV |
| IL-10 |
0 |
1 |
III |
| IL-1β |
2,4637 |
1,055 |
IV |
| IFN-λ |
1,2837 |
1,062 |
IV |
| TNF-α |
0,9715 |
1,1184 |
IV |
| MDA |
0,516 |
2,099 |
IV |
| Catalase |
0,1 |
157,65 |
IV |
| GST |
4 |
0,2478 |
IV |
| GR |
0,42 |
4,713 |
IV |
Table 10:Likelihood function value, Z1 for diagnostics parameters of ovarian cancer (stage IV).
With reference to 3 parameters we can diagnose stage III, with reference to 18 parameters-stages IV. As it is impossible to diagnose the stage exactly in this case, then using formula (2), we get  = 280189, 27. Suppose threshold level
  consequently the patient has stage IV.
Approximation accuracy
Approximation accuracy was identified while checking the hypothesis of correspondence of parameter practical value to the theoretical law of density distribution by Pearson criterion (P.444) [3]. For checking statistical data is introduced
 (3)
(3)
Where N-the number of parameters groups, equals 5. The hypothesis is accepted when  , where α-the level of significance, equal 0.05. Approximation accuracy is calculated as γ = 1-α, equal 0.95.
Discussion
We have analyzed chemistry and hematology panel values of 300 OC patients and stated the absence of statistically significant difference between these values in various stages of the disease, as well as the absence of significant correlation relationships between above mentioned values and OC stage [12]. Also, we found no correlation between ??-125 level and cancer stage in primary OC patients.
According to the cited literature, the change in oxygen metabolism plays an important role in carcinogenesis [13]. It is stated that metabolism change from oxidative phosphorylation to glycolysis is related to the higher production of reactive oxygen species (ROS) [14]. Furthermore, electron transfer through pentose phosphate pathway to NADPH and GSH is enhanced. As a result, redox homeostasis in neoplasia changes [15]. There is an opinion stating that high proliferative activity, drug resistance, apoptosis reduction and immortalization of tumor cells can be mediated by increasing of ROS levels, which results in changing of gene expression [16].
Protein oxidative modification products (POMP)-protein carbonyl derivatives-have long-term half-life; their number increases not only due to oxidative posttranslational modification, but also proteolytic destruction.
Applying assumed parameters of follow-up examination, stage clarification was performed in 300 patients with primary OC who were treated at Ulyanovsk Regional Clinical Oncology Center. In 21 patients the stage of cancer was changed: 9 patients had the stage changed from IV to III, 12 patients-from III to IV.
With reference to obtained results, patients with updated stage III received 6 courses of multiagent chemotherapy instead of 4; patients with updated stage IV received immunotherapy.
According to the obtained results, the level of protein oxidative modification products is an accurate indicator for differential diagnostics of ovarian cancer stage III and IV.
The patent was approved for this method of differential diagnostics of ovarian cancer.
6627
References
- BakhidzeEV, Malek AV (2005) The significance of genom study method for diagnostics and treatment of ovarian cancer. Problems in oncology 51: 50-51.
- Roberta De Agelisetal (2014) Cancer survival in Europe 1999–2007 by country and age: results of EUROCARE-5—a population-based study. The Lancet Onc 15: 23-24.
- Mood AM, Graybill FA (1974) Introduction to the Theory of Statistics,(3rd Edn) McGraw-Hill 577p.
- Charles N, ZandenJr, Michal J, Anil K (2008)Early stages of ovarian cancer pathogenesis. J Clinical Oncology 2: 149-160.
- UrmancheyevaAF, Kutusheva GF (2001) Diagnostics and treatment of ovarian tumors. S Petersburg 311p.
- Wright AA, Zhang B, Keating NL, Weeks JC, Prigerson HG (2014) Associations between palliative chemotherapy and adult cancer patients' end of life care and place of death: prospective cohort study. BMJ 348:1219.
- Näppä U, Lindqvist O, Rasmussen BH, Axelsson B (2011) Palliative chemotherapy during the last month of life. Ann Oncol 22: 2375-2380.
- Adam H, Hug S, Bosshard G (2014) Chemotherapy near the end of life: a retrospective single-centre analysis of patients' charts. BMC Palliat Care 13: 26.
- Mehta DA, Hay JW (2014) Cost-effectiveness of adding bevacizumab to first line therapy for patients with advanced ovarian cancer. GynecolOncol 132: 677-683.
- Chissov VI, Davydov MI (2008) Oncology. National guidelines. Moscow, 815 p.
- Droge W (2002) Free radicals in the physiological control of cell function. Physiol Rev 82: 47-95.
- Antoneeva II, Gening TP, AbakumovaTV, Arslanova DR, Gening SO (2012) Diagnostics algorithm of progressive ovarian cancer forms. Medical almanac 23: 29-31.
- Zhang Y, Chen F (2004) Reactive oxygen species (ROS), troublemakers between nuclearfactor–B (NF-B) and c-JunNH2-terminalkinase (JNK). Cancer Res 64: 1902-1905.
- Lopez LM (2010) A new view of carcinogenesis and an alternative approach to cancer therapy. Mol Med 16: 144-153.
- Lopez LM (2007) Excessive superoxide anion generation plays a key role in carcinogenesis. Int J Cancer 120: 3075-3083.
- Martinovich GG, Golubeva EN, Cherenkevich SN (2012) Redox-biotekhnologii as a basis for new strategy in antineoplastic therapies/Messenger of national academy of Sciences of Belarus. Series of medical sciences 2: 85-103.