Keywords
Influenza; Vaccines; Microbiology; Health behavior; College health; Epidemiology
Introduction
The seasonal flu (caused by the influenza virus) afflicts millions of people every year. The most prominent sign of flu infection is a fever of 100-103°F and the most susceptible individuals to this virus include children, the elderly and immunocompromised. The estimated total number of cases of influenza is 40.4 million per year in the United States [1]. Stratified by age group, those aged 18-49 years old account for 28.9% of the total number of cases of influenza, which accounts for 11.6 million cases per year [1]. Deaths attributed to influenza range from 1.4 per 100,000 to 16.7 per 100,000, depending on age group [2].
Fortunately, one of the most effective, preventative and protective strategies against influenza infection is the seasonal flu vaccine. Amongst those aged 18-49 years in the United States, it is estimated that over 300,000 cases per year of influenza can be prevented by vaccination alone [1]. Despite the availability of a preventative influenza vaccine, vaccination rates amongst those aged 18-49 years is only 33.4% [1]. Vaccine rates amongst college students can be even lower ranging between 13% to 30%. For instance, in a 2010 study during the H1N1 flu pandemic, only 13% of surveyed students (48 of 370 students) reported receiving the annual flu vaccine [3]. In another study, over 4,000 students across 8 universities in North Carolina were surveyed and only 20% of students self-reported receiving the seasonal flu vaccine [4].
Influenza is highly contagious and is rapidly transmitted from individual-to-individual via respiratory droplets. Crowded areas, close-proximity to infected persons and other behaviors can rapidly increase the risk of infection, rates of transmission and cases of illness. The university and college campus setting, as well as dormitory housing provide prime opportunity for increased risk and rapid transmission of influenza. On-campus housing is particularly crowded with typically poor ventilation, which fosters the sharing of common air and spaces [5]. Common spaces include dormitory rooms, shared bathrooms (including sinks, showers and toilets), cafeterias, dining halls, computer facilities and even social areas. Commonly shared objects include door handles, doors, light switches, railings, keyboards and even utensils, among others. Commonly shared spaces and objects can easily and quickly become contaminated with an infectious disease agent, such as the flu virus, from a single person and then can be rapidly spread to many individuals in a very short time period [6].
Certain social behaviors amongst university and college students can also influence the risk and transmission of influenza. For instance, students are more likely to share food items, drinks and engage in more regular physical contact, such as handshakes, high-fives, hugging and kissing. Students are also often less likely to practice proper hand-hygiene on a regular basis. This may be due to a variety of reasons, but is most likely due to the fact that most student dorm rooms lack running water [7].
University and college students are also exposed to other risk factors such as stress (associated with classes, assignments and tests), emotional stress and anxiety from being away from home and peer-pressure to engage in social activities. All of these behaviors and factors increase the risk of contracting and transmitting an infectious disease agent, such as influenza. Lack of knowledge and awareness will also be a contributing factor.
The purpose of this study was to: (a) determine the influenza vaccination rate of college students; (b) quantify any changes to vaccine rates or perceptions of the influenza vaccine in response to the 2014-2015 influenza outbreak; (c) assess any changes in other protective health behaviors; and (d) elucidate reasons for or against influenza vaccine compliance amongst college students. We predicted that the overall influenza vaccine rate amongst college students decreased from 2013-2014 to 2014-2015; that most students choose not receive the vaccine because they are not worried about getting sick from contracting the flu; and that despite their vaccine status, students will engage in protective health behaviors during flu season.
Materials and Methods
Participants
Participants were recruited using multiple different avenues: the institutions online participant pool manager, SONA Systems®, was utilized as it provided immediate access to an anonymous participant pool. Participants were also recruited via anonymous institutional email listservs. These email listservs allowed us to capture the participation of multiple student groups including those living in the on-campus dormitories, living off campus, and commuting from home. As well as students in multiple different years (i.e. freshmen, sophomores, juniors or seniors) of study and majoring with each of the different colleges (i.e. College of Arts & Science, College of Business & Economics, College of Education and College of Nursing & Health Science). No individual student was excluded from participating based on race, ethnicity, age, gender, or any other characteristic, but participants were required to be at least 18 years of age and all participants were required to consent to participate in the study before proceeding to the survey.
Ethics statement and consent
This study was conducted during the Fall 2014-Winter 2015 academic year, coinciding with the 2014-2015 H3N2 influenza outbreak in the United States. Prior to the start of this study, ethics approval was obtained from the Institutional Human Subjects Review Board (HSRB) at Ashland University, Ashland, Ohio, USA, where the study was conducted. Students voluntarily participated in this survey by providing their consent using an online form.
Study design
A survey approach was utilized to query consenting students on their attitudes, perceptions, knowledge, vaccine status and other behavioral changes in response to the 2014-2015 seasonal influenza outbreak. The online survey was administered via the institutional Survey Monkey® (Survey Monkey Inc.; Palo Alto, California, USA; www.surveymonkey.com) account. The survey consisted of approximately 15 questions. The initial questions asked general, demographic information, while subsequent questions were directly related to influenza. Many of the questions utilized a likert scale of response. Some questions allowed for open-ended responses. None of the questions involved identifiable information.
Data analysis and statistics
Data was collected from Jan. 15, 2015 to Feb. 15, 2015. All data was analyzed using Microsoft Excel® 2011 (version 14.4.9). Responses to questions were analyzed via frequency and percent. Open-ended responses were categorized based on common themes among responses. Statistical analysis was conducted using SPSS (SPSS Inc.; Chicago, IL, USA; www.spss. com). Chi-square tests were performed to compute p-values and determine statistical significance (p<0.05).
Results
Study subject demographics
In total, 270 students consented to participate in the survey, but only 265 students completed the survey. The total number of females that completed the survey was 184 (69% of all respondents), while the total number of males that completed the survey was 81 (31% of all respondents). Based on previous studies, it is expected that there would be a greater number of female respondents compared to male respondents.
The number of respondents by academic year of study were as follows: 84 (32%) respondents were freshmen; 84 (32%) respondents were sophomores; 58 (22%) respondents were juniors; and 39 (15%) respondents were seniors. Participating students were also asked to indicate the college of their undergraduate major: 82 (31%) respondents were majors of the College of Arts & Science; 75 (28%) respondents were majors of the College of Business & Economics; 34 (13%) respondents were majors of the College of Education; and 74 (28%) respondents were majors of the College of Nursing & Health Science.
Vaccine rates
Of the total number of respondents that completed the survey, 80 respondents (32%; 95% confidence intervals: 26%-38%) selfreported receiving the flu vaccine in the prior academic year (2013-2014), while only 55 respondents (22%; 95% confidence intervals: 17%-27%) self-reported receiving the flu vaccine in the next academic year (2014-2015) (Table 1). Forty-six respondents (19%; 95% confidence intervals: 14%-23%) self-reported receiving the flu vaccine during both academic years. This decrease in flu vaccination rate from 2013-2014 to 2014-2015 was statistically significant (p<0.05) with a chi square value of 6.2119 and a p-value of 0.0127.
| Influenza season |
Number (& percentage) of pro-vaccine respondents |
Number (& percentage) of non-vaccine respondents |
Total |
| 2013-2014 |
80 (33%) |
185 (67%) |
265 (100%) |
| 2014-2015 |
55 (23%) |
210 (77%) |
265 (100%) |
Table 1: Total number and percentage of respondents that received the influenza vaccine in 2013-2014 and 2014-2015
Influenza vaccination rates amongst students by academic year of study, for 2013-2014 were: 28% for freshmen; 29% for sophomores; 38% for juniors; and 41% for seniors (Figure 1). The between group vaccination rate in 2013-2014 was not statistically significant (p>0.05; p-value=0.4125). These vaccination rates all decreased in 2014-2015 to 22% for freshmen; 13% for sophomores; 33% for juniors; and 27% for seniors. The between group vaccination rate in 2014-2015 was statistically significant (p<0.05; p-value=0.0505). For all groups of students based on year of study, there was a decrease in the vaccination rate from 2013-2014 to 2014-2015: 6% decrease amongst freshmen; 17% decrease amongst sophomores; 6% decrease amongst juniors and a 14% decrease amongst seniors. The most significant decrease was seen amongst the sophomore level students (p<0.05; p-value=0.0108) (Figure 1).
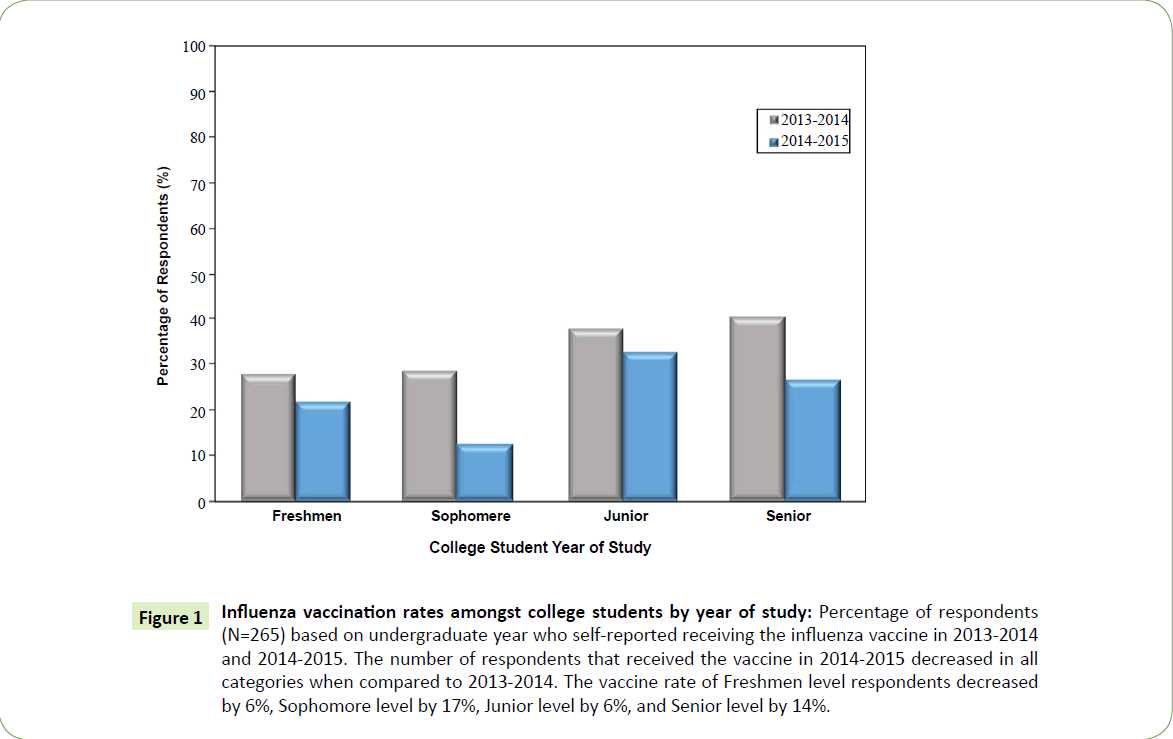
Figure 1: Influenza vaccination rates amongst college students by year of study: Percentage of respondents (N=265) based on undergraduate year who self-reported receiving the influenza vaccine in 2013-2014 and 2014-2015. The number of respondents that received the vaccine in 2014-2015 decreased in all categories when compared to 2013-2014. The vaccine rate of Freshmen level respondents decreased by 6%, Sophomore level by 17%, Junior level by 6%, and Senior level by 14%.
Vaccination rates amongst students by college of undergraduate major were 26% for students in the College of Arts & Science; 27% for students in the College of Business & Economics; 26% for students in the College of Education; and 46% for students in the College of Nursing & Health Science during 2013-2014 (Figure 2). In 2014-2015, these vaccination rates decreased to 19% for students in the College of Arts & Science; 18% for students in the College of Business & Economics; 11% for students in the College of Education; and 35% for students in the College of Nursing & Health Science. The between group vaccination rate amongst students by College was statistically significant for both 2013-2014 (p<0.05; p-value=0.0274) and 2014-2015 (p<0.05; p-value=0.0235). The decrease in vaccination rates amongst all students by College between 2013-2014 and 2014-2015 were: 7% for Arts & Science majors; 10% decrease for Business & Economics majors; 15% decrease for Education majors and a 12% decrease for Health Science majors (Figure 2) (p>0.05; p-value=0.3243). Despite the overall decrease in vaccination rates amongst all students by College major from 2013-2014 to 2014-2015, students of the College of Nursing & Health Science consistently showed the greatest vaccination rates.
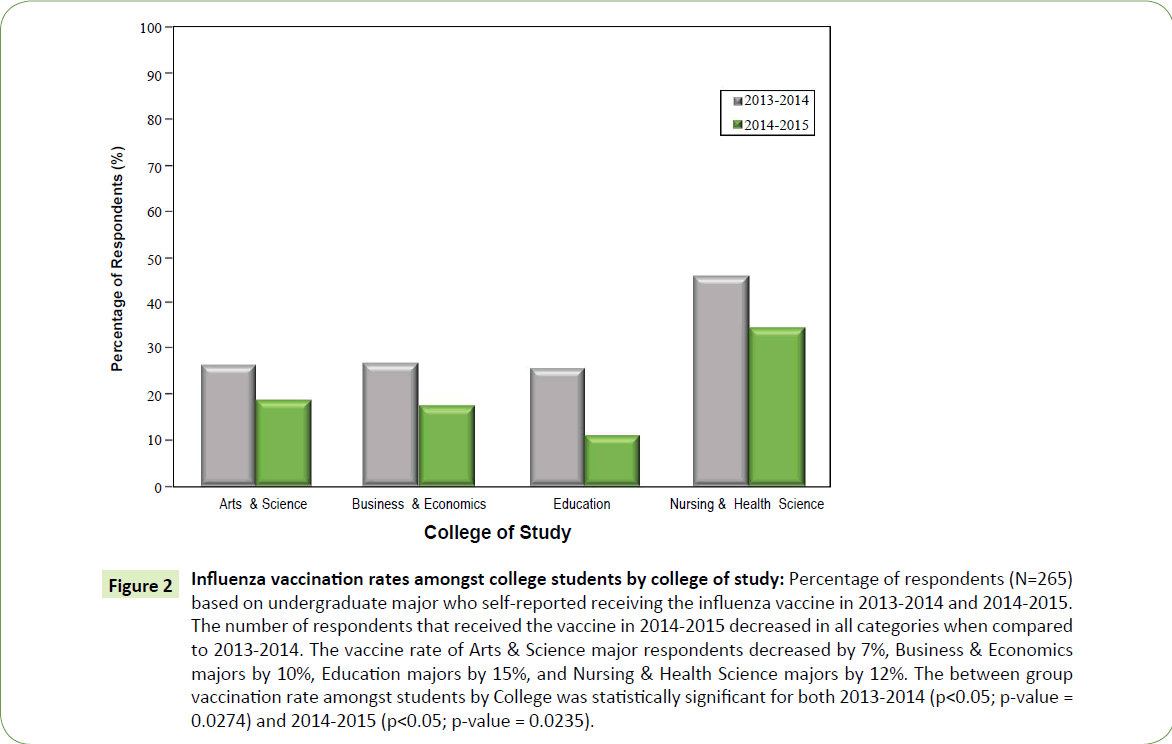
Figure 2: Influenza vaccination rates amongst college students by college of study: Percentage of respondents (N=265) based on undergraduate major who self-reported receiving the influenza vaccine in 2013-2014 and 2014-2015. The number of respondents that received the vaccine in 2014-2015 decreased in all categories when compared to 2013-2014. The vaccine rate of Arts & Science major respondents decreased by 7%, Business & Economics majors by 10%, Education majors by 15%, and Nursing & Health Science majors by 12%. The between group vaccination rate amongst students by College was statistically significant for both 2013-2014 (p<0.05; p-value = 0.0274) and 2014-2015 (p<0.05; p-value = 0.0235).
Failure to vaccinate
Amongst the respondents that self-reported not receiving the flu vaccine in 2014-2015, 174 (66%) respondents provided multiple different reasons for this failure to vaccinate. The majority of respondents, 75 (43%), in the non-vaccine group stated that they “were not worried about getting flu” as the main reason for why they did not get vaccinated (Figure 3). The next two prevailing reasons included simply “forgot or too busy” (25; 15% of nonvaccine respondents) and “not wanting to get the vaccine” (21; 12% of non-vaccine respondents). Additional, more anti-vaccine, reasons included: “the vaccine is ineffective” (12; 7% of nonvaccine respondents); “the vaccine makes you sick” (12; 7% of non-vaccine respondents); and “parental influence against vaccines” (11; 6% of non-vaccine respondents) (Figure 3). The remainder of the non-vaccine respondents cited other reasons (18; 10% of non-vaccine respondents) or did not provide a reason (36; 14% of non-vaccine respondents) for not receiving the 2014- 2015 flu vaccine.
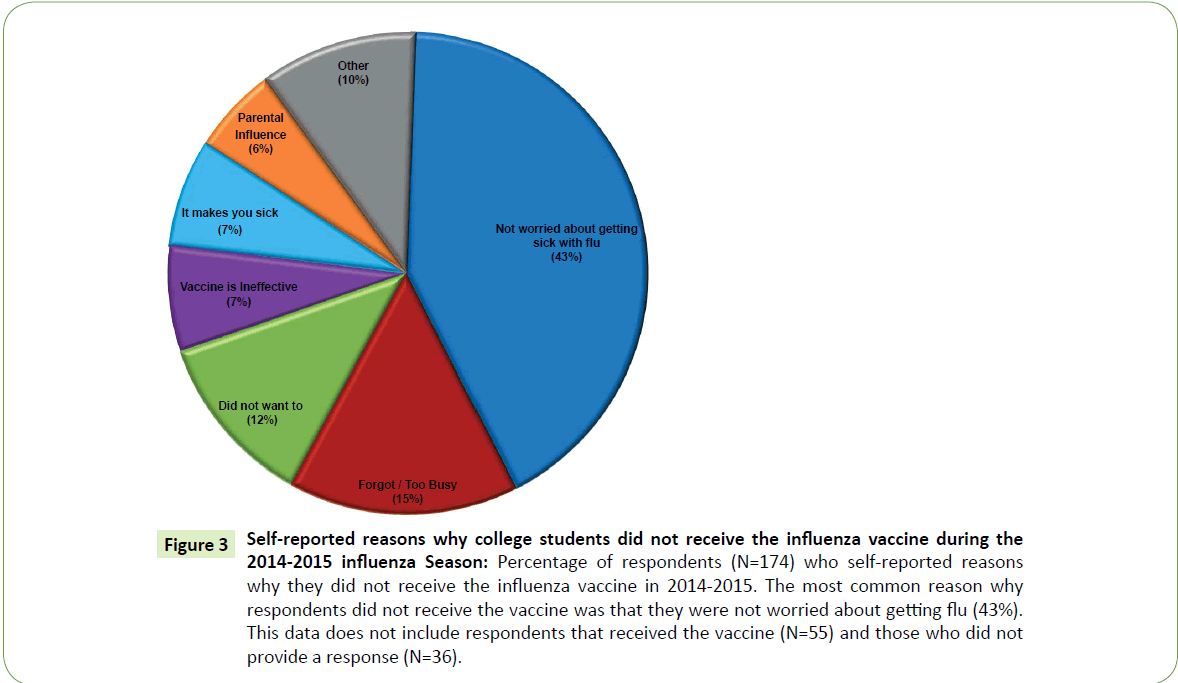
Figure 3: Self-reported reasons why college students did not receive the influenza vaccine during the 2014-2015 influenza Season: Percentage of respondents (N=174) who self-reported reasons why they did not receive the influenza vaccine in 2014-2015. The most common reason why respondents did not receive the vaccine was that they were not worried about getting flu (43%). This data does not include respondents that received the vaccine (N=55) and those who did not provide a response (N=36).
Other behavioral changes
Regardless of vaccination status, students were also asked about their changes in other protective health behaviors related to personal hygiene. A highly significant number of respondents, 133 (53%), self-reported a slight change or more in their handwashing behaviors during the 2014-2015 influenza season (p<0.05; chi squared value=118.918; p-value=0.00001) (Figure 4). Students also changed their food sharing habits during the 2014- 2015 influenza season: the number of students that reported a slight change or more in their drink-sharing habits was 84 (34%) and the number of students that reported a slight change or more in their food-sharing habits was 73 (29%). Other, less significant, behavioral changes included a slight change in handshaking by 68 (27%) students, high-fiving by 48 (19%) students, kissing by 45 (18%) students and decreased hugging by 43 (17%) of student respondents (Figure 4).
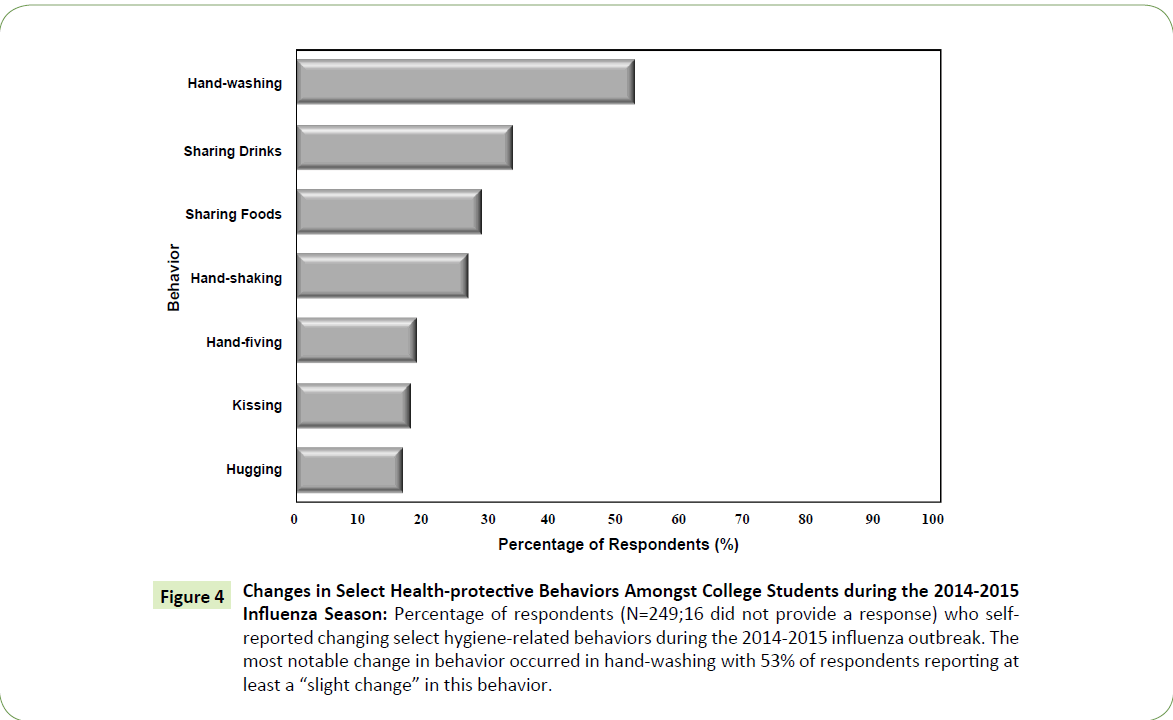
Figure 4: Changes in Select Health-protective Behaviors Amongst College Students during the 2014-2015 Influenza Season: Percentage of respondents (N=249;16 did not provide a response) who selfreported changing select hygiene-related behaviors during the 2014-2015 influenza outbreak. The most notable change in behavior occurred in hand-washing with 53% of respondents reporting at least a “slight change” in this behavior.
There was as strong positive correlation between the students that received the vaccine in 2014-2015 and changed their hand-washing behaviors. Of all respondents that received the vaccine in 2014-2015 (55), 34 (62%) of these individuals also reported a slight change or more in their personal hand-washing behaviors (95% confidence intervals: 49%-75%). Even amongst those that did not receive the influenza vaccine in 2014-2015 (193), more than half, 98 (51%; 95% confidence intervals: 44%-58%) students, reported a change in their hand-washing behaviors (p>0.05; chi squared value=2.095; p-value=0.1477) (Figure 5). Altogether, these results indicate that a total of 153 (62%; 95% confidence intervals: 56%-68%) students, over half of all respondents, engaged in some level of personal health protective behavior against influenza in 2014-2015.
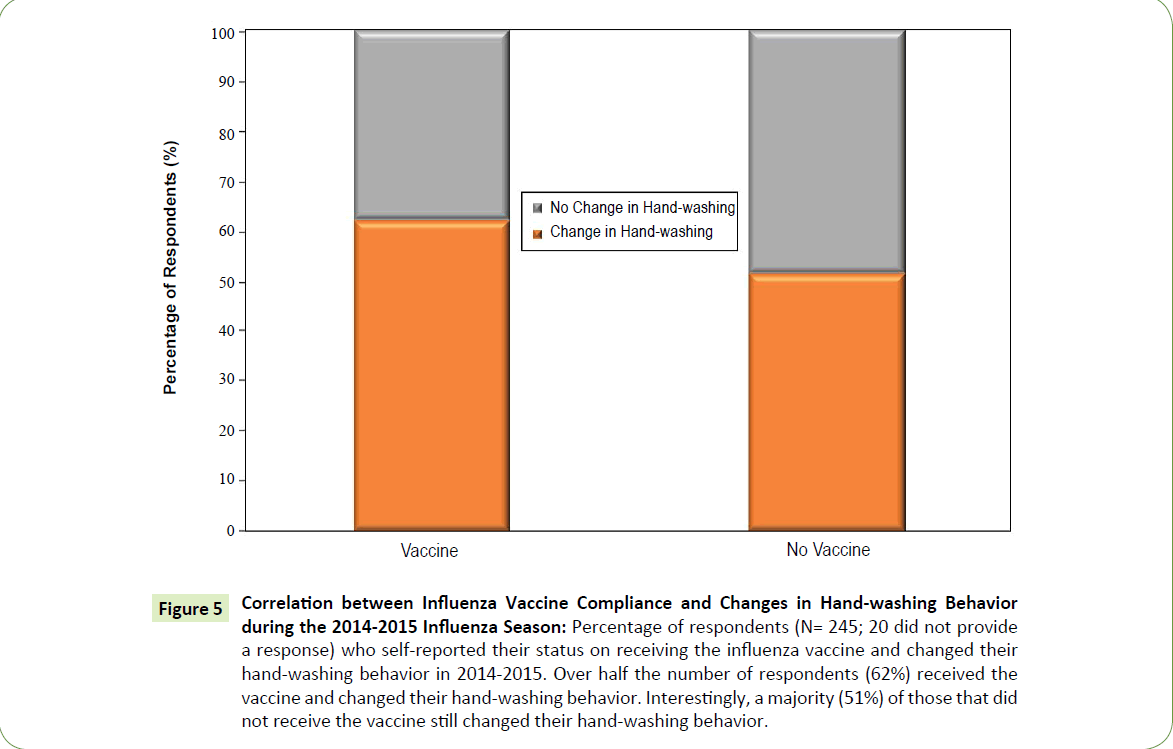
Figure 5: Correlation between Influenza Vaccine Compliance and Changes in Hand-washing Behavior during the 2014-2015 Influenza Season: Percentage of respondents (N= 245; 20 did not provide a response) who self-reported their status on receiving the influenza vaccine and changed their hand-washing behavior in 2014-2015. Over half the number of respondents (62%) received the vaccine and changed their hand-washing behavior. Interestingly, a majority (51%) of those that did not receive the vaccine still changed their hand-washing behavior.
Discussion
In this study, we determined that the overall influenza vaccination rate among college students, that consented to participate in this study, was 23% during the 2014-2015 flu season. This vaccine compliance rate was a 10% reduction from the influenza vaccine rate of 33% for these same students during the 2013-2014 flu season. This overall low flu vaccine compliance among college students is not unexpected for this age group [4]. Our study shows that almost half (43%) of the students surveyed selfreported ‘not being worried about getting sick’ from contracting the flu virus. In other words, there is the perception that flu is not a serious illness and easy to recover from, therefore college students are not concerned about contracting the disease. Other, prominent reasons for not getting vaccinated included: ‘did not want to get the vaccine’ and ‘forgot or was too busy to get the vaccine’. Concerns about the 2014-2015 influenza vaccine being ineffective were only cited by 7% of survey respondents. A previous study cited similar reasons for influenza vaccine hesitancy amongst college students [8].
The reduction in flu vaccine compliance from the 2013-2014 to the 2014-2015 flu season may be linked to the miss-match between the causative flu strain and targets of the seasonal flu vaccine. Flu is an enveloped virus with a segmented genome of 8-single strands (negative sense) of RNA, each of which encode structural and functional proteins (Figure 6). Hemagglutinin (HA) and Neuraminidase (NA) are particularly important outer surface antigens that allow this virus to interact with and infect epithelial cells of the human respiratory tract. There are approximately 16 different hemagglutinin (HA) antigen-types and 9 different neuraminidase (NA) antigen types [9]. Influenza viruses are characterized and named based on the combination of HA and NA antigen-types found on the surface of the virus [10].
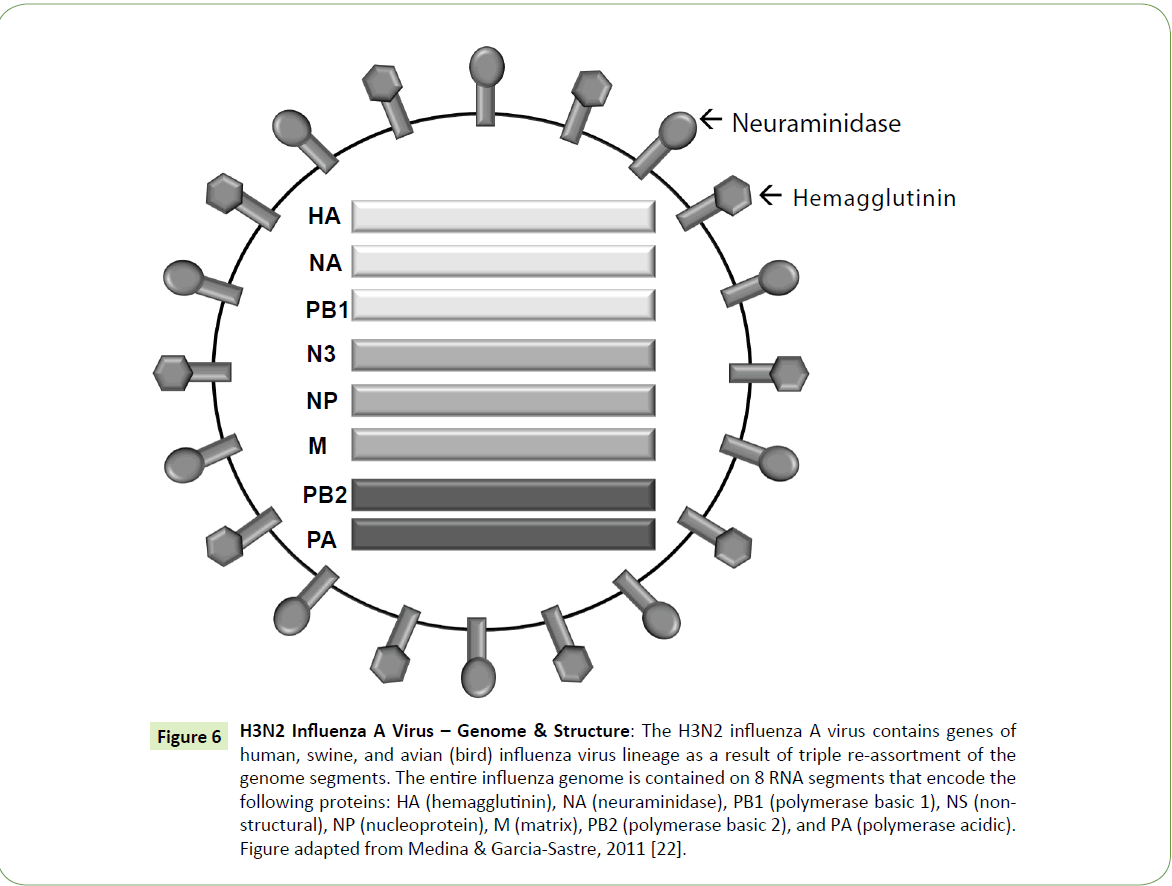
Figure 6: H3N2 Influenza A Virus – Genome & Structure: The H3N2 influenza A virus contains genes of human, swine, and avian (bird) influenza virus lineage as a result of triple re-assortment of the genome segments. The entire influenza genome is contained on 8 RNA segments that encode the following proteins: HA (hemagglutinin), NA (neuraminidase), PB1 (polymerase basic 1), NS (nonstructural), NP (nucleoprotein), M (matrix), PB2 (polymerase basic 2), and PA (polymerase acidic). Figure adapted from Medina & Garcia-Sastre, 2011 [22].
Seasonal variations in the flu strain are attributed to genetic changes in these surface antigens. Minor point mutations of the genetic regions encoding for either the HA or NA antigens commonly results in the seasonal variability of the causative strain of influenza. This concept is known as antigenic drift [10]. Major changes in the HA or NA antigen types are attributed to re-assortment of the 8-single strands of RNA between human, bird and swine flu strains (Figure 6). These changes can more dramatically alter the influenza virus responsible for causing the flu from season to season [10]. This concept is known as antigenic shift; it is far more severe than antigenic drift and has accounted for major flu pandemics in the past [11,12].
To account for these genetic changes, the annual flu vaccine is typically designed to immunize against three flu viruses. In 2014-2015, the flu vaccine was designed to be protective against an H1N1-like virus (A/California/7/2009), an H3N2- like virus (A/Texas/50/2012) and a type B-like virus (a B/ Massachusetts/2/2012-like virus) [13]. While the prominent flu strain in 2014-2015 was H3N2, it underwent an in-season antigenic drift resulting in a miss-match between the seasonal causative flu strain and the seasonal flu vaccine resulting in reduced strain-specific protection [13-16]. The consequences of this miss-match included an increased number of seasonal flu cases, regional outbreaks and individual decisions to decline vaccination.
While vaccination is paramount to preventing cases of flu, other health protective behaviors and personal hygiene measures can also help protect against the transmission of flu. In our study, we determined that regardless of seasonal flu vaccine status, nearly half of the respondents self-reported increasing their hand-washing behaviors. Of those that were vaccinated, more than half increased their hand-washing behaviors. Altogether, our results indicate that college students are aware of and more likely to engage in protective health behaviors (such as increased hand-washing) against the seasonal flu virus compared to opting to receiving the annual flu vaccine [17].
College students are a distinct population to study. College students are typically considered a young healthy age-group with reduced susceptibility and risk of certain diseases and illnesses. This factor was relevant in the reasons that respondents cited for not getting vaccinated. The prevailing reason for not getting vaccinated was that they can overcome the illness. However, college students need to be educated on the concept of herd immunity. Herd immunity is the concept that the vaccination of an individual not only protects the individual, but also those around them, i.e. the surrounding community [18]. Beyond being on the college campus, students may routinely go home and visit friends and family. While a mildly ill 20-something college student could easily recover from their illness, they could just as easily pass on the infectious disease agent onto other more fragile family members, such as younger siblings, nieces or nephews or older grand-parents. The transmitted illness could be devastating for these individuals.
Subsequent studies should address student knowledge of the concept of ‘herd-immunity’; student knowledge of the risks of transmitting an infectious disease agent to an individual from a vulnerable population group; as well as student knowledge of reasons for an annual influenza vaccine. The effects of pro or anti-vaccination messages on college students’ decision to receive the annual flu vaccine or not should also be studied [19]. The impact of access to on-campus vaccine clinics in terms of central- or multiple- campus locations and ample hours of operation could also be investigated as additional factors that influence college students’ decision to receive the annual flu vaccine or not [20,21].
Our study was a descriptive observational cross-sectional epidemiological study in which we were determining the influenza vaccine status of college students. This study relied upon an online survey and self-reported data. There are multiple limitations and strengths to this particular study. The limitation of this study design includes the fact that all data that were collected were self-reported. As a result, all data are subject to recall bias. This study aimed to compare the influenza vaccine rates of college students during the 2014-2015 influenza outbreak, while asking students to remember and report whether or not they received the vaccine in the prior year. As well, since college students were being asked to complete this survey during the academic year, they might also have been subject to reporting bias. Regardless of the anonymity of the survey, students might have perceived certain responses to be the desired responses. If such was the case, one might have expected greater vaccine compliance rates or greater changes in health-protective behaviors. As a result, the true rates might be lower than reported.
Despite these limitations, this study design was beneficial as it provided a quick snap-shot of the vaccine compliance rates of college students in real-time, that is during an influenza outbreak. In general, these types of studies are beneficial for determining the health, or in this case the vaccination status, of a specific population at a specific point in time. Such information is useful for determining the need for health services and planning interventions. For instance, could educational campaigns, pamphlets, clinics or other services increase the likelihood of vaccine compliance amongst college students. This study also provided some insight into the reasons why college students decide to receive or not receive the seasonal influenza vaccine. Finally, this study demonstrated that college students do engage in health protective behaviors to reduce the transmission of infectious disease agents.
Acknowledgements
We acknowledge the institutional human subjects research board, at Ashland University, Ashland, Ohio, USA, for reviewing this study.
Compliance with Ethical Standards
Conflict of interest
All authors declare that there is no conflict of interest.
Funding
There is no source of funding this study.
Ethical approval
Study was performed in accordance with the ethical standards of the institutional human subjects review board at Ashland University, Ashland, Ohio, USA.
19097
References
- https://www.cdc.gov/MMWR/preview/mmwrhtml/mm5933a1.htm?s_cid=mm5933a1_w
- Yang ZJ (2012) Too Scared or Too Capable? Why Do College Students Stay Away from the H1N1 Vaccine? Risk Anal 32: 1703-1716.
- Poehling KA, Blocker J, IpEH, Peters TR, Wolfson M (2009) 2009-2010 Seasonal Influenza Vaccination Coverage Among College Students From 8 Universities in North Carolina. J Am Coll Health 60: 541-547.
- Wilson SL, Huttlinger K (2010) Pandemic flu knowledge among dormitory housed university students: a need for informal social support and social networking strategies. Rural Remote Health 10: 1526.
- Decker J, Slawson R (2012) Evaluation of Behavioral Health Compliance and Microbial Risk Factors on Student Populations Within a High-Density Campus. J Am Coll Health60: 584-594.
- Tsuang WM, Bailar JC, Englund JA (2004) Influenza-like symptoms in the college dormitory environment: a survey taken during the 1999-2000 influenza season. J Environ Health 66: 39-42.
- Ramsey MA, Marczinski CA (2011) College students' perceptions of H1N1 flu risk and attitudes toward vaccination. Vaccine 29: 7599-7601.
- Gamblin SJ, Skehel JJ (2010) Influenza Hemagglutinin and Neuraminidase Membrane Glycoproteins. J BiolChem285: 28403-28409.
- Bouvier NM, Palese P (2008)The biology of influenza viruses. Vaccine26: D49-D53.
- Nelson MI, Holmes EC (2007) The Evolution of Epidemic Influenza. Nature Reviews Genetics 8: 196-205
- Taubenberger JK, Kash JC (2010) Influenza virus evolution, host adaptation, and pandemic formation. Cell Host Microbe7: 440-451.
- Houser K, Subbarao K (2015) Influenza vaccines: challenges and solutions. Cell Host Microbe17: 295-300.
- Van D, McLaws M-L, Crimmins J, MacIntyre CR, Seale H. (2010) University life and pandemic influenza: attitudes and intended behaviour of staff and students towards pandemic (H1N1) 2009. BMC Public Health 10: 130-138.
- Fine P, Eames K, Heymann DL (2011) Herd immunity: a rough guide. Clin Infect Dis 52: 911-916.
- Nyhan B, Reifler J, Richey S, Freed GL (2014) Effective Messages in Vaccine Promotion: A Randomized Trial. Pediatr133: e835-e842.
- Medina RA, Sastre AG (2011) Influenza A viruses: new research developments. Nature Reviews 9: 590-603
- Merrill RM, Kelley TA, Cox E, Layman AB, Layton BJ, et al. (2010) Factors and barriers influencing influenza vaccination among students at Brigham Young University. Medical Science Monitor 16: PH29–PH34.
- Teitler-Regev S, Shahrabani S, Benzion U (2011) Factors Affecting Intention among Students to Be Vaccinated against A/H1N1 Influenza: A Health Belief Model Approach. Advances in Preventative Medicine 2011: 353207.'