Keywords
Inflammation; FMTVDM©? Heart disease; Weight loss; Diets;Laboratory finding; Management
Introduction
A Centers for Disease Control (CDC) report showed obesity (Body Mass Index>30) and overweight (251]. Lowered fat and vegetarian diets have long been used for weight loss. Lowered carbohydrate diets finally received general acceptance in 2003 when two widely and popularly publicized studies [2,3] reported low-carbohydrate diets to be effective. By the end of the year, 19% of US adults reported they were on “LoCarb” diets [4]. Media pundits suggest this is a fad, which would soon pass. Indeed, weight loss dieting is notorious for lack of persistence and adherence. Standard dictionary definitions of “diet” provide two meanings: 1) usual, regular, or habitual food and drink of a person or animal and 2) regulated or prescribed selection of foods of a person or animal for medical or cosmetic purposes. The usual cause of obesity is diet in the first sense and the usual treatment of obesity is diet in the second sense. In other words, obesity stems from foods selected by the person and treatment stems from foods selected by someone else. The obesity arises from a sequence beginning with personal habitual food selection, then food ingestion, metabolic processes and finally fat deposition.
Traditional treatment is indeed an intervention bypassing the personal habitual food selection to intervene with prescribed food to be ingested with metabolic consequences aimed at fat reduction. It seems to be assumed that prescribing will replace personal selection, not only in the short run but also in the long term. The well known difficulties people have in adhering to diets, the enormous drop out rate in diet studies, the very modest gains from prescribed diets all bespeak the weight of well-established personal habitual selection factors vis a vis externally prescribed selection. The root cause of obesity is the distal one of personal habitual diet. The food consumed follows and is only the proximal cause. Food habits are behaviours and behaviour modification could serve as treatment of the root causes obesity. Behavioural principles, from a century of research, cover the formation and reformation of habits [5]. Non-directive counseling methods have had over a half-century of development [6]. More than a quarter of a century of research has confirmed the efficacy of counseling for internal rather than external locus of control [7]. The present study examines the effects of non-directive counseling treatment, following well -established behavioural principles to establish selfmanagement, and focused on modifying the person’s habitual diet rather than on the effects of prescribed diets.
Methods
Subject recruitment and monitoring
Participants were 120 volunteers referred by their primary care physicians as being: obese (Body Mass Index (BMI)>30), age 30-59, nonpregnant, no prior documented heart disease, no medications including over the counter vitamins and supplements, no particular food allergies (e.g., gluten, dairy, peanuts, et cetera), not enrolled in other studies, and free of diabetes, liver, renal, gastrointestinal disease or cancer. Medical history and allergies were confirmed from medical records. Human subject guidelines were followed with informed consent following IRB approval.
For a balanced experimental design, participants were randomly assigned by casting a die [32], to equal diet plan groups: vegan (Veg), low-to-moderate-fat (LMF), and lowered-carbohydrate (LoCarb). The initial design (Figure 1) included subdivision into vitamin supplementation groups but is not further reported here because there was no effect on long-term outcomes resulting from vitamin supplementation.
Counseling
Participants received supportive nondirective nutritional counseling from the first author/principal investigator for 20 to 30 minutes at 6-week intervals following an initial informational/instructional entry session of 50 to 60 minutes. Counseling relevant principal investigator training included an undergraduate degree and Masters studies in psychology and a formal professional interviewing/learning-to-listen course based on videotaped interviews of patients and pseudo patients with post-interview critiques.
Dietary recommendations
As previously reported [16], these dietary-counseling sessions included assessment of total caloric intake with encouragement to maintain an average daily consumption of 1500 to 1600 kcal/ day, along with information on sources of protein, carbohydrate and fat [14-17] intake consistent with each of the three regimens [16].
Vegan dieters were asked to abstain from eating meat, defined as anything moving under its own power while alive (e.g. beef, poultry, pork, fish, et cetera). Dairy products and eggs were also eliminated from the diets of this group. Recommended sources of protein included legumes, beans, nuts and soy products. Fats were limited to those found in vegetable sources and oils used in the preparation of foods as well as flaxseed.
Low-to-moderate fat (LMF) diets included adjustment of fat intake to no more than 15%-20% of the total caloric intake. No specific foods were eliminated on this diet as long as the total fat intake did not exceed this amount with no more than 5 grams of saturated fat consumed per day. During a typical day this would result in 20-25 grams of non-saturated fat and up to 5 grams of saturated fat. Meats (defined as anything which moves under its own power when alive) were incorporated into this regimen with limitations based upon the saturated fat content. Hence, preparation of meat products focused on removing as much saturated fat from the products as possible. Dairy products were limited on the basis of fat content, with emphasis on skim milk and skim or soymilk products.
LoCarb diets were higher fat diets with consumption of carbohydrate not exceeding 25% of the recommended daily caloric intake of approximately 100 grams per day. The remainder of the caloric intake was divided between protein (25%) and fat (50%) consumption. There were no restrictions on the amount of saturated fat versus non-saturated fat consumed. Selection depended upon personal preference.
Exercise regimen
Participants were asked to follow one of three exercises (walking, bicycling or swimming) three times per week for thirty minutes per session. This could be indoors or outdoors depending upon weather conditions and individual preference. Exercise was for time, not speed or distance. Stationary treadmills or bicycles could be used in the place of non-stationary sources of exercise depending upon personal preference. Adherence to exercising was self-reported.
Testing sequence
Anthropometric, exercise, fasting blood work, respiratory quotient, and inflammothrombotic variables were determined for each visit (Figure 1). Assessment of coronary blood flow was conducted at the beginning of the study and at 52 weeks.
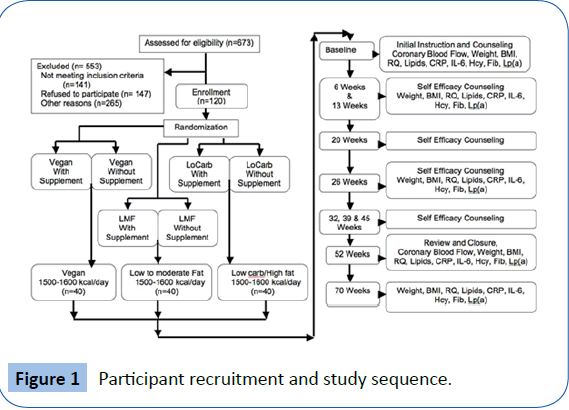
Figure 1: Participant recruitment and study sequence.
Anthropometric Information. Heights were taken upon entry into the study and weights throughout. Calculated BMI’s were used as the weight index throughout the study.
Fasting venous blood work. At each evaluation, blood samples were obtained and sent to a commercial laboratory service for assay. Fasting blood work [16] was obtained for depository variables (those which are associated with deposition of material within coronary arteries) including total cholesterol (TC), lowdensity lipoprotein cholesterol (LDL), high-density lipoprotein cholesterol (HDL), very low-density lipoprotein cholesterol (VLDL), and triglycerides (TG). From this, insulin resistance (TG/ HDL) was estimated [26]. The methodology for determination of these variables has been described [11,12] previously in great detail.
During the evaluations fasting venous blood was also obtained for C-reactive protein (CRP), interleukin-6 (IL-6), homocysteine (Hcy), fibrinogen (Fib), and lipoprotein (a) [Lp (a)]. The methodology for determining these variables has been described [15-17] elsewhere with the exception of IL-6. Interleukin-6 was determined from fasting blood samples, which were immediately spun, separated and then frozen for enzyme-linked immunosorbent (ELISA) assay.
Coronary blood flow
Myocardial perfusion imaging was completed at entry into the study and one year after following the recommended dietary and supplement protocol. Perfusion imaging was performed [15,17,33] as previously established and described and defined by patented AI True Quantification method.
Statistical analysis
The experimental design anticipated use of a general linear model. Venables, et al. [8], describe Studentized-residuals, Durbin-Watson, Cook’s distance, and other graphic examinations applicable to justifying the selection of a linear model. They also provide a detailed exposition on the software used. Software was R-1.8.0. Coefficients of the linear models lead to confidence intervals for the mean changes for each index on each diet and for the differences between diets. Statistical effect sizes among and between the different diets on cardiovascular disease risk factors were also analyzed using both the coefficient of determination (R2) and the ratio of effect variance to total variance, that is, the multiple correlation (R). Quantile statistics lead to notched box plots showing quartile distributions, outliers, and confidence intervals of medians as alternative statistics not affected by outliers.
Results
The initial characteristics of the 120 men and women enrolled in this study are shown in Table 1 and are representative of the general population who are overweight, which now represents two-thirds of the populations of most affluent societies.
| Variable |
All Participants |
| Females |
57 |
| Males |
63 |
| Age (years) |
43.7 [8.40] |
| Height (inches) |
67.9 [3.13] |
| Weight (lbs) |
272 [54.7] |
| Weight (kg) |
124 [25.0] |
| Body Mass Index/BMI (kg/m2) |
42.4 [7.55] |
| Ischemic Index28 |
0.082 [0.054] |
| Respiratory Quotient (RQ) |
0.893 [0.023] |
| Total Cholesterol/TC (mg/dl) |
266 [28.2] |
| Low Density Lipoprotein/LDL (mg/dl) |
185 [27.6] |
| High Density Lipoprotein/HDL (mg/dl) |
42.2 [6.01] |
| TC/HDL |
6.43 [1.14] |
| Very Low Density Lipoprotein/VLDL (mg/dl) |
39.0 [6.99] |
| Triglycerides/TG (mg/dl) |
195 [34.9] |
| Insulin Resistance (TG/HDL) |
4.71 [1.11] |
| C-reactive Protein/CRP (mg/dl) |
1.07 [1.89] |
| Interleukin-6/IL (pg/ml) |
5.89 [3.68] |
| Homocysteine/Hcy (mmol/L) |
15.0 [8.31] |
| Fibrinogen/Fibrin (mg/dl) |
327 [64.7] |
| Lipoprotein(a)/Lp (mg/dl) |
23.7 [11.6] |
Table 1: Initial population characteristics (Mean [SD]).
Participant retention was 100%, no participants withdrew. With all three diets, participants maintained their weight loss over the four-month period following cessation of the dieting programs and did not show the commonly reported regaining of weight.
The Institute of Medicine recommends all health research include an examination of sex effects in all phenomena under study.
Using a general linear model to examine all data of this research for sex effects and interactions, no effects or trends were found.
The 58 female and 62 male participants were randomly assigned to equal dietary groups by casting a die [32]. There were no statistical demographic differences between group assignments (Table 2). There were no statistically significant differences, or even trends, between diet groups at the initiation of the study. Since the groups were unequivocally randomized for all fifteenbaseline indices, statistical inference to the initial population, described by Table 1, is appropriate.
| Variables |
Men |
Women |
Age* |
| Vegetarian without supplement |
12 |
8 |
42.55 [9.27] |
| Vegetarian with supplement |
9 |
11 |
43.55 [9.27] |
| Low to moderate fat without supplement |
10 |
10 |
44.05 [9.82] |
| Low to moderate fat with supplement |
9 |
11 |
43.20 [9.12] |
| Low carbohydrate without supplement |
12 |
8 |
45.10 [6.82] |
| Low carbohydrate with supplement |
10 |
10 |
43.10 [6.84] |
Table 2: Demographics per group assignment (Mean [SD]).
The baseline and follow-up results for each measured indices for each group are shown in Tables 3a to 3f, including a breakdown by diet and vitamin supplementation. There were no statistical differences for any dietary regimen based upon the inclusion or exclusion of vitamin supplementation. Subsequently the two groups (with and without vitamin supplementation) for each diet regimen (Vegan, LMF and LoCarb) were combined for further analysis [34,35].
| Variables |
Baseline |
6 weeks |
3 months |
6 months |
1 year |
4 months after |
| II |
0.087 [0.049] |
NA |
NA |
NA |
0.069 [0.047] |
NA |
| RQ |
0.88 [0.02] |
0.90 [0.02] |
0.92 [0.02] |
0.92 [0.03] |
0.95 [0.02] |
0.95 [0.03] |
| Pounds |
268.0 [63.7] |
261.0 [62.9] |
256.4 [62.4] |
248.1 [61.8] |
237.8 [60.4] |
237.4 [59.3] |
| Kg |
121.6 [29.1] |
118.6 [28.5] |
116.6 [28.4] |
112.6 [28.1] |
108.1 [27.5] |
107.9 [26.9] |
| BMI |
42.0 [8.3] |
40.9 [8.1] |
40.3 [8.1] |
38.9 [8.0] |
37.2 [7.6] |
37.2 [7.6] |
| TC |
254.8 [23.1] |
242.0 [21.9] |
240.0 [21.6] |
231.9 [20.4] |
206.2 [20.1] |
201.2 [32.9] |
| LDL |
172.7 [24.1] |
161.7 [20.2] |
161.7 [20.2] |
154.5 [19.4] |
132.9 [16.6] |
127.4 [31.1] |
| HDL |
43.0 [5.9] |
44.4 [7.6] |
44.4 [7.6] |
46.2 [6.6] |
48.3 [5.4] |
49.2 [4.9] |
| TC/HDL |
6.0 [1.1] |
5.6 [0.9] |
5.5 [0.9] |
5.1 [0.8] |
4.3 [0.5] |
4.1 [0.8] |
| VLDL |
39.1 [6.1] |
35.9 [4.6] |
33.8 [3.9] |
31.1 [3.7] |
25.1 [3.0] |
24.5 [3.6] |
| TG |
195.6 [30.7] |
179.6 [23.1] |
169.1 [19.3] |
155.4 [18.3] |
125.5 [15.2] |
122.3 [18.0] |
| TG/HDL |
4.6 [1.0] |
4.1 [0.8] |
3.9 [0.7] |
3.4 [0.6] |
2.6 [0.4] |
2.5 [0.5] |
| CRP |
0.81 [1.46] |
0.77 [1.33] |
0.61 [1.6] |
0.48 [0.60] |
0.28 [0.14] |
0.26 [0.17] |
| IL-6 |
5.28 [3.84] |
5.11 [3.45] |
4.22 [2.24] |
3.51 [1.99] |
2.63 [1.32] |
2.11 [1.25] |
| Hcy |
15.5 [9.4] |
16.2 [8.3] |
15.7 [6.9] |
14.4 [6.9] |
11.3 [4.1] |
15.5 [19.9] |
| Fib |
331.5 [66.4] |
322.9 [42.6] |
322.3 [33.6] |
321.9 [22.3] |
321.4 [20.3] |
324.1 [18.1] |
| Lp (a) |
26.6 [13.2] |
25.3 [11.9] |
24.0 [11.5] |
21.7 [10.4] |
20.4 [9.7] |
21.4 [9.4] |
Table 3a: 1500-1600 kcal/day vegetarian diet without vitamin supplement (Mean [SD]).
| Variables |
Baseline |
6 weeks |
3 months |
6 months |
1 year |
4 months after |
| II |
0.080 [0.040] |
NA |
NA |
NA |
0.071 [0.033] |
NA |
| RQ |
0.89 [0.03] |
0.92 [0.02] |
0.94 [0.02] |
0.94 [0.03] |
0.97 [0.02] |
0.92 [0.03] |
| Pounds |
277.2 [53.4] |
270.4 [53.2] |
260.3 [53.7] |
251.1 [54.5] |
243.5 [53.5] |
244.9 [53.0] |
| Kg |
125.6 [24.1] |
123.1 [24.1] |
118.3 [24.4] |
114.2 [24.7] |
110.7 [24.3] |
111.4 [24.0] |
| BMI |
42.5 [7.7] |
41.3 [7.6] |
39.9 [8.2] |
38.6 [8.2] |
37.4 [8.0] |
37.5 [8.2] |
| TC |
264.1 [29.0] |
249.1 [30.5] |
228.9 [26.3] |
224.0 [23.9] |
192.5 [20.7] |
189.8 [18.0] |
| LDL |
181.7 [27.5] |
168.6 [28.0] |
149.9 [23.7] |
147.4 [21.8] |
119.0 [20.0] |
118.6 [17.6] |
| HDL |
43.4 [4.9] |
44.3 [4.0] |
46.4 [4.2] |
47.0 [4.3] |
48.1 [4.3] |
47.0 [4.2] |
| TC/HDL |
6.2 [1.0] |
5.7 [0.8] |
5.0 [0.6] |
4.8 [0.6] |
4.0 [0.6] |
4.1 [0.5] |
| VLDL |
39.0 [6.3] |
36.2 [5.9] |
32.4 [5.2] |
29.5 [5.2] |
25.4 [5.2] |
24.2 [4.6] |
| TG |
195.1 [31.3] |
181.2 [29.6] |
162.1 [25.9] |
147.4 [26.0] |
127.0 [26.1] |
121.2 [23.0] |
| TG/HDL |
4.5 [0.8] |
4.1 [0.7] |
3.5 [0.6] |
3.2 [0.6] |
2.7 [0.6] |
2.6 [0.5] |
| CRP |
2.34 [3.55] |
1.49 [2.19] |
0.76 [1.24] |
0.45 [0.44] |
0.28 [0.22] |
0.40 [0.13] |
| IL-6 |
5.83 [2.98] |
5.11 [2.91] |
4.54 [2.28] |
4.15 [1.76] |
3.55 [1.69] |
3.34 [1.31] |
| Hcy |
13.9 [6.4] |
12.0 [5.9] |
10.5 [5.2] |
10.0 [4.1] |
9.1 [3.1] |
9.0 [3.1] |
| Fib |
327.4 [72.1] |
327.1 [45.4] |
327.4 [28.3] |
325.8 [22.1] |
329.1 [18.2] |
329.2 [14.9] |
| Lp (a) |
23.4 [12.0] |
22.7 [11.3] |
21.4 [10.8] |
20.2 [8.9] |
19.0 [8.5] |
18.1 [8.4] |
Table 3b: 1500-1600 kcal/day vegetarian diet with vitamin supplement (Mean [SD]).
| Variables |
Baseline |
6 weeks |
3 months |
6 months |
1 year |
4 months after |
| II |
0.083 [0.055] |
NA |
NA |
NA |
0.068 [0.041] |
NA |
| RQ |
0.90 [0.02] |
0.93 [0.01] |
0.93 [0.01] |
0.92 [0.01] |
0.92 [0.01] |
0.92 [0.01] |
| Pounds |
276.5 [53.2] |
268.9 [53.2] |
263.2 [53.2] |
254.8 [53.0] |
246.7 [53.3] |
243.9 [53.3] |
| Kg |
125.7 [24.2] |
122.4 [24.2] |
119.6 [24.2] |
115.8 [24.1] |
112.2 [24.2] |
110.9 [24.3] |
| BMI |
43.1 [7.5] |
42.0 [7.2] |
41.1 [7.4] |
39.7 [7.3] |
38.6 [7.5] |
38.1 [7.5] |
| TC |
266.2 [23.3] |
239.5 [22.4] |
216.7 [20.0] |
196.2 [21.3] |
181.5 [16.7] |
170.9 [28.6] |
| LDL |
183.4 [21.3] |
158.9 [20.5] |
136.5 [17.4] |
120.9 [18.9] |
108.2 [14.1] |
98.9 [25.0] |
| HDL |
43.4 [4.9] |
45.4 [5.3] |
47.3 [5.6] |
47.0 [3.7] |
48.3 [3.4] |
49.0 [4.1] |
| TC/HDL |
6.2 [0.8] |
5.3 [0.6] |
4.6 [0.6] |
4.2 [0.5] |
3.8 [0.3] |
3.5 [0.5] |
| VLDL |
39.5 [8.1] |
35.3 [5.2] |
32.8 [4.5] |
28.2 [4.1] |
24.9 [4.8] |
23.0 [4.5] |
| TG |
197.4 [40.4] |
176.3 [26.2] |
163.8 [22.5] |
141.0 [20.6] |
124.6 [24.2] |
115.1 [22.4] |
| TG/HDL |
4.6 [1.3] |
3.9 [0.8] |
3.5 [0.7] |
3.0 [0.4] |
2.6 [0.5] |
2.4 [0.5] |
| CRP |
0.71 [1.02] |
0.44 [0.49] |
0.24 [0.14] |
0.16 [0.11] |
0.09 [0.09] |
0.19 [0.09] |
| IL-6 |
6.14 [4.44] |
5.77 [3.94] |
5.21 [3.42] |
4.86 [3.12] |
3.99 [2.16] |
3.85 [2.03] |
| Hcy |
16.0 [8.7] |
14.0 [6.9] |
12.9 [6.5] |
10.9 [5.1] |
9.2 [3.5] |
9.2 [3.3] |
| Fib |
326.7 [61.4] |
331.8 [51.6] |
338.7 [42.2] |
341.8 [22.8] |
333.9 [20.8] |
341.4 [16.0] |
| Lp (a) |
22.8 [10.1] |
21.6 [9.6] |
19.4 [8.7] |
17.0 [7.1] |
15.0 [6.6] |
13.8 [5.8] |
Table 3c: 1500-1600 kcal/day low to moderate fat diet without vitamin supplement (Mean [SD]).
| Variables |
Baseline |
6 weeks |
3 months |
6 months |
1 year |
4 months after |
| II |
0.094 [0.058] |
NA |
NA |
NA |
0.053 [0.036] |
NA |
| RQ |
0.89 [0.02] |
0.93 [0.02] |
0.92 [0.01] |
0.93 [0.02] |
0.93 [0.01] |
0.93 [0.01] |
| Pounds |
267.1 [55.9] |
259.8 [54.3] |
253.1 [54.4] |
245.8 [54.8] |
243.1 [53.2] |
240.7 [53.1] |
| Kg |
121.3 [25.3] |
118.1 [24.6] |
115.0 [24.8] |
111.7 [25.0] |
110.6 [24.2] |
109.5 [24.0] |
| BMI |
42.1 [7.8] |
40.9 [7.5] |
40.0 [7.4] |
38.8 [7.7] |
38.5 [8.1] |
38.0 [8.1] |
| TC |
261.9 [35.0] |
247.9 [36.1] |
234.3 [30.1] |
214.4 [30.9] |
191.9 [32.9] |
182.8 [29.6] |
| LDL |
186.2 [37.1] |
174.2 [36.4] |
163.1 [31.2] |
143.4 [30.4] |
121.8 [33.6] |
111.8 [31.1] |
| HDL |
39.4 [6.3] |
40.8 [5.6] |
41.4 [5.2] |
44.4 [5.8] |
46.5 [4.8] |
47.8 [3.9] |
| TC/HDL |
6.9 [1.7] |
6.2 [1.4] |
5.8 [1.1] |
4.9 [1.0] |
4.2 [0.8] |
3.9 [0.8] |
| VLDL |
36.3 [5.2] |
32.9 [5.4] |
29.7 [4.7] |
26.6 [4.1] |
23.6 [3.3] |
23.2 [2.9] |
| TG |
181.4 [26.1] |
164.3 [26.8] |
148.6 [23.7] |
133.1 [20.3] |
118.1 [16.5] |
116.0 [14.3] |
| TG/HDL |
4.7 [1.1] |
4.1 [1.0] |
3.7 [0.8] |
3.1 [0.7] |
2.6 [0.5] |
2.4 [0.4] |
| CRP |
0.54 [0.54] |
0.30 [0.23] |
0.18 [0.09] |
0.17 [0.07] |
0.13 [0.08] |
0.16 [0.09] |
| IL-6 |
6.02 [3.58] |
5.33 [2.85] |
4.40 [2.47] |
3.78 [2.10] |
3.33 [2.04] |
3.54 [1.98] |
| Hcy |
13.4 [6.5] |
12.2 [5.4] |
9.8 [3.1] |
8.5 [2.6] |
7.5 [1.7] |
7.9 [1.9] |
| Fib |
332.6 [63.5] |
328.8 [55.4] |
322.9 [41.7] |
319.8 [33.6] |
310.4 [26.7] |
319.8 [17.8] |
| Lp (a) |
24.9 [11.8] |
22.5 [10.8] |
19.8 [9.0] |
16.5 [7.2] |
14.7 [6.3] |
14.0 [6.1] |
Table 3d: 1500-1600 kcal/day low to moderate fat diet with vitamin supplement (Mean [SD]).
| Variables |
Baseline |
6 weeks |
3 months |
6 months |
1 year |
4 months after |
| II |
0.081 [0.059] |
NA |
NA |
NA |
0.119 [0.079] |
NA |
| RQ |
0.90 [0.02] |
0.88 [0.02] |
0.86 [0.01] |
0.85 [0.02] |
0.84 [0.01] |
0.93 [0.01] |
| Pounds |
272.1 [53.5] |
261.4 [53.4] |
254.5 [53.9] |
250.0 [53.5] |
245.7 [53.0] |
250.0 [53.8] |
| Kg |
123.5 [24.2] |
118.8 [24.3] |
115.9 [24.6] |
113.6 [24.3] |
111.8 [24.0] |
113.7 [24.3] |
| BMI |
42.7 [7.0] |
41.0 [7.0] |
40.0 [7.0] |
39.3 [7.0] |
38.6 [6.9] |
39.2 [7.1] |
| TC |
287.8 [38.7] |
274.7 [36.9] |
259.4 [30.9] |
269.1 [30.6] |
280.5 [28.3] |
280.5 [26.4] |
| LDL |
206.5 [38.7] |
195.1 [37.7] |
180.9 [33.1] |
188.1 [31.1] |
198.3 [28.0] |
204.4 [27.4] |
| HDL |
43.0 [6.1] |
43.2 [5.3] |
43.3 [4.9] |
43.7 [5.4] |
42.5 [3.8] |
42.0 [3.0] |
| TC/HDL |
6.8 [1.1] |
6.4 [1.1] |
6.1 [0.9] |
6.2 [0.9] |
6.6 [0.8] |
6.7 [0.7] |
| VLDL |
38.4 [6.3] |
36.4 [5.7] |
35.2 [5.4] |
37.1 [5.3] |
39.6 [5.5] |
39.1 [9.6] |
| TG |
192.1 [31.4] |
181.8 [28.6] |
175.9 [26.8] |
185.7 [26.7] |
197.9 [27.6] |
195.4 [48.0] |
| TG/HDL |
4.6 [1.1] |
4.3 [0.9] |
4.1 [0.7] |
4.3 [0.7] |
4.7 [0.7] |
4.7 [1.1] |
| CRP |
1.07 [1.79] |
1.00 [1.59] |
1.34 [1.54] |
1.19 [1.37] |
1.26 [0.59] |
0.80 [0.42] |
| IL-6 |
6.79 [4.34] |
8.14 [3.76] |
10.58 [3.72] |
10.56 [2.50] |
10.56 [2.49] |
9.70 [3.10] |
| Hcy |
16.4 [10.6] |
17.3 [9.7] |
20.4 [12.7] |
21.9 [11.5] |
23.0 [10.9] |
20.4 [10.1] |
| Fib |
311.0 [62.7] |
317.4 [61.8] |
330.1 [56.8] |
337.0 [55.1] |
340.8 [52.2] |
339.1 [49.9] |
| Lp (a) |
24.3 [10.9] |
24.9 [10.7] |
26.3 [10.8] |
27.6 [11.2] |
29.9 [11.8] |
28.7 [11.6] |
Table 3e: 1500-1600 kcal/day low carbohydrate diet without vitamin supplement (Mean [SD]).
| Variables |
Baseline |
6 weeks |
3 months |
6 months |
1 year |
4 months after |
| II |
0.066 [0.061] |
NA |
NA |
NA |
0.116 [0.094] |
NA |
| RQ |
0.90 [0.02] |
0.87 [0.02] |
0.86 [0.02] |
0.85 [0.02] |
0.83 [0.02] |
0.89 [0.02] |
| Pounds |
285.8 [48.9] |
269.0 [51.7] |
259.1 [52.5] |
248.3 [47.4] |
244.3 [47.7] |
249.0 [38.9] |
| Kg |
129.9 [22.1] |
122.4 [23.4] |
117.7 [23.9] |
112.9 [21.5] |
111.1 [21.8] |
113.3 [17.7] |
| BMI |
43.6 [6.7] |
42.3 [8.2] |
39.6 [7.4] |
38.1 [6.8] |
37.3 [6.8] |
38.1 [5.4] |
| TC |
286.7 [45.3] |
277.8 [42.1] |
276.2 [39.3] |
288.7 [43.6] |
315.1 [38.1] |
315.7 [37.5] |
| LDL |
203.8 [45.0] |
197.5 [42.4] |
195.8 [39.7] |
206.1 [43.2] |
228.3 [38.5] |
229.1 [36.6] |
| HDL |
41.4 [7.2] |
40.6 [5.3] |
40.8 [4.1] |
40.8 [3.4] |
40.1 [3.2] |
41.6 [2.7] |
| TC/HDL |
7.2 [2.2] |
7.0 [1.9] |
6.9 [1.6] |
7.2 [1.5] |
7.9 [1.4] |
7.7 [1.3] |
| VLDL |
41.7 [9.0] |
39.6 [8.2] |
39.5 [7.3] |
41.8 [6.7] |
46.6 [8.3] |
44.8 [7.0] |
| TG |
208.4 [45.1] |
198.0 [40.8] |
197.6 [36.5] |
209.2 [33.6] |
232.9 [41.7] |
224.2 [35.1] |
| TG/HDL |
5.2 [1.3] |
5.0 [1.3] |
4.9 [1.1] |
5.2 [1.1] |
5.9 [1.2] |
5.4 [1.1] |
| CRP |
0.96 [0.97] |
0.79 [0.48] |
0.68 [0.23] |
0.74 [0.15] |
0.62 [0.21] |
0.42 [0.21] |
| IL-6 |
5.28 [2.86] |
5.67 [2.67] |
6.67 [3.40] |
7.54 [3.20] |
7.23 [2.62] |
6.42 [2.45] |
| Hcy |
15.1 [8.0] |
15.4 [6.8] |
14.8 [6.5] |
14.4 [5.6] |
15.1 [4.6] |
14.5 [4.5] |
| Fib |
332.6 [67.3] |
340.8 [65.0] |
351.9 [61.5] |
360.6 [50.2] |
372.4 [47.5] |
373.5 [48.1] |
| Lp (a) |
20.2 [12.0] |
21.9 [11.0] |
22.9 [10.7] |
24.0 [11.0] |
25.5 [11.1] |
25.8 [10.5] |
Table 3f: 1500-1600 kcal/day low carbohydrate diet with vitamin supplement (Mean [SD]).
Variances within this study were generally homogeneous with the exception of the Ischemic Index [14,17,36], which is distinctive as shown in Figure 2 with smaller Vegan variance. However, the difference in medians is greater than that of means so that the results in Table 4 are conservative. Similarly, robust regression analysis, which minimized the impact of the outliers, yielded much larger coefficients but in the same proportions as did the linear model. Analysis of reduced data sets, with outliers excluded, also yielded larger coefficients and much higher significance levels. Thus the linear fit presented appears to be conservative in its estimates of effects. Confidence intervals are provided in Table 4 for one-year changes in each health risk factor by diet for both within diet effects (changes for each diet from baseline) and between diet effects (differences between diets in changes). Using the ANOVA randomization test, the Bonferroni adjusted probability for all fifteen measures and three groups at initiation of the study, R2<0.05 with P (Bonferroni)=0.20.

Figure 2: Notched box-and-whisker plots of quartile distributions of one-year changes in each cardiovascular risk factor index under each diet. Boxes extend from 1st to 3rd quartile; whiskers extend 1.5 times the interquartile range; all outliers are shown. Medians differ significantly (P< 0.05) for non-overlapping notches.
| Body Mass Index (kg/m2) |
Very Low Density Lipoprotein (mg/dl) |
| LMF |
(-4.93 to -4.39) |
LMF |
(-15.8 to -11.4) |
| LoCarb |
(-4.78 to -4.24) |
LoCarb |
(+0.819 to +5.21) |
| Veg |
(-4.87 to -4.32) |
Veg |
(-16.0 to -11.6) |
| Locarb-LMF |
(-0.238 to +0.533) |
LoCarb-LMF |
(+13.5 to +19.7) |
| Veg-LMF |
(-0.323 to +0.448) |
Veg-LMF |
(-3.32 to +2.30) |
| LoCarb-Veg |
(-0.300 to +0.470) |
LoCarb-Veg |
(+13.7 to +19.9) |
| Ischemic Index |
Triglycerides (mg/dl) |
| LMF |
(-0.039 to -0.017) |
LMF |
(-79.0 to -57.0) |
| LoCarb |
(+0.024 to +0.047) |
LoCarb |
(+4.11 to +26.1) |
| Veg |
(-0.025 to -0.002) |
Veg |
(-80.1 to -58.1) |
| Locarb-LMF |
(+0.047 to +0.079) |
LoCarb-LMF |
(+67.6 to +98.6) |
| Veg-LMF |
(-0.002 to +0.030) |
Veg-LMF |
(-16.6 to +14.5) |
| LoCarb-Veg |
(+0.033 to +0.065) |
LoCarb-Veg |
(+68.6 to +99.7) |
| Interleukin-6 (pg/ml) |
Insulin Resistance (TG/HDL) |
| LMF |
(-3.40 to -1.44) |
LMF |
(-2.43 to -1.78) |
| LoCarb |
(+1.88 to +3.85) |
LoCarb |
(+0.075 to +0.722) |
| Veg |
(-3.45 to -1.48) |
Veg |
(-2.26 to -1.62) |
| LoCarb-LMF |
(+3.89 to +6.67) |
LoCarb-LMF |
(+2.04 to +2.96) |
| Veg-LMF |
(-1.44 to +1.35) |
Veg-LMF |
(-0.295 to +0.619) |
| LoCarb-Veg |
(+3.94 to +6.72) |
LoCarb-Veg |
(+1.88 to +2.80) |
| Respiratory Quotient |
C-reactive Protein (mg/dl) |
| LMF |
(+0.024 to +0.039) |
LMF |
(-1.08 to +0.059) |
| LoCarb |
(-0.072 to -0.057) |
LoCarb |
(-0.644 to +0.499) |
| Veg |
(+0.067 to +0.082) |
Veg |
(-1.86 to -0.720) |
| LoCarb-LMF |
(-0.107 to -0.085) |
LoCarb-LMF |
(-0.369 to +1.25) |
| Veg-LMF |
(+0.032 to +0.054) |
Veg-LMF |
(-1.59 to +0.029) |
| LoCarb-Veg |
(-0.076 to -0.053) |
LoCarb-Veg |
(+0.411 to +2.03) |
| Total Cholesterol (mg/dl) |
Homocysteine (µmol/L) |
| LMF |
(-72.3 to -48.1) |
LMF |
(-8.36 to -4.30) |
| LoCarb |
(-0.426 to +23.8 |
LoCarb |
(+1.13 to +5.36) |
| Veg |
(-60.2 to -35.9) |
Veg |
(-6.50 to -2.46) |
| LoCarb-LMF |
(+54.8 to +89.0) |
LoCarb-LMF |
(+6.78 to +12.5) |
| Veg-LMF |
(-5.00 to +29.3) |
Veg-LMF |
(-1.02 to +4.72) |
| LoCarb-Veg |
(+42.6 to +76.9) |
LoCarb-Veg |
(+4.93 to +10.7) |
| Low Density Lipoprotein (mg/dl) |
Fibrinogen (mg/dl) |
| LMF |
(-63.9 to -40.8) |
LMF |
(-24.0 to +8.91) |
| LoCarb |
(-2.15 to +21.0) |
LoCarb |
(+18.3 to +51.2) |
| Veg |
(-50.7 to -27.6) |
Veg |
(-20.6 to +12.3) |
| LoCarb-LMF |
(+45.4 to +78.2) |
LoCarb-LMF |
(+19.1 to +65.6) |
| Veg-LMF |
(-3.14 to +29.6) |
Veg-LMF |
(-19.9 to +26.7) |
| LoCarb-Veg |
(+32.2 to +64.9) |
LoCarb-Veg |
(+15.7 to +62.2) |
| High Density Lipoprotein (mg/dl) |
Lipoprotein(a)(mg/dl) |
| LMF |
(+4.32 to +7.68) |
LMF |
(-10.7 to -7.36) |
| LoCarb |
(-2.56 to+0.807) |
LoCarb |
(+3.76 to +7.09) |
| Veg |
(+3.27 to +6.63) |
Veg |
(-6.97 to -3.63) |
| LoCarb-LMF |
(-9.25 to-4.50) |
LoCarb-LMF |
(+12.1 to +16.8) |
| Veg-LMF |
(-3.43 to+1.33) |
Veg-LMF |
(+1.37 to + 6.08) |
| LoCarb-Veg |
(-8.20 to -3.45) |
LoCarb-Veg |
(+8.37 to +13.1) |
| TC/HDL |
|
|
| LMF |
(-2.56 to -1.86) |
|
|
| LoCarb |
(-0.005 to +0.691) |
|
|
| Veg |
(-1.99 to -1.29) |
|
|
| LoCarb-LMF |
(+2.06 to +3.04) |
|
|
| Veg-LMF |
(+0.077 to +1.06) |
|
|
| LoCarb-Veg |
(+1.49 to +2.47) |
|
|
Table 4: CI’s (95%) of mean within diet group changes and between groups changes in cardiovascular risk indices with one-year of dieting.
Diet effect sizes, shown in Table 5 in order of statistical significance, are the coefficients of determination (R2 adjusted for degrees of freedom) and confidence intervals for the multiple correlation (R) (non-central F derived). Table 6 shows the statistical significance of the changes from baseline at one-year for each index for each dietary intervention.
| Cardiovascular Risk Factor |
R (CI 95%) |
R2 (adjusted) |
F (2/117 df) |
| Body Mass Index |
.00 to .02 |
-0.01 |
0.3 |
| Respiratory Quotient |
.82 to .92 |
0.84 |
226.** |
| Lipoprotein(a) |
.68 to .81 |
0.57 |
81.0** |
| Triglycerides (TG) |
.67 to .81 |
0.56 |
77.3** |
| Very Low Density Lipoprotein (VLDL) |
.67 to .81 |
0.56 |
77.2** |
| Insulin Resistance (TG/HDL) |
.66 to .80 |
0.55 |
74.9** |
| TC/HDL |
.61 to .77 |
0.49 |
59.0** |
| Total Cholesterol (TC) |
.52 to .71 |
0.4 |
40.3** |
| Interleukin-6 |
.51 to .71 |
0.39 |
38.8** |
| Ischemic Index |
.48 to .69 |
0.36 |
33.9** |
| Low Density Lipoprotein (LDL) |
.46 to .68 |
0.34 |
31.6** |
| Homocysteine |
.41 to .64 |
0.29 |
25.4** |
| High Density Lipoprotein (HDL) |
.34 to .60 |
0.24 |
19.4** |
| Fibrinogen |
.16 to .48 |
0.11 |
8.17** |
| C-reactive Protein |
.06 to .41 |
0.06 |
4.67* |
| NOTE: *P(Bonferroni) <0.05 ; **P(Bonferroni) <0.001 |
Table 5: Statistical effect sizes of differences between diets in changes in cardiovascular risk factors after one year of dieting: ratio of diet differences effect variance to total variance (R) and coefficient of determination (R2 adjusted for df).
| Assessment |
| Diet Coefficients |
Estimate |
Std. Error |
t value |
Pr(>|t|) |
| Ischemic Index |
| (Intercept-LMF) |
-0.028 |
0.005703 |
-4.91 |
2.98e-06 **** |
| LoCarb |
0.06325 |
0.008065 |
7.843 |
2.28e-12 ***** |
| Vegan |
0.014 |
0.008065 |
1.736 |
0.0852 |
| Body Mass Index |
| (Intercept-LMF) |
-4.6575 |
0.1362 |
-34.185 |
<2e-16***** |
| LoCarb |
0.1475 |
0.1927 |
0.766 |
0.446 |
| Vegan |
0.0625 |
0.1927 |
0.324 |
0.746 |
| Respiratory Quotient |
| (Intercept-LMF) |
0.0315 |
0.003968 |
7.938 |
1.38e-12***** |
| LoCarb |
-0.096 |
0.005612 |
-17.107 |
<2e-16***** |
| Vegan |
0.043 |
0.005612 |
7.663 |
5.83e-12***** |
| Total Cholesterol (TC) |
| (Intercept-LMF) |
-60.2 |
6.063 |
-9.929 |
<2e-16***** |
| LoCarb |
71.9 |
8.574 |
8.386 |
1.31e-13***** |
| Vegan |
12.15 |
8.574 |
1.417 |
0.159 |
| Low Density Lipoprotein (LDL) |
| (Intercept-LMF) |
-52.375 |
5.786 |
-9.052 |
3.70e-15***** |
| LoCarb |
61.8 |
8.182 |
7.553 |
1.03e-11***** |
| Vegan |
13.225 |
8.182 |
1.616 |
0.109 |
| High Density Lipoprotein (HDL) |
| (Intercept-LMF) |
6 |
0.8408 |
7.136 |
8.66e-11 ***** |
| LoCarb |
-6.875 |
1.189 |
-5.782 |
6.25e-08 ***** |
| Vegan |
-1.05 |
1.189 |
-0.883 |
0.379 |
| TC/HDL |
| (Intercept-LMF) |
-2.207 |
0.1742 |
-12.671 |
<2e-16***** |
| LoCarb |
2.55 |
0.2463 |
10.353 |
<2e-16***** |
| Vegan |
0.57 |
0.2463 |
2.314 |
0.0224 |
| Very Low Density Lipoprotein (VLDL) |
| (Intercept-LMF) |
-13.6 |
1.0986 |
-12.379 |
<2e-16***** |
| LoCarb |
16.6175 |
1.5537 |
10.696 |
<2e-16***** |
| Vegan |
-0.2125 |
1.5537 |
-0.137 |
0.891 |
| Triglycerides (TG) |
| (Intercept-LMF) |
-68 |
5.493 |
-12.38 |
<2e-16***** |
| LoCarb |
83.1 |
7.768 |
10.698 |
<2e-16***** |
| Vegan |
-1.075 |
7.768 |
-0.138 |
0.89 |
| Insulin Resistance (TG/HDL) |
| (Intercept-LMF) |
-2.1027 |
0.1617 |
-13 |
<2e-16***** |
| LoCarb |
2.501 |
0.2287 |
10.933 |
<2e-16***** |
| Vegan |
0.162 |
0.2287 |
0.708 |
0.48 |
| C-reactive Protein |
| (Intercept-LMF) |
-0.5125 |
0.2859 |
-1.793 |
0.0756 |
| LoCarb |
0.44 |
0.4043 |
1.088 |
0.2787 |
| Vegan |
-0.78 |
0.4043 |
-1.929 |
0.0561 |
| Interleukin-6 |
| (Intercept-LMF) |
-2.42 |
0.4916 |
-4.922 |
2.83e-06**** |
| LoCarb |
5.2825 |
0.6953 |
7.598 |
8.16e-12***** |
| Vegan |
-0.045 |
0.6953 |
-0.065 |
0.949 |
| Homocysteine |
| (Intercept-LMF) |
-6.325 |
1.015 |
-6.229 |
7.62e-09***** |
| LoCarb |
9.65 |
1.436 |
6.72 |
6.97e-10***** |
| Vegan |
1.85 |
1.436 |
1.288 |
0.2 |
| Fibrinogen |
| (Intercept-LMF) |
-7.55 |
8.23 |
-0.917 |
0.36082 |
| LoCarb |
42.325 |
11.639 |
3.637 |
0.000412** |
| Vegan |
3.375 |
11.639 |
0.29 |
0.772343 |
| Lipoprotein(a) |
| (Intercept) |
-9.025 |
0.8335 |
-10.83 |
<2e-16***** |
| LoCarb |
14.45 |
1.1787 |
12.26 |
<2e-16***** |
| Vegan |
3.725 |
1.1787 |
3.16 |
0.00201 * |
| Significance codes: p<: `*****' 0.000001 `****' 0.00001 `***' 0.0001 `**.' 0.001 `* ' 0.01 |
Table 6: Analyses of deviance of changes induced by one year of dieting.
Figures (Figures 2 and 3), for all variates, were constructed with notched box plots. The notches are a form of confidence interval such that non-overlapping notches show a significant (P<0.05) difference in medians. The boxes encompass the 2nd and 3rd quartiles; the whiskers represent 1.5 times the interquartile range; all outliers beyond that range are shown. This form of display reveals the data distribution. Though the scale of the display is determined by outliers, the notch intervals retain their relationships and as medians are not influenced by the outliers.
Figure 3 displays plots only for those risk factors, which showed significant (F-statistic, P<.05) post-diet changes at the fourmonth follow-up. Variability increased post-diet and the medians dependent graphic seems a more meaningful representation than the means dependent F-statistic. Table 7 shows the statistically significant post-diet changes, while the cumulative effect of the three diets over the entire 16-month study on the indices are shown in Table 8.

Figure 3: Notched box-and-whisker plots of quartile distributions of four month post-diet changes for each cardiovascular risk factor index, which changed significantly (F test, P< 0.05) after the end of the controlled diet period. Medians differ significantly (P< 0.05) for nonoverlapping notches. Note that the F-test of means is more sensitive to outliers than is this medians test.
| Assessment |
| Diet Coefficients |
Estimate |
Std. Error |
t value |
Pr(>|t|) |
| Respiratory Quotient |
| (Intercept-LMF) |
-0.0015 |
0.005713 |
-0.263 |
0.79337 |
| LoCarb |
0.0995 |
0.00808 |
12.315 |
<2e-16***** |
| Vegan |
0.0015 |
0.00808 |
0.186 |
0.853048 |
| Vitamin |
0.001 |
0.00808 |
0.124 |
0.901717 |
| LoCarb:Vitamin |
-0.0445 |
0.011426 |
-3.895 |
0.000166** |
| Vegan:Vitamin |
-0.0475 |
0.011426 |
-4.157 |
6.27e-05*** |
| R-square |
0.77 |
|
|
<2.2e-16***** |
| High Density Lipoprotein(HDL) |
| (Intercept-LMF) |
0.7 |
0.4693 |
1.491 |
0.13861 |
| LoCarb |
-1.25 |
0.6638 |
-1.883 |
0.06222 |
| Vegan |
0.25 |
0.6638 |
0.377 |
0.70714 |
| Vitamin |
0.6 |
0.6638 |
0.904 |
0.36793 |
| LoCarb:Vitamin |
1.45 |
0.9387 |
1.545 |
0.12519 |
| Vegan:Vitamin |
-2.6 |
0.9387 |
-2.77 |
0.00655 |
| C-reactive Protein |
| (Intercept-LMF) |
0.1 |
0.04319 |
2.316 |
0.0223 |
| LoCarb |
-0.565 |
0.06108 |
-9.251 |
1.54e-15***** |
| Vegan |
-0.12 |
0.06108 |
-1.965 |
0.051874 |
| Vitamin |
-0.075 |
0.06108 |
-1.228 |
0.221984 |
| LoCarb:Vitamin |
0.34 |
0.08637 |
3.936 |
0.000143** |
| Vegan:Vitamin |
0.22 |
0.08637 |
2.547 |
0.012196 |
| R-square |
0.53 |
|
|
<2.2e-16***** |
| Lipoprotein(a) |
| (Intercept) |
-1.2 |
0.5174 |
-2.319 |
0.02217 |
| LoCarb |
0.05 |
0.7318 |
0.068 |
0.94564 |
| Vegan |
2.25 |
0.7318 |
3.075 |
0.00264* |
| Vitamin |
0.45 |
0.7318 |
0.615 |
0.53981 |
| LoCarb:Vitamin |
1 |
1.0349 |
0.966 |
0.33594 |
| Vegan:Vitamin |
-2.4 |
1.0349 |
-2.319 |
0.02217 |
| Significance codes p<: `*****' 0.000001 `****' 0.00001 `***' 0.0001 `**.' 0.001 `* ' 0.01 |
Table 7: Analysis of deviance of statistically significant post-diet changes.
| Assessment |
| Diet Coefficients |
Estimate |
Std. Error |
t value |
Pr(>|t|) |
| Body Mass Index |
| (Intercept-LMF) |
-5.0675 |
0.1617 |
-31.347 |
<2e-16***** |
| LoCarb |
1.2525 |
0.2286 |
5.479 |
2.49e-07***** |
| Vegan |
0.5475 |
0.2286 |
2.395 |
0.0182 |
| Respiratory Quotient |
| (Intercept-LMF) |
0.02 |
0.007187 |
2.783 |
0.00631 |
| LoCarb |
0.0115 |
0.010164 |
1.131 |
0.26024 |
| Vegan |
0.0505 |
0.010164 |
4.969 |
2.39e-06**** |
| Vitamin |
0.021 |
0.010164 |
2.066 |
0.04108 |
| LoCarb:Vitamin |
-0.0605 |
0.014374 |
-4.209 |
5.14e-05*** |
| Vegan:Vitamin |
-0.0595 |
0.014374 |
-4.139 |
6.70e-05*** |
| Total Cholesterol (TC) |
| (Intercept-LMF) |
-68.075 |
5.917 |
-11.506 |
< 2e-16***** |
| LoCarb |
79.05 |
8.367 |
9.447 |
4.37e-16***** |
| Vegan |
30.225 |
8.367 |
3.612 |
0.000448** |
| Low Density Lipoprotein (LDL) |
| (Intercept-LMF) |
-60.075 |
5.624 |
-10.682 |
< 2e-16***** |
| LoCarb |
69.425 |
7.953 |
8.729 |
2.10e-14***** |
| Vegan |
32 |
7.953 |
4.024 |
0.000102*** |
| High Density Lipoprotein (HDL) |
| (Intercept-LMF) |
7 |
0.8762 |
7.989 |
1.06e-12***** |
| LoCarb |
-7.4 |
1.2392 |
-5.972 |
2.58e-08***** |
| Vegan |
-2.1 |
1.2392 |
-1.695 |
0.0928 |
| TC/HDL |
| (Intercept-LMF) |
-2.4557 |
0.1805 |
-13.61 |
<2e-16***** |
| LoCarb |
2.6935 |
0.2552 |
10.55 |
< 2e-16**** |
| Vegan |
1.031 |
0.2552 |
4.04 |
0.000096*** |
| Very Low Density Lipoprotein (VLDL) |
| (Intercept-LMF) |
-14.76 |
1.216 |
-12.141 |
< 2e-16 ***** |
| LoCarb |
16.665 |
1.719 |
9.693 |
<2e-16 ***** |
| Vegan |
0.04 |
1.719 |
0.023 |
0.981 |
| Triglycerides (TG) |
| (Intercept-LMF) |
-73.8 |
6.079 |
-12.141 |
<2e-16***** |
| LoCarb |
83.325 |
8.597 |
9.693 |
<2e-16***** |
| Vegan |
0.2 |
8.597 |
0.023 |
0.981 |
| Insulin Resistance (TG/HDL) |
| (Intercept-LMF) |
-2.283 |
0.1713 |
-13.33 |
<2e-16***** |
| LoCarb |
2.4635 |
0.2422 |
10.171 |
<2e-16***** |
| Vegan |
0.2513 |
0.2422 |
1.037 |
0.302 |
| C-reactive Protein |
| (Intercept-LMF) |
-0.515 |
0.3983 |
-1.293 |
0.1986 |
| LoCarb |
0.245 |
0.5633 |
0.435 |
0.6644 |
| Vegan |
-0.03 |
0.5633 |
-0.053 |
0.9576 |
| Vitamin |
0.13 |
0.5633 |
0.231 |
0.8179 |
| LoCarb:Vitamin |
-0.4 |
0.7966 |
-0.502 |
0.6165 |
| Vegan:Vitamin |
-1.52 |
0.7966 |
-1.908 |
0.0589 |
| Interleukin-6 |
| (Intercept-LMF) |
-2.3875 |
0.5372 |
-4.444 |
2.02e-05*** |
| LoCarb |
4.41 |
0.7598 |
5.804 |
5.64e-08***** |
| Vegan |
-0.445 |
0.7598 |
-0.586 |
0.559 |
| Homocysteine |
| (Intercept-LMF) |
-6.1 |
1.08 |
-5.648 |
1.16e-07***** |
| LoCarb |
7.825 |
1.527 |
5.123 |
1.20e-06**** |
| Vegan |
1.45 |
1.527 |
0.949 |
0.344 |
| Fibrinogen |
| (Intercept-LMF) |
0.875 |
8.938 |
0.098 |
0.92218 |
| LoCarb |
33.6 |
12.64 |
2.658 |
0.00895 |
| Vegan |
-3.65 |
12.64 |
-0.289 |
0.77327 |
| Lipoprotein(a) |
| (Intercept) |
-10 |
1.006 |
-9.944 |
<2e-16***** |
| LoCarb |
15 |
1.422 |
10.547 |
<2e-16***** |
| Vegan |
4.775 |
1.422 |
3.357 |
0.00106* |
| Significance codes: p<: `*****' 0.000001 `****' 0.00001 `***' 0.0001 `**.' 0.001 `* ' 0.01 |
Table 8: Analyses of deviance of long-term changes induced by three diets.
The mean weight loss during the 12-month dietary period was 29.25 pounds (13.3 kg) and did not differ by diet. The BMI was similarly reduced without differences between diets (0.75
There was significant reduction in homocysteine with the LMF diet and Vegan diet (P<0.001) and significant increase with the LoCarb diet (P<0.001).
Fibrinogen was unaffected by the LMF or Vegan diets but was significantly increased (P<0.001) on the LoCarb diet. A significant improvement (reduction) in lipoprotein(a) [Lp(a)], was seen among individuals following the LMF diet (P<0.001) and to a lesser extent (p<0.01) the Vegan diet. A significant increase (P<0.001) in Lp(a) was seen in the group following the LoCarb regimen.
Each of the diets showed an initial improvement in lipids. However, the results varied after the first few months with those on the Vegan and LMF diets showing improvements (P<0.001) in their lipid levels and their insulin resistance [21] (P<0.001) as measured by TG/HDL. In contrast, the initial improvements in lipids on the LoCarb diet were short-lived, instead showing significant (P<0.001) subsequent gain in risk. By the end of 12 months of dieting TG/HDL had returned to pre-diet levels (P<0.001), an effect which persisted 4 months post-diet.
CRP changes for each diet were not statistically significant but different trends led to a statistically significant (P<0.05) but clinically minimal (R2=0.06) overall CRP effect size. In contrast, interleukin-6 (IL-6), which is a more specific marker of vascular inflammation, was significantly reduced (P<0.001) on both the LMF and Vegan diets but increased (P<0.001) on the LoCarb diet.
Discussion
“In our experiment, we found that the low carbohydrate, high saturated fat diet worsened all cardiac risk factors and coronary blood flow as determined by myocardial perfusion imaging, despite a mean weight loss of 29 pounds at 1 year. This is in direct contrast to the low/moderate fat and vegan diets which improved all cardiac risk factors and coronary blood flow in association with similar weight loss, demonstrating that not all dietary weight loss strategies improve cardiac risk factors” [34].
That 100% of participants continued on their respective diet plans through a full year of dieting contrasts sharply with much of diet research experience with drop outs and with common experience with difficulties of dieting and remaining on diets. This success can be attributed to attention to well-established psychological principles of habit acquisition and extinction and of behaviour modification through self efficacy oriented nondirective counseling.
The treatment goal was to change eating habits. Over a century of research has been devoted to the details of habit formation. Habit formation is incremental, dependent on practice, specific in behaviours, specific to the learning conditions, and rewarding. Thus the diet must be the diet, or close to the diet, which is to become habitual. A crash diet or limited content diet is neither a target diet for life habit formation nor rewarding or even feasible for habit formation. The 1500-1600-calorie design is at or close to the ultimate maintenance level habit objective.
Habits to be modified are not actually modified. The process entails conditioned inhibition of the undesired behaviour and operant conditioning of the desired behaviour, which is conditioned to the specific stimulus conditions. If the diet conditioning conditions are not those of the normal life pattern, the original habits are likely to be reinstated when the dieter returns to normal conditions. Aversive conditions produce avoidance behaviours. These counter the acquisition of new behaviours and need to be minimized. For example, participants generally dislike maintaining required diaries as evidenced by the fact that most presumably contemporaneous diaries are filled out days or weeks after the events recorded. Not only do such aversive requirements tend to interfere with establishing new habits but they also become part of the stimulus conditions for the new habits. Their termination at the end of a study returns the individual to earlier stimulus conditions and higher probability of reinstating earlier habits. Patients also find it aversive to tell their physicians they failed to follow directions, a result they can avoid by dissimulation or by failing to keep an appointment.
It is well established that individuals show reduced avoidance when they perceive the situation as one where the aversive stimulation is under their control. Hunger is aversive, though it should be noted it is partially a conditioned response. Dietary counseling needs to emphasize that the food selection and menu are entirely under the participant’s control. The original informed consent was to complete the study whether or not it was successful in weight loss or ability to adhere with the understanding that the results ultimately would be helpful to future dieters including the participant.
Physicians, on the average, listen to patients for only 23 seconds before interrupting with diagnosis and directions [35]. The listening times, in this study, of 20-30 nondirective minutes is the complete antithesis of common medical practice and physician experience. Physicians are often astonished when critiqued using videotapes of their interviewing. Habits arising from time constrained conditions become so ingrained that there is no consciousness of the minimization of listening. Yet it is generic non-directive counseling methods [6] that have proven most effective in behaviour modification.
In the past three decades a major development in counseling has arisen from the concept of self efficacy [7]. The goal is to lead individuals to perceive themselves as fully capable of resolving problems on their own. People are most likely to modify their behaviour if the locus of control is internal rather than external. When the dieter reports difficulties in the dieting, counseling offers support, not solutions, and at most, suggestions that might enable the dieter to arrive at an internally derived solution. One doesn’t offer menus; one may suggest some cookbooks. One does not suggest a specific food; one may point out some seasonal items currently in the grocery store.
Some studies have suggested that LoCarb diets result in greater weight loss than other diets. In both the work of Westman [19] and Samaha [3], the studies showed greater caloric restriction among individuals on the LoCarb diet, than those following other diets. Both studies revealed a greater weight loss with greater caloric restriction, regardless of the diet content. In support of this, Foster [2] and Fleming [16] have both shown similar findings with weight loss contingent upon caloric intake. In this study, compared with other diets, those on the LoCarb diet showed a significantly greater (P<0.001) initial reduction in weight and BMI. This difference in initial weight loss and reduction in BMI disappeared throughout the duration of the study, demonstrating no cumulative long-term differences in weight loss among any of the isocaloric diets. The initial reduction follows the expected trend due to the combined effect of fat catabolism and resulting water loss. Alternatively it could represent a steeper response to conditioning due to taste preferences for higher fat foods resulting in reaching asymptotic levels sooner than those following the other diet plans. Study of the time course of counseling effects is planned.
A major assumption of most weight loss programs has been that losing weight automatically lowers ones risk of coronary artery disease. However, failure to document a significant coronary artery stenosis does not exclude the existence of inflammatory coronary artery disease [36-39]. Ischemia can be physiologically determined by reductions in regional [36] coronary blood flow in comparison to regions with normal vasodilatory capacities, which are capable of increasing coronary blood flow to meet the physiologic and metabolic demands of the heart. As previously [36,37] described these regions of reduced blood flow can be quantified to determine both the extent and reduction in coronary blood flow throughout the heart, compared to normal blood flow. This cumulative reduction in maximal coronary blood flow is the ischemic index (II) and can be used to detect minor changes in coronary blood flow that can otherwise go clinically undetected unless a “vulnerable inflammatory plaque” ruptures. Here, the long-term effect of a LMF diet shows significant improvement in coronary blood flow and in regression of inflammatory coronary artery disease (Figures 2 and 3). A reduction in coronary blood flow and an increase in inflammatory coronary artery disease indices are evident for a LoCarb diet. Though weight gain alone may lead to increased cardiovascular risks, weight loss from a LoCarb diet did not prove sufficient to reverse those risks but, in fact, increased them [38-40].
R2, the coefficient of determination, is a standard measure of effect size measuring, what is somewhat misleadingly termed, the “proportion of variance accounted for”. It is the proportionate increase in precision of an estimate calculated using the derived regression equation. Clinicians often are more interested in the general magnitude of the effects than in applying mathematical equations to calculate quantitative estimates for individual patients. For that reason we share a preference for R, the ratio of effects variance to total variance [32] and show the confidence intervals in Table 5.
Recent research has suggested that individuals on LoCarb diets may initially lower their cholesterol levels. This is important since cholesterol, particularly LDL cholesterol is considered important in causing many of the initial problems ultimately leading to vascular inflammation, the final common pathway of coronary artery disease. Most of this previous research has shown improvement in lipid levels during the first few months on the diet, with little or no long-term data to substantiate residual effects. These studies have had significant dropout rates and some individuals have been removed from the studies due to increases in cholesterol levels. Recent studies [9,41] have shown significant drop out rates with no significant weight loss or cardiovascular disease benefit. Given a 40 to 60 percent drop out rates in such studies, it is impossible to determine either a weight or cardiovascular benefit. This effect of subject drop out is problematic because it introduces bias into the final results and as such, it is impossible to statistically compare the results of such studies with one in which subject participation is maintained. Long-term effects of a diet cannot be based upon short-term findings, or the removal of individuals who had adverse lipid effects. Though the central objective of this experiment was to elucidate dietary effects on cardiovascular health, the data also provide significant insight into the scientific aspects of weight control. It is noteworthy that with all the potential sources of variability existing in individual personal characteristics, in self-management of dietary menu selection and preparation, of portion control, and of exercise regimen, those diet factors, which proved to be significant, accounted for a substantial portion of the total variance. Even the two major post-diet changes shown in Figure 3, Respiratory Quotient and C-reactive Protein, were diet specific with R=0.88 and 0.73 respectively (P<0.001).
The increase in fibrinogen on the LoCarb diet could not be accounted for by hormonal (estrogen) or exercise differences. This increase in fibrinogen can increase both blood viscosity and blood clotting and may clinically be associated with an increased potential for strokes and heart attacks. This reduction in fibrinogen on the LMF and Vegan diet indicates a reduced risk in inflammatory and clotting abnormalities.
Determination of coronary artery inflammation has frequently been measured using c-reactive (CRP) protein. However, CRP like erythrocyte (ESR) sedimentation rate, is a non-specific marker of either inflammatory or infectious problems, which is made in the liver, and has been associated with acute coronary syndromes [42], meningitis, and other inflammatory problems.
Conclusion
One year practicing self-management of a diet and exercise regimen appears sufficient to form new dietary habits based on that pattern. The respiratory quotients showed no significant change in those on the LMF diet after four months of no further dietary intervention. Those following the vegan regimen tended to reduce the carbohydrate content of their diet as evidenced by a reduction in RQ, while those on the low carbohydrate high fat diet showed an increase in RQ reflecting an increase in carbohydrate consumption. While these changes were not statistically significant, they do reflect a tendency for people to follow a more moderate diet with caloric restriction after a period of education and counseling. The regimen used resulted in 100% participant retention. We believe the high success in weight loss and participant retention results from the time-intensive supportive nondirective counseling used. Comprehensive diet counseling has been shown more effective than shorter contact directive methods for heart patients [43]. Recommendations for behavioural counseling in health applications are currently under public health study [44]. The extent to which the large participant withdrawal rates, which have typified weight-loss studies, bias those studies is unknown. This renders it difficult, if not impossible, to make direct comparisons. However, we note that the consistency of results, the very large effect sizes, and the extreme probability levels obtained, imply very high reliability with the reported procedures at 100% participant retention. All of this supports the proposition that public health policies will undoubtedly play a major role in implementing major changes in societal behaviors, which can subsequently reduce atherosclerosis and other inflammatory health problems as they have with smoking cessation and changes in air quality.
Obesity and overweight are primarily products of the acts of food choice. We now know that these food choices and their impact are at least partially precipitated by the inflammatory effect of our diets based given our inability to convert Neu5Ac to Neu5Gc and our bodies immune response to the Neu5Gc present in animal protein [45-51]. Choosing is behaviour. Ideally treatment should include modification of dietary choice behaviours: menu item selection and portion control. Experimenter or commercial pre-packaged menus and portions do not enable such behaviour modification. Essential to new habit formation is repetitive practice of the new behaviours sought. People frequently find dieting unpleasant. It is an established behavioural principle that individuals tolerate much more discomfort or pain when they have more control over the source of discomfort and/or believe they are doing it for the betterment of Society as Ancel Keys conscientious objectors did during WWII. Additionally, the principle of repetitive practice implies practicing the diet for long-term weight-loss maintenance. Thus, one would expect self managed diets approximating a desired maintenance diet to show greater participant retention throughout the course of the study and better maintenance of weight loss after cessation of the study.
While the present study clearly demonstrates the ability to change behaviour, required for weight reduction and weight maintenance, it raises serious concerns about the inflammatory effects seen on diets which deviate from a LMF complex carbohydrate diet with caloric restriction, when such diets are followed for an extended period of time. Since coronary artery disease is an inflammatory [51,52] process and since one-half of all people undergoing myocardial infarctions have “normal” cholesterol levels with minimal coronary lumen disease [14,36-39], studies, which measure cholesterol levels alone, are inadequate for the assessment of coronary artery disease. This study showed similar changes in lipid levels during the first 3 to 4 months of the study, with divergence thereafter depending upon the dietary regimen followed. In some instances these changes approached baseline values by the end of the year of intervention, in other instances the lipids worsened. By contrast, more specific markers of inflammatory coronary artery disease (homocysteine, CRP, IL-6) and myocardial blood flow itself demonstrated a worsening of disease independent of changes in weight, BMI or lipid levels. Recently published studies [53,54] continue to confirm our prior contention that inflammation is the underlying cause of heart disease. The changes in CRP seen in these studies reflect changes in individuals with coronary artery disease, thereby making the specificity of CRP greater than it would be in the general population. In general, CRP is a nonspecific marker for inflammation and in the general population, as represented by this study, there would be less specificity for inflammatory changes within coronary arteries, making interleukin-6 a more specific albeit expensive approach to determining inflammatory changes within the coronary arteries. In this study changes in IL-6 tightly overlapped changes seen in coronary blood flow as determined by nuclear imaging of the heart, especially “quantitative” myocardial perfusion imaging [54-56]. This study indicates the need for concern and emphasizes the limitations of prior studies which have looked only at weight and lipid responses or have not addressed caloric, saturated fat and/or refined processed carbohydrate reduction. From a practical perspective the procedures employed here work well for both weight reduction/control and maintaining/improving cardiovascular health through the reduction of the inflammatory process seen in humans in contrast to other primates and other animals [57,58].
Acknowledgement
We thank Dr. Jennifer Forsberg for helpful discussions from a counseling psychology perspective.
23263
References
- Finkelstein EA, Fiebelkorn IC, Wang G (2003) National medical spending attributable to overweight and obesity: How much, and who's paying? Health Aff W3: 219-226.
- Foster GD, Wyatt HR, Hill JO, McGuckin BG, Brill C, et al. (2003) A randomized trial of a low-carbohydrate diet for obesity. N Engl J Med 348: 2082-2090.
- Samaha FF, Iqbal N, Seshadri P, Chicano KL, Daily DA, et al. (2003) A low-carbohydrate as compared with a low-fat diet in severe obesity. N Engl J Med 348: 2074-2081.
- News KRTB (2004) What's good for your waistline may not be good for your food company stocks. Saint Paul Pioneer Press.
- Hilgard ER, Bower GH (1966) Theories of learning. New York: Appleton-Century-Crofts.
- Rogers CR (1942) Counseling and psychotherapy. Boston: Houghton-Mifflin.
- Bandura A (1977) Self-efficacy: Toward a unifying theory of behavioral change. Psychol Rev 84: 191-215.
- Venables W, Ripley B (1999) Modern applied statistics with S-PLUS. New York: Springer-Verlag.
- Dansinger ML, Gleason JA, Griffith JL, Selker HP, Schaefer EJ (2005) Comparison of the Atkins, Ornish, weight watchers and zone diets for weight loss and heart disease risk reduction: A randomized trial. JAMA 293: 43-53.
- Ornish D, Brown SE, Scherwitz LW, Billings JH, Armstrong WT, et al. (1990) Can lifestyle changes reverse coronary heart disease? The lifestyle heart trial. Lancet 336: 129-133.
- Fleming RM, Ketchum K, Fleming DM, Gaede R (1995) Treating hyperlipidemia in the elderly. Angiology 46: 1075-1083.
- Fleming RM, Ketchum K, Fleming DM, Gaede R (1996) Assessing the independent effect of dietary counseling and hypolipidemic medications on serum lipids. Angiology 47: 831-840.
- Barnard RJ (1991) Effects of life-style modification on serum lipids. Arch Intern Med 151: 1389-1394.
- Fleming R (1999) The pathogenesis of vascular disease. The textbook of angiology. New York: Springer: 787-798.
- Fleming RM (2000) Reversing heart disease in the new millennium: The Fleming unified theory. Angiology 51: 617-629.
- Fleming RM (2002) The effect of high-, moderate-, and low-fat diets on weight loss and cardiovascular disease risk factors. Prev Cardiol 5: 110-118.
- Fleming RM (2000) The effect of high-protein diets on coronary blood flow. Angiology 51: 817-826.
- Vogel RA, Corretti MC, Plotnick GD (1997) Effect of a single high-fat meal on endothelial function in healthy subjects. Am J Cardiol 79: 350-354.
- Westman EC, Yancy WS, Edman JS, Tomlin KF, Perkins CE (2002) Effect of 6-month adherence to a very low carbohydrate diet program. Am J Med 113: 30-36.
- Larosa JC, Fry AG, Muesing R, Rosing DR (1980) Effects of high-protein, low-carbohydrate dieting on plasma lipoproteins and body weight. J Am Diet Assoc 77: 264-270.
- Luscombe ND, Clifton PM, Noakes M, Farnsworth E, Wittert G (2003) Effect of a high-protein, energy-restricted diet on weight loss and energy expenditure after weight stabilization in hyperinsulinemic subjects. Int J Obes Relat Metab Disord 27: 582-590.
- Anderson JW, Herman RH (1975) Effects of carbohydrate restriction on glucose tolerance of normal men and reactive hypoglycemic patients. Am J Clin Nutr 28: 748-755.
- Simpson RW, Mann JI, Eaton J, Moore RA, Carter R, et al. (1979) Improved glucose control in maturity-onset diabetes treated with high-carbohydrate-modified fat diet. Br Med J 1: 1753-1756.
- Simpson HC, Carter RD, Lousley S, Mann JI (1982) Digestible carbohydrate: An independent effect on diabetic control in type 2 (non-insulin-dependent) diabetic patients? Diabetologia 23: 235-239.
- Ward GM, Simpson RW, Simpson HC, Naylor BA, Mann JI, et al. (1982) Insulin receptor binding increased by high carbohydrate low fat diet in non-insulin-dependent diabetics. Eur J Clin Invest 12: 93-96.
- McLaughlin T, Abbasi F, Cheal K, Chu J, Lamendola C, et al. (2003) Use of metabolic markers to identify overweight individuals who are insulin resistant. Ann Intern Med 139: 802-809.
- Esposito K, Pontillo A, Di Palo C, Giugliano G, Masella M, et al. (2003) Effect of weight loss and lifestyle changes on vascular inflammatory markers in obese women: A randomized trial. JAMA 289: 1799-1804.
- Fernandez-Real JM, Ricart W (2003) Insulin resistance and chronic cardiovascular inflammatory syndrome. Endocr Rev 24: 278-301.
- De Pergola G, Pannacciulli N (2002) Coagulation and fibrinolysis abnormalities in obesity. J Endocrinol Invest 25: 899-904.
- Rallidis LS, Paschos G, Liakos GK, Velissaridou AH, Anastasiadis G, et al. (2003) Dietary alpha-linolenic acid decreases C-reactive protein, serum amyloid A and interleukin-6 in dyslipidaemic patients. Atherosclerosis 167: 237-242.
- Fleming RM (2003) Caloric intake, not carbohydrate or fat consumption, determines weight loss. Am J Med 114: 78.
- Snedecor G, Cochran W (1980) Statistical methods. Lowa State University Press.
- Fleming RM (2002) High-dose dipyridamole and gated Sestamibi SPECT imaging provide diagnostic resting and stress ejection fractions useful for predicting extent of coronary artery disease. Angiology 53: 415-421.
- Marvel MK, Epstein RM, Flowers K, Beckman HB (1999) Soliciting the patient's agenda: have we improved? JAMA 281: 283-287.
- Fleming R (2003) Angina and coronary ischemia are the result of coronary regional blood flow differences. J Am Coll Angiol 1:127-142.
- Fleming RM, Harrington GM (1994) Quantitative coronary arteriography and its assessment of atherosclerosis. Part II Calculating stenosis flow reserve from percent diameter stenosis. Angiology 45: 835-840.
- Fleming RM, Kirkeeide RL, Smalling RW, Gould KL (1991) Patterns in visual interpretation of coronary arteriograms as detected by quantitative coronary arteriography. J Am Coll Cardiol 18: 945-951.
- Fleming RM (2001) Coronary artery disease is more than just coronary lumen disease. Am J Cardiol 88: 599-600.
- Ozer D (1985) Correlation and the coefficient of determination. Psychological bulletin 97: 307-315.
- Tsai AG, Wadden TA (2005) Systematic review: An evaluation of major commercial weight loss programs in the United States. Ann Intern Med 142: 56-66.
- Fleming R (2003) Using C-reactive protein as a marker of bacterially aggravated atherosclerosis in acute coronary syndromes. J Am Coll Angiol 1: 165-171.
- Dalgard C, Thuroe A, Haastrup B, Haghfelt T, Stender S (2001) Saturated fat intake is reduced in patients with ischemic heart disease 1 year after comprehensive counseling but not after brief counseling. J Am Diet Assoc 101: 1420-1429.
- U.S. Preventive Services Task Force (2004) Behavioral counseling in primary care to promote a healthy diet.
- Varki A (2009) Essentials of glycobiology. New York, Cold Spring Harbor Laboratory Press.
- Soto PC, Stein LL, Hurtado-Ziola N, Hedrick SM, Varki A (2010) Relative over-reactivity of human versus chimpanzee lymphocytes: Implications for the human diseases associated with immune activation 184: 4185-4195.
- Dunn R (2015) The man who touched his own heart. Chapter 16. Sugarcoating heart disease. New York.
- Hedlund M, Padler-Karavani V, Varki NM, Varki A (2008) Evidence for a human-specific mechanism for diet and antibody-mediated inflammation in carcinoma progression. Proc Natl Acad Sci USA 48: 18936-18941.
- Varki A (2010) Uniquely human evolution of Sialic acid genetics and biology. Proc Natl Acad Sci USA 107: 8939-8946.
- Samraj AN, Pearce OMT, Laubli H, Crittenden AN, Bergfeld AK, et al. (2015) A red meat-derived glycan promotes inflammation and cancer progression. Proc Natl Acad Sci 112: 542-547.
- Salama A, Mosser M, Leveque X, Perota A, Judor JP, et al. (2017) Neu5Gc and α1-3 GAL Xenoantigen knockout does not affect glycemia homeostasis and insulin secretion in pigs. Diabetes 66: 987-993.
- Fleming RM (2011) Inflammation and heart disease. Fleming Unified Theory Of Vascular Disease: 655833842.
- Ridker PM, Cannon CP, Morrow D, Rifai N, Rose LM, et al. (2005) C-reactive protein levels and outcomes after statin therapy. N Engl J Med 352: 20-28.
- Nissen SE, Tuzcu EM, Schoenhagen P, Crowe T, Sasiela WJ, et al. (2005) Statin therapy, LDL cholesterol, C-reactive protein, and coronary artery disease. N Engl J Med 352: 29-38.
- Fleming RM, Fleming MR, Chaudhuri T, McKusick, A, Dooley WC, et al. (2018) Both percent diameter stenosis (%DS) and coronary flow reserve can be derived directly from myocardial perfusion imaging using FMTVDM and measurement of isotope redistribution. J Nucl Med Radiat Ther 9: 1000353.
- Fleming RM, Fleming MR, McKusick A, Chaudhuri T (2018) The fleming method for tissue and vascular differentiation and metabolism (FMTVDM) using same state single or sequential quantification comparisons. J Vasc Dz & Treat.
- Muchmore EA, Varki NM, Fukuda M, Varki A (1987) Developmental regulation of sialic acid modifications in rat and human colon. FASEB J 1: 229-235.
- Nguyen DH, Hurtado-Ziola N, Gagneux P, Varki A (2006) Loss of siglec expression on T lymphocytes during human evolution. Proc Natl Acad Sci USA 103: 7765-7770.