Keywords
Diet management tool; Nutrition assessment system; Dietary counselling; Type 2 diabetes
Introduction
In Malaysia, the usual nutrition education techniques used mostly in outpatient diabetic clinics, are either individual or group dietary counselling [1]. This nutrition education is conducted by a dietitian. A nutrition education via dietary counselling is a process anticipated to help patients to develop and maintain good eating habits. This education process provides support to healthcare professional especially dietitian in encouraging or advising patient to change their dietary habit, in terms of diet modification and designing a healthy diet for patients (diabetic diet menu plan) based on their preferences and health status. In order to ensure the dietary counselling is successful, it should be tailored to patient’s lifestyle, motivational factor, culture, economic constraint and goals to be achieved [2,3]. Tailoring the dietary counselling to a more personal diet of a good glycaemic control is crucial to achieve [4].
Many studies have been conducted in other countries and revealed the importance of dietary counselling in managing diet of diabetes patients. Only several studies have shown the advantages of promoting usage of innovative approach mainly a web-based nutritional assessment system in dietary counselling of diabetes care. At this time, there are limited studies regarding the effectiveness of dietary counselling using web-based intervention (Information Technology, IT) in Malaysia. The improved usage of information technology in worldwide especially in nutrition education indicates that an interactive web-based intervention may be beneficial for dietary change interventions, promoting healthy diet and behaviour changes [5-8]. Computer web-based systems are increasingly being used as a tool for dietary assessment [9]. Various researchers reported that a web-based system uses enhances glycaemic control in patients with diabetes [10-12]. The delivery system of diabetic control using a web-based system have also revealed great efficacy in weight loss [13,14]. Furthermore, the establishment of a web-based technology has the potential to be developed for dietary counselling purposes which allows better communication between dietitians and patients. As such, a web-based system was implemented to facilitate dietary assessment for dietitian in the diet for diabetes patients.
The approach used in this study was to develop an intervention that incorporates dietary counselling using Diet Management Tool (DMT), a web-based nutrition assessment system in managing diet of diabetes patients. Therefore, the purpose of this study is to investigate the effect of the intervention on patient health outcomes and a nine month follow up that consist of four times meeting with dietitian was used to evaluate the effectiveness of the intervention. The specific hypotheses tested that participants in the intervention group who received one-to-one dietary counselling using DMT would have improved anthropometric measurement, biochemical profile (HbA1c, FBS and eAG) and dietary pattern compared with control group.
Methodology
Study design
A randomized controlled trial was undertaken to compare a control group given routine or traditional dietary counselling against an intervention group who received dietary counselling using web-based intervention over nine months of period in patients with type 2 diabetes. Written consent was obtained before the initiation of the study. Evaluation was made at baseline (month 0) and subsequently at month three, six and nine. The outcomes of this study was anthropometric measurements, glycaemic control assessed by fasting blood sugar (FBS) and glycated haemoglobin A1c (HbA1c) and dietary changes. This study was approved by the clinical research and ethics committee of our institution.
Subject selection and randomization
A randomized controlled trial was undertaken at the Outpatient Dietetic Clinic, Hospital Universiti Sains Malaysia (HUSM), Kelantan, Malaysia. Patients were eligible to participate if they age between 30 to 55 years old, having been diagnosed with Type 2 Diabetes Mellitus (T2DM) with glycosylated haemoglobin (HbA1c) level of more than 6.5%, had consulted dietitian at Outpatient Dietetic Clinic, HUSM, no insulin usage, neither had serious or ongoing illness nor cognitive disorder and agree to participate in this study. Exclusions criteria included subjects who were diagnosed with Type 1 Diabetes Mellitus (T1DM) or Gestational Diabetes Mellitus (Pregnant women with diabetes), unwilling to participate in this study and any condition that would prevent participation or completion of this study. Fifty five patients agreed to participate and were randomly assigned to either in the intervention or control group according to their assigned number. In this procedure, a separate piece of cards were marked with number 1 and 2. Participants were given the instruction to pick up one card from the box. Participants who picked cards marked “1” were placed in the intervention group and those who picked cards marked “2” were in the control group. After the selection procedure, finally determined 29 participants in the intervention group and 26 participants in the control group.
This research involved a follow up study on periodic of three months, six months and nine months from the baseline study. During the three months of study, one of the participants from the intervention group and four of the participants from the control group withdrew from the study. The participants from the intervention group withdrew due to personal reasons. Three participants from the control group also withdrew citing personal reasons while one withdrew because he has started insulin treatment. Finally, only 28 participants from the intervention group and 22 participants from the control group remained throughout the study (Figure 1).
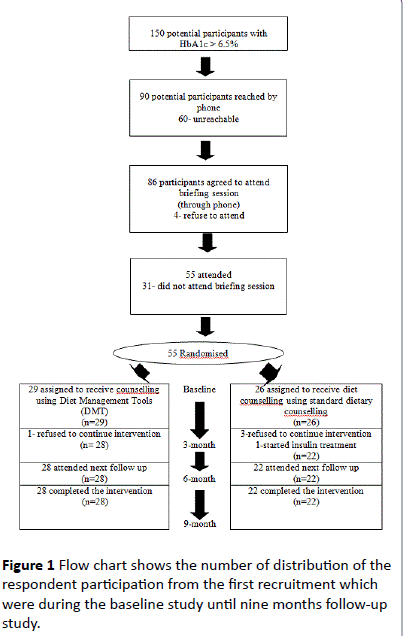
Figure 1: Flow chart shows the number of distribution of the respondent participation from the first recruitment which were during the baseline study until nine months follow-up study.
Intervention group or dietary counselling using DMT
Participants from intervention group were received dietary counselling using a system called Diet Management Tool (DMT). This dietary counselling was provided by a trained dietitian. DMT is a system developed in collaboration with Health Informatics Unit (HIS), School of Health Sciences, USM. This web-based system can be reached through address: https://www.dmt.kk.usm.my. This system is part of information technology initiatives that has been incorporated in the dietetic services at HUSM since the use of information technology is beneficial and very well accepted among healthcare professionals. The concept of tailored was used in the application of DMT in this groups. Tailored dietary counselling means to suit the dietary advices according to patient’s needs, culture and background.
In this research, this concept was aimed to introduce information technology as a platform to suits diet needs of a patient individually through DMT system. DMT system which is a web-based system was applied in term of dietary assessment as to improve the nutritional status and quality of life of diabetic patients. DMT system consists of patient’s demographic and nutrition modules. The modules are patient’s socio demographic data, medical data, anthropometric data, diet history, energy requirement estimation, social data (marital status and occupation), Medical Nutrition Therapy (MNT) goals, food distribution info, food exchange list, food analyses and information of nutrition and monitoring evaluation. This system also used the Recommended Nutrient Intake (RNI) [15] and the Medical Nutrition Therapy (MNT) Guideline for Malaysian [16] to suit with the diet management for diabetes patients. This system is used as a nutritional assessment for diabetes patients in improving the quality of dietary counselling. The dietitians involved in this study were exposed with this web-based system. This system will help dietitians in their assignment by undertaking nutritional assessment and hence provide an intervention that tailored with the needs of the participants.
Control group or standardized dietary counselling (CG)
Participants in the control group received their standard dietary counselling from trained dietitian without usage of web-based system (information technology) approach. The counselling session usually took almost 45 minutes to one hour per visit. The differences and similarities between standardized dietary counselling and DMT counselling were summarized on Table 1.
| Standardized Dietary Counselling |
Dietary Counselling Using DMT |
| Routine counselling or traditional dietary counselling |
Counselling method based on online web application |
| One-to-one basis approach counselling |
One-to-one basis approach counselling |
| Intervention would include dietary intake assessment and questionnaire; and treatment approach cater to specific patient |
Intervention includes dietary intake assessment and questionnaire; and web based treatment (tailored intervention approach) |
| All participants information will be recorded in into the patient folder |
All participants information will be keyed in into the DMT system |
| Energy requirement needed by each participants will be calculated manually |
Energy requirement needed by each participants will be calculated by the DMT system |
| Specific menu will be created manually on calories intake requirement |
Specific menu will be tailored (guided & standardised through DMT) based on calories intake requirement and other information pertinent to patient’s condition available in the system |
| The specific menu will be issued manually to the participants |
The specific menu will be generated and printed to the participants through the system |
| Counselling session was between 45 minutes to 1 hour |
Counselling session between 45 minutes to 1 hour |
Table 1: The differences and similarities between standardized dietary counselling and DMT counselling.
Anthropometric measurements
The anthropometric measurements involved were weight and height. Weight was measured in kilogram (kg) while height in centimeter (cm). The apparatus was calibrated before the measurement. Two measurements were taken in order to ensure the accuracy of the data and the mean of both measurements. Weights of the participants in the intervention and control groups were measured using the SECA 769 Digital Medical Scale (SECA Corporation, Hamburg, Germany) in kilogram. The weight was taken twice and for mean value to the nearest 0.1 kg. All the participants were weighed without shoes and any accessories. They were also need to stand upright and in a resting position. Weight was measured at baseline, three months, six months and nine months of study. Participant’s measurement of height was measured using the same tool to measure a weight. The value was taken in centimeter (cm), taken twice for mean values and nearest to 0.1 cm. The SECA was positioned vertically and put on a flat surface while the participants will stand straight with heel, hips, and shoulder in one alignment without shoes and any items on the head. Later, the horizontal plat on the SECA was pulled upward until it reached the top of the participant’s head. BMI or Quatlelet’s Index is a simple index of weight-forheight and commonly used as a classification for overweight and obesity in adults. It is defined as the weight in kilograms divided by the square of the height in meters (kg/m2). WHO classification is commonly used to classify the participant’s BMI accordingly.
Biochemical assessments
The measurement of biochemical profile was conducted to identify the status of diabetes control among the participants. In addition, the measurement was done four times during the baseline, three months, six months and nine months of study. The blood was taken after overnight fasting and the samples were analyzed by accredited lab. These profiles were recorded during the anthropometric measurement taken from the participants. The blood test measured was fasting blood sugar (FBS) and HbA1c. FBS represented the value of current diabetes control while HbA1c was an indicator of blood glucose control for the previous three months. These two metabolic control indicators were classified into two categories: good control and poor control according to WHO criteria for diagnosis of Diabetes Mellitus (DM).
Dietary assessments
Diet was assessed by using dietary history and food frequency questionnaire (FFQ). The interviewer-administered questionnaire used in this study was adapted and modified from Suzana et al. [17]. This dietary assessment was collected during the baseline, three months and six months of study only.
a) Dietary history
Dietary intake was calculated based on the dietary history recorded between these three timeframe. The method to investigate information pertaining to the dietary history by which the participants needed to report what they were consuming (food and drink) specifically from early in the morning until before going to sleep. Hence, participants also needed to report the eating time, how the food was cooked, where the food were taken (either at home or outside), size and portion of food items (size was based on household measurement such as spoon, ladle, cup or bowl). These household measurements were used and showed to the participants during the collection of data dietary history session. Then, the total of food intake was measured and changed into gram for further analyses.
b) Food frequency questionnaire (FFQ)
FFQ was used to detect the total intake of high refined sugar in diabetes patients. It was administered by interview done by dietitian where participants were asked on the frequency of intake of each food items consumed such as per day, per week, per month, per year or none. In addition, participants were also requested to respond regarding the number of servings consumed each time when they eaten the foods. The researcher also provided a standard serving size for each of food items listed and the serving size was based on Food Atlas Book: Portion and Exchange Size [18] and the serving size was referred as medium size. Conversion of food frequency to amount the total intake of food items was also applied in this research [19].
Analyses were using Malaysian Food Composition Table (4th Edition) [20], Food Atlas Book: Portion and Exchange Size [18] and also by referring to USDA National Nutrient Database for Standard Reference website (https://ndb.nal.usda.gov/) [21]. However, if information regarding macronutrient and fibre content did not found in the USDA website for certain food items, the food labeling was referred for details. The nutrients involved in the analyses were macronutrients, dietary fibre and sugar intake of the participants’. The important macronutrients were energy, carbohydrate and fat. As to investigate the optimum energy consumption needed by each participant, the researcher used the Harris Benedict’s formula. The value of the requirement was based on participant’s age, weight, height, and different activities level.
Sample size and power calculations
The sample size was determined using Naing (2007) [22]. In type 2 diabetic patients, baseline HbA1c was 9.1% in the intervention and 8.7% in the control group, with a significant difference in the changes after six months in favour of the intervention group: - 0.48 vs. - 0.17%, respectively (P = 0.0005) [23]. The sample size calculated based on a significance level of 0.05 and a power of 0.80. Based on the calculation, the required sample size is 18-20 per group or totally 40 participants for both groups. It was recommended to add 10-20% for drop-out.
Statistical analysis
The Statistical Package for the Social Science for Windows (SPSS, version 18.0) software was used to analyse the data. Descriptive analyses were used to examine demographic variables. The mean and standard deviation (SD) were calculated for normally distributed continuous variables and the median and interquartile range (IQR) for the skewed variables. Meanwhile, for inference analyses, before evaluating the effectiveness of dietary counselling using DMT in managing diet for diabetes patients, the difference between groups as a range of variable were examined. Independent ttest and Mann Whitney test were used to compare mean or median differences data between intervention and control group. In order to assess the group differences of dependent variables changes, repeated measures ANCOVA was used with data from the baseline, age were used as covariates and gender as confounding factor. The data were collected four times: at baseline, three months, six months and nine months of study. A significance level of 0.05 was used to test the significance.
Results
Characteristics of participants
At the end of study, 50 patients completed the study with a total dropout rate of 9.1%. There were 28 and 22 participants in the intervention and control group eligible for analysis. There were no significant differences in demographic and clinical characteristics between participants in both groups. It is important to note that participants in both groups were overweight, poor glycaemic control as demonstrated by higher level of HbA1c and FBS and higher energy intake compare to energy requirements. With respect to the treatment received by participants, eighty-six percent of the study sample was on diet and taking oral anti diabetic drugs, while 14.0% on diet treatment. Most of the participants had diabetes in between one to five years with a percentage of 68.0% (Table 2).
| Variables |
Intervention Group n (%) (n=28) |
Control Group n (%) (n=22) |
| Race |
|
|
| Malay |
25 (89.3%) |
19 (86.4%) |
| Non-Malay |
3 (10.7%) |
3 (13.6%) |
| Marital status |
|
|
| Married |
27 (96.4%) |
21 (95.5%) |
| Widowed |
1 (3.6%) |
1 (4.5%) |
| Educational level |
|
|
| None |
- |
1 (4.5%) |
| Primary |
1 (3.6%) |
1 (4.5%) |
| Secondary |
21 (75.0%) |
16 (72.7%) |
| College/University |
6 (21.4%) |
4 (18. 2%) |
| Occupation |
|
|
| Government/ Private |
17 (60.7%) |
12 (54.5%) |
| Self-employee |
5 (17.9%) |
7 (31.8%) |
| Pensioner |
1 (3.6%) |
2 (9.1%) |
| None/Homemaker |
5 (17.9%) |
1 (4.5%) |
| Duration of diabetes (years) |
|
|
| < 1 |
1 (3.6%) |
6 (27.3%) |
| 1-5 |
23 (82.1%) |
11 (50.0%) |
| 6-10 |
2 (7.1%) |
1 (4.5%) |
| > 10 |
2 (7.1%) |
4 (18.2%) |
| Type of diabetes treatment |
|
|
| Diet alone |
- |
7 (31.8%) |
| Diet and oral anti diabetic drugs |
28 (100%) |
15 (68.2%) |
| Family history of diabetes |
|
|
| Yes |
20 (71.4%) |
11 (50.0%) |
| No |
8 (28.6%) |
11 (50.0%) |
| Other health problems |
|
|
| Yes |
18 (64.3%) |
13 (59.1%) |
| No |
10 (35.7%) |
9 (40.9%) |
| Smoking |
|
|
| Yes |
4 (14.3%) |
1 (4.5%) |
| Never |
20 (71.4%) |
17 (77.3%) |
| Quit |
4 (14.3%) |
4 (18.2%) |
| Physical activity |
|
|
| Yes |
16 (57.1%) |
8 (36.4%) |
| No |
12 (42.9%) |
14 (63.6%) |
| BMI Group (kgm-2) |
|
|
| < 18. 5 |
- |
- |
| 18.5 – 24.9 |
1 (3.6%) |
2 (9.1%) |
| 25 – 29.9 |
13 (46.4%) |
10 (45.5%) |
| 30 – 34.9 |
12 (42.9%) |
9 (40.9%) |
| 35 – 39.9 |
1 (3.6%) |
1 (4.5%) |
| = 40 |
1 (3.6%) |
- |
| Income (Malaysian Ringgit) |
|
|
| None |
3 (10.7%) |
1 (4.5%) |
| < 1000 |
7 (25.0%) |
3 (13.6%) |
| 1001-2000 |
4 (14.3%) |
4 (18.2%) |
| 2001-3000 |
9 (32.1%) |
5 (22.7%) |
| > 3000 |
5 (17.9%) |
9 (40.9%) |
Table 2: Social-demographic and health profile based on different study groups [The value were stated in (%)].
Baseline study
Table 3 shows the baseline characteristics for all who completed the baseline study. There were no significant differences between the groups at baseline. Those who completing the baseline assessment was classified in the overweight category (25 -29.9 kgm-2) based on the BMI classification according to WHO, uncontrolled blood sugar level, slightly higher total calorie intake for both groups when compared to their energy requirement, mean carbohydrate intake were in the recommended value and participants’ mean fat intake were exceeds the recommended value for diabetic participants, i.e. 25-30% of total calorie intake from fat sources. Meanwhile, the mean sugar intake for both groups was higher than the recommended value for diabetic participants (not more than 10% of total calorie intake) and the mean of dietary fibre consumption were low compared to the recommendation standard (20-30 gm/day).
| Baseline |
Mean ± SD / Median ± IQR |
p value (2-tailed) |
| Intervention Group (n=28) |
Control Group (n=22) |
| Anthropometric measurements |
|
|
|
| Weight (kg) |
75.71 (12.95) |
72.66 (9.95) |
0.367 |
| Height (cm) |
159.72 (7.45) |
158.82 (7.40) |
0.673 |
| BMI (kgm-2) |
29.46 (4.07) |
28.86 (3.88) |
0.599 |
| Glycaemic control |
|
|
|
| HbA1c (%) |
7.85 (3.1) |
8.25 (4.9) |
0.93 |
| Fasting blood sugar (mmol/L) |
7.95 (4.5) |
9.05 (5.6) |
0.538 |
| Estimated average glucose (mmol/L) |
9.90 (5.0) |
10.55 (7.8) |
0.93 |
| Dietary intake |
|
|
|
| Energy Requirement (kcal/day) |
1542.59 (289.60) |
1547.99 (219.96) |
0.942 |
| Calorie intake (kcal) |
1737.88 (577.59) |
1621.83 (509.87) |
0.462 |
| CHO (gm) |
233.58 (89.98) |
224.52 (74.93) |
0.706 |
| Fat (gm) |
59.56 (36.21) |
56.30 (23.91) |
0.269 |
| Sugar (gm) |
44.83 (45.63) |
45.54 (39.66) |
0.799 |
| Dietary Fibre (gm) |
12.00 (6.30) |
11.23 (5.61) |
0.607 |
Table 3: Baseline variables at the time of randomization to the intervention and control group.
Abbreviations: BMI: Body Mass Index; which is calculated as weight in kilograms divided by the square of height in meters.
CHO: Carbohydrate.
Values are mean ± SD / Median ± IQR
No significant differences between groups during baseline using independent t test / Mann-Whitney test.
No significant differences between groups during baseline using independent t test / Mann-Whitney test
Intervention study
The changes in bodyweight and BMI from baseline to nine months did not differ significantly between groups. In term of biochemical profile, there was a significant reduction in HbA1c levels in the intervention group from baseline to three, six and nine months. When controlled for the baseline value, age and gender, there was a significant difference in HbA1c between groups with a significant reduction of HbA1c compared to the control group (Figure 2) (p<0.05) and FBS showed no significance difference (Table 4). In the meantime, the changes in dietary intake in term of energy, carbohydrate, fat, sugar and dietary fibre did not differ significantly between groups.
| Biochemical Value |
Type III Sum of Squares |
df |
Mean Square |
F |
P value |
| HbA1c |
63.078 |
1 |
63.078 |
10.857 |
0.002 |
| Fasting Blood Sugar (FBS) |
60.702 |
1 |
60.702 |
2.755 |
0.105 |
| Estimated average glucose (eAG) |
166.47 |
1 |
166.47 |
11.204 |
0.002 |
Table 4:Biochemical value among intervention and control groups (Between group analyses regardless of time).
Repeated measures ANCOVA between group analyses was applied
Potential covariate (age, baseline data) and gender (confounding factor) was controlled by using repeated measures ANCOVA
Level of significance was set at 0.05 (two-tailed)
Note: 1-Baseline 2- 3 month 3- 6month 4- 9 month.
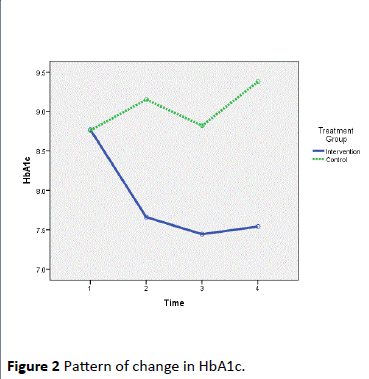
Figure 2: Pattern of change in HbA1c.
Discussion
The purpose of this study was to examine whether one-toone dietary counselling by dietitians using Diet Management Tool (DMT) improves health outcomes of type 2 diabetes patients. The specific hypothesis tested was to examine the effectiveness of tailored intervention approach using DMT towards improvement of anthropometric measurement, biochemical profile and improvement of dietary intake pattern among diabetes patients in the intervention and control group.
Three hypotheses were examined and answered in this study. For hypothesis one, participants in the intervention group who received one-to-one dietary counselling using DMT would have significant difference of anthropometric measurement compared to participants in the control group. The result of this study could not support this hypothesis. In terms of anthropometric profile, no significant changes in weight or BMI can be seen in diabetes patients in these two groups. Meanwhile, for hypothesis two, participants in the intervention group who received one-to-one dietary counselling using DMT would have significant difference of biochemical profile (HbA1c, FBS and eAG) compared to participants in the control group. It was found that one-to-one dietary counselling by dietitian for diabetes patients type 2 improve their health outcomes using Diet Management Tool (DMT) in term of improving HbA1c and estimated average glucose (eAG) (p< 0.05) (Figure 3).
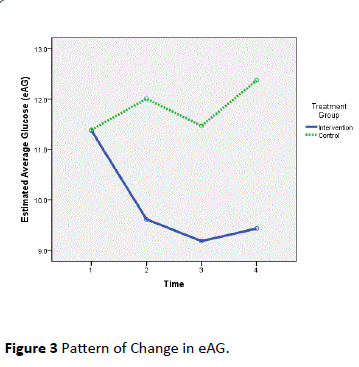
Figure 3: Pattern of Change in eAG.
Hypothesis three stated that participants in the intervention group who received the one-to-one dietary counselling using DMT would have significant difference of dietary pattern compared to participants in the control group. The result of this study could not support this hypothesis. In terms of food pattern, this study indicated that there was no significant difference of mean dietary intake of energy, carbohydrate, fat and dietary fibre in the intervention and control groups during the three duration time of study (baseline study, three months and six months). It means that one-to-one dietary counselling using DMT have no significant effect on dietary pattern among diabetic patients. However, even though the result were not statistically significant, fat and dietary fibre intake in the intervention group showed a positive improvement from baseline towards end of the study compared to control group.
Watanabe et al. [24] reported that a four kg weight reduction (weights loss) resulted in significant improvements in HbA1c reduction greater than 0.3% in four month intervention. However, in this study, there is no significant difference found in weight loss and food pattern between the two groups. This may be due to the duration of intervention study. This study was conducted only for short duration of time. In addition, it was also found that participants in this study have gained weight within the first twelve month and a few were successful in weight loss and maintained weight. A study done by Crawford et al. [25] also showed a similar finding. Another study done by Yusof et al. [26] found that participants that have received dietary advice either low Glycaemic Index (GI) or conventional carbohydrate (CCE) in a 12 week treatment did not differ significantly between groups in terms of body weight and BMI. However, they found significant difference of waist circumference rather than BMI. In a study conducted by Ruzita et al. [1], they found that there was a significant reduction of BMI after six month of group dietary counselling among diabetes patients. Even though the participants in the intervention group did not reduce their energy intake, they experienced a reduction in BMI which indicates that the body fat loss due to lowered fat consumption. These findings were consistent with our results of no significant changes in terms of total calorie intake. Although the results showed no significant difference between the two groups, the fat intake of the intervention group showed a reduction that decreased insulin sensitivity hence improves blood glucose control.
These data supported one of our three hypotheses which tailored intervention approach using DMT, a web-based nutrition assessment system was effective in improving glycaemic control in patients with type 2 diabetes. Finally, this study showed that during the course of the counselling processes, there were no significant differences of food pattern of participants between the two groups. This may be due to under-reporting of total food intake in dietary assessment which is common as reported by Weber et al. [27] as well as having difficulty in changing patient’s dietary habit as reported by Olivarius et al. [28]. The insignificant differences of food pattern also may be due to poor nutrition knowledge and health awareness among diabetic patients as reported by Lim et al. [29].
This study had some limitations such as inappropriate distribution of ethnic because majority of participants were Malay and it may not represent multi-cultural background of Malaysia since the sample was from Kelantan. The accuracy of the dietary intake may have affected the results since this study were using dietary history and food frequency questionnaire (FFQ). Both techniques required the participants to report and cooperate during data collection. It may influence the result since both of this technique required patient to recall the memories. As a result, the information given by participants may be either over-reporting or underreporting of total calorie and nutrient intake. It is possible that memories bias can be caused by some memory difficulty such as poor memory, poor attention or literacy problems [30]. This study requires a follow-up meeting and several strategies were conducted to make sure that participant attend the meetings. This may have reflected the results since participants need to be reminded prior to next meeting. There was no follow-up beyond nine months of study. It was reported that ongoing intervention is needed to support continued good metabolic outcomes [31] and multiple therapies may be needed to attain good or optimal blood glucose control among diabetes patients [32].
In conclusion, tailored intervention approach using DMT gave positive results only in improvement of glycaemic control of HbA1c and eAG among diabetes patients. There were no significant changes in terms of BMI and food intake pattern among participants. Continuing diabetes education especially dietary counselling via web-based intervention is therefore important to maintain good metabolic control. Further study is needed to assess the effectiveness of this web-based intervention on long term in the dietary management among diabetes patients, to determine the reason of unsuccessful weight loss and improvement of food pattern among patients.
Acknowledgement
This study was supported by Grant: National Institute of Health, Ministry of Health, Malaysia [304/PPSK/6150095/ NI08].We acknowledges Mr. Nazri Mat Hussin as IT Officer, the health care providers and outpatients with T2DM in Outpatient Dietetic Clinic, Hospital Universiti Sains Malaysia (HUSM) and fellow friends that involved directly or indirectly throughout the study.
9843
References
- Ruzita T, Osman A, Fatimah A, Khalid AK (1997) The effectiveness of group dietary counselling among non-insulin dependent diabetes mellitus (NIDDM) patients in resettlement scheme areas in Malaysia. Asia Pac J ClinNutr6: 84-87.
- Ha TKK, Lean MEJ (1998) Technical review recommendations for the nutritional management of patients with diabetes mellitus. Eur J ClinNutr 52: 467-481.
- Siddiqui A, Gul A, Ahmedani MY, Masood Q (2010) Compliance to dietary counselling provided to patients with type 2 diabetes at a tertiary care hospital. J diabetol1: 5.
- Spikmans FJ, Brug J, Doven MM, Kruizenga HM, Hofsteenge GH, et al. (2003) Why do diabetic patients not attend appointments with their dietitian? J Hum Nutr Diet 16: 151-158.
- Krueter WM, Strecher VJ, Glassman B (1999) One size does not fit all: the case for tailoring print materials. Ann Behav Med 21: 276-283.
- Kreuter MW, Skinner CS (2000) Tailoring: what's in a name? Health Educ Res 15: 1-4.
- Brug J, Oenema A, Campbell M (2003) Past, present, and future of computer-tailored nutrition education. Am J ClinNutr 77: 1028S-1034S.
- Kroeze W, Werkman A, Brug J (2006) A systematic review of randomized trials on the effectiveness of computer-tailored education on physical activity and dietary behaviors. Ann Behav Med 31: 205-223.
- Probst YC, Faraji S, Betterham M, Steel DG, Tapsell LC (2008) Computerized dietary assessment compare well with interviewer administered diet histories for patients with type 2 diabetes mellitus in the primary healthcare setting. Patient EducCouns72: 49-55.
- McMahon GT, Gomes HE, HicksonHohne S, Hu TM, Levine BA, et al. (2005) Web-based care management in patients with poorly controlled diabetes. Diabetes Care 28: 1624-1629.
- Robertson C, Kattelmann K, Ren C (2007) Control of type 2 diabetes mellitus using interactive internet-based support on a northern Plains Indian reservation. Top ClinNutr 22: 185-193.
- Ralston JD, Hirsch IB, Hoath J, Mullen M, Cheadle A, et al. (2009) Web-based collaborative care for type 2 diabetes: a pilot randomized trial. Diabetes Care 32: 234-239.
- Tate DF, Jackvony EH, Wing RR (2003) Effects of internet behavioural counselling on weight loss in adults at risk for type 2 diabetes. JAMA-J Am Med Assoc 289: 1833-1836.
- Christian JG, Byers TE, Christian KK, Goldstein MG, Bock BC, et al. (2011) A computer support program that helps clinicians provide patients with metabolic syndrome tailored counselling to promote weight loss. J Am Diet Assoc 111: 75-83.
- Ministry of Health Malaysia (2005) National coordinating committee on food and nutrition (NCCFN): Recommended nutrient intakes for Malaysia (RNI). A report of the technical working group on nutritional guidelines. Kuala Lumpur, Ministry of Health, Malaysia.
- Malaysian Dietitians’ Association (MDA) (2005) Medical nutrition therapy guidelines for type 2 diabetes. Kuala Lumpur, Ministry of Health, Malaysia.
- Suzana S, Earland J,Suriah AR (2000) Validation of a dietary history questionnaire against a 7-D weighed record for estimating nutrient intake among rural elderly Malays. Malays J Nutr6: 33-34.
- Suzana S, Rafidah G, Noor Aini MY, NikShanita S, Zahara AM, et al. (2009) Atlas Makanan: SaizPertukarandanPorsi. (2nd Eds) Kuala Lumpur: MDC Publishers SdnBhd, Selangor, Malaysia.
- Norimah AK, Safiah M, Jamal K, SitiHaslinda, Zuhaida H, et al. (2008) Food consumption patterns: findings from the Malaysian Adult Nutrition Survey (MANS). Malays J Nutr14: 25-39.
- Tee ES, Ismail MN, MohdNasir A, Khatijah I (1997) Nutrient Composition of Malaysian Foods. (4th Eds) Kuala Lumpur: Institute for Medical Research.
- USDA website [Internet] (2011) United States of America: National Nutrient Database for Standard Reference.
- Naing NN (2007) A practical guide on determination of sample size in health sciences research. (1st Eds) Kota Bharu: PustakaAman Press Sdn, Bhd.
- Koev DJ, Tankova TI, Kozlovski PG (2003) Effect of structured group education on glycemic control and hypoglycemia in insulin-treated patients. Diabetes Care 26: 251.
- Watanabe M, Okayama A, Shimamoto K, Ueshima H (2007) Short-term, effectiveness of an individual counselling program for impaired fasting glucose and mild type 2 diabetes in Japan: A multi-centre randomised control trial. Asia Pac J ClinNutr 16: 489-497.
- Crawford D, Jeffery RW, French SA (2000) Can anyone successfully control their weight? Findings of a three year community-based study of men and women. Int J ObesRelatMetabDisord 24: 1107-1110.
- Yusof BN, Talib RA, Kamaruddin NA, Karim NA, Chinna K, et al. (2009) A low-GI diet is associated with a short-term improvement of glycaemic control in Asian patients with type 2 diabetes. Diabetes ObesMetab 11: 387-396.
- Weber JL, Reid PM, Greaves KA, DeLany JP, Stanford VA, et al. (2001) Validity of self-reported energy intake in lean and obese young women, using two nutrients databases, compared with total energy expenditure assessed by doubly labelled water. Eur J ClinNutr55: 940-950.
- Olivarius ND, Palmig B, Andreasen AH, Thorgersen JT, Hundrup C (2005) An educational model for improving diet counselling in primary care a case study of the creative use of doctor’s own diet, their attitudes to it and nutritional counselling of their patients with diabetes. Patient EducCouns 58: 199-202.
- Lim CJ, Suzana S, Hanis MY, Teh SC, Nor Shazwani MN, et al. (2010)Tahappengetahuanpemakanandankesedarankesihatan di kalanganpesakit diabetes mellitus di KlinikKesihatanCheras, Kuala Lumpur, Malaysia. Sains Malays 39: 505-511.
- Macdiarmid J, Blundell J (1998) Assessing dietary intake: Who, what and why of under-reporting. Nutr Res Rev 11: 231-253.
- Lemon CC, Lacey K, Lohse B, Hubacher DO, Klawitter B (2004) Outcomes monitoring of health, behaviour, and quality of life after nutrition intervention in adults with type 2 diabetes. J Am Diet Assoc104: 1805-1815.
- Turner RC, Cull CA, Frighi V, Holman RR (1999) Glycemic control with diet, sulfonylurea, metformin, or insulin in patients with type 2 diabetes mellitus: progressive requirement for multiple therapies (UKPDS 49). UK Prospective Diabetes Study (UKPDS) Group. JAMA 281: 2005-2012.

