Keywords
Effective treatment; EQ-5D-3 L; EQ-5D-5 L; Health state values; Health-related quality of life; Normality
Introduction
Various scales using standardized questionnaires, clinical examinations, observational methods, registers, secondary data, qualitative interviews, etc. are being used for assessment and diagnostic purposes in health disorders. There are a number of health-related quality of life (HRQoL) instruments like quality of life Index (QL -1) [1], Nottingham Health Profile (NHP) [2], European Quality of Life (EQ –5D), Medical outcome Study Short Form(SF–36) [3], WHO Disability Assessment Schedule (WHODASH) [4], etc. However, dimensions covered, numbers of items, method of scoring are different for different instruments and can influence sensitive and important areas like treatment effect, patient care, policy issues, etc. No agreed criteria for assessment of quality of life was observed and a 'health profile' was favoured which records the perceived health (or departures from health) of individuals or groups [2]. Thus, conceptual and methodological challenges are there regarding scoring of health profile for patient-reported preferences in health related quality of life(HRQoL) scale unlike the scales using summative scores of Likert type items. Analysis of data emerging from different scales of HRQoL depend significantly on nature of data, types of variables being assessed, admissibility of operations and hence, type of analysis are different if the measurement scales are nominal or ordinal/categorical or interval/ratio levels. Consideration of ordinal discrete data as interval or ratio data and application of techniques like correlation, regression, reliability analysis and inferences, without verification of associated assumptions of the techniques may lead to invalid and inconsistent findings.
The SF-36 for measuring health status consists of 36-items with different number of response categories (combination of “Yes-No” type, 3-point and 5-point Likert items) covering 8 sections viz. vitality, physical functioning, pain, general health perceptions, physical role functioning, emotional role functioning, social role functioning and mental health. Assuming equal weights to the items, raw scores are transformed to [0–100] by 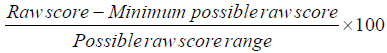 [3]. Here, minimum possible raw score vary across the sections due to different number of levels (response-categories). The SF-36 scores are the weighted sums of the questions in each of 8 sections. Lower score implies higher disability. Zero score means maximum disability and score of 100 means no disability.
Major limitations of SF - 36: Discrete Likert scores are not equidistant and strictly speaking, addition of Likert scores is not meaningful [5]. Summative Likert scoring generates a number of tied scores. Negative weights emerging from principal component analysis (PCA) indicate negative contribution of physical health scores in the combined mental health scores and vice versa i.e. for high score on combined mental health, one needs to have worse physical health and vice versa. It does not consider an important health variable called “sleep”.
Nottingham Health Profile (NHP) can be used to measure general perceived health status or specific conditions of ill-health. It consists of “Yes-No” type statements (38 in Part 1 covering six categories: sleep, physical mobility, energy, pain, emotional reactions, and social isolation and 7 in Part 2 on areas of life most affected by health: employment, household activities, social life, home life, sex life, hobbies and interests, and holidays). NHP can distinguish between physical and mental disorders [6]. Each NHP item is weighted and NHP scores ranging between 0 to 100 are calculated by averaging domain scores.
However, likemost profile measures, NHP does not provide relative-importance weightings across dimensions. As a result, it is difficult to compare the dimensions directly with one another or to evaluate change in pre- and post-intervention studies. Improvements for those with zero score in pre-administration cannot be observed. The scale consider only negative aspects of health and thus not able to assess positive feelings of well-being, as zero scores do not necessarily indicate a total absence of distress.
The WHODASII is a 36-item instrument to assess activity limitations and participationrestrictions in six domains namely understanding and communicating, getting around, self-care, getting along with people, life activities, and participation in society. WHODASII is based on an international classification of functioning (ICF) [7], which is the major difference of WHODASII from other measures of health status. Components of the first part of ICF “functioning and disability” are body functions and structures, activities and participation and the second part “contextual factors” include environmental factors and personal factors.
WHOQL 100 with 100 Likert items covering 6 dimensions namely Physical health, social relations, psychological health, environment, level of independence, and spirituality have been used primarily for assessing quality of life in adult psychiatric patients. Exploratory factor analysis(EFA) and also PCA revealed the existence of a fourfactor structure [8] who excluded four items due to their large deviations from prevailing skewness and/ or kurtosis criteria. HRQOL measures are designed to understand dysfunction and disability related to diseases, injuries, and health behaviors at an individual and community level [9]. Health-related quality of life (HRQoL) with 10 items is less useful to identify specific public health interventions. However, clinical measurements like time to first atrial fibrillation recurrence, concurrent stroke or symptoms and subjective measurements were poorly correlated [10]. Responsiveness of HRQoL instrument is difficult to assess.
EQ-5D-3L, EQ-5D-5L, EQ-5D-Y are generic patient reported outcomes (PRO) for evaluation of health state profile of a person. Brief features of the three instruments (https://euroqol.org/eq-5d-instruments/sample-demo/) are given in Table 1.
| Components |
Dimensions and scoring |
Remarks |
First Part
EQ-5D-3L |
Purpose: To evaluate health state profile of a person
5 dimensions: Mobility, Self-care, Usual activities, Pain & discomfort, Anxiety and depression, each with 3 levels marked as 1, 2 and 3 where “1” means no problem and “3” means extreme problems.
Number of health state (response categories) in each dimension: 3
Value set of a person in EQ-5D-3L is a 5 digit number, minimum being 11111(no problem in any dimension) and maximum 33333 (max. problem in each dimension). Total no. of health state is 35 |
A person’s score is categorical. It categorize a person in one of the possible 243 = 35categories. Frequency of each such category is admissible. Summative Likert score of value set 12345 and 54321 are equal and cannot differentiate health status of persons at different dimensions with a particular total score.
Three-level format has limitations in some clinical areas. EQ-5D-3L is less sensitive to small/ medium changes in health status [11] and thus less able to detect change in some conditions [12,13]. |
| EQ-5D-5L |
Purpose: To evaluate sensitivity of instrument and to provide opportunity to the persons for more detailed and accurate picture of their health.
5 dimensions: same as EQ-5D-3L, but with 5 levels from 1 to 5 where “1” reflects no problem and “5” denotes maximum problem.
Number of health state (response categories) in each dimension: 5
Value set of a person in EQ-5D-5L is a 5 digit number, indicating health-profile of the person.
Total no. of health state= 55 |
A person’s score is categorical. It indicates EQ-5D health states and categorize a person in one of the possible 3125 = 55 categories.
Frequency of each such category is admissible.
Likert scoring is not valid.
5L showed higher responsiveness than the 3L system [14,15,16]. |
| EQ-5D-Y |
More suitable questionnaire for children and adolescents. 5 dimensions are same as EQ-5D-3L, with modifications of the wording to suit the younger people. |
EuroQol Group published an international valuation protocol for the EQ-5D-Y[17]. EQ-5D-3L value sets should not be used to assign values to EQ-5D-Y health states [18] |
| Second Part |
Purpose: To obtain rating of persons’ overall health on the day of completing the questionnaire.
A standard vertical 20-cm Visual Analog Scale (VAS), with the end-points from ‘the worst health you can imagine’ (scored 0) to ‘the best health you can imagine’ (scored 100). It assumes that that length of the line from the bottom of the scale indicated by a subject is directly proportional to the perceived intensity of his/her disease. |
Limitations:
-VAS-scores may differ for horizontal or vertical line [19]
-Vertical scale showed less error than the horizontal scale for Chinese patients [20] but for English speakers,7% failure rate was found for vertical scale [21].
- Poor sensitivity fails to detect small change in disease and generated data can be misunderstood [22].
- More prone to measurement errors than a rating scale.
- For non-normal distribution of VAS score, suggested non-parametric tests have less power [23]. |
Table 1 Features of EQ-5D-3L, EQ-5D-5L, EQ-5D-Y.
The table highlights need to investigate methodological issues of scoring scales for health-state and properties of such scores along with their responsiveness, discriminating power, reliability, sensitivity (accuracy of the tool in identifying a problem), specificity (identification ofpersons without problems), etc.
The paper aims at suggesting alternate method of scoring value-sets emerging from EuroQol five-dimensional questionnaires without making any assumptions about distributions of dimension/level scores and satisfying desired properties and facilitating identification of priorities for treatment and application of statistical analysis under parametric set up. The proposed method can be same for scoring EQ-5D-5L, EQ-5D-3L and EQ-5D-Y.
Literature survey
A value set of EQ-5D-5L is a descriptive system showing pattern of health status of a person. Value set 12345 for the i-th person is different from 54321 for j-th person or any permutation of 1, 2, 3, 4 and 5. While 12345 indicate extremely poor health-state for the 5th dimension, the reverse is indicated by 54321 implying different clinical needs of the two persons. Thus, summative Likert scoring of dimensions is not valid since it fails to discriminate patients with a particular total score.
Addressing issues like health status of a sample and estimation for the population, comparisons between populations or one population across time, assessment of illness severity, identification of areas requiring priorities, etc. – it is needed to have a single numerical value of a value set. To obtain ‘index values’ or ‘index scores’ of EQ-5D, one needs to assign a numerical value to each EQ-5D health state spanning over 5 dimensions.
Various methods with different sets of assumptions have been proposed to assign numerical value to an EQ-5D state. Frequently used approaches are based on the time trade-off (TTO) for EQ-5D-3L or a combination of TTO and discrete choice experiments (DCE) for EQ-5D-3L. For economic evaluation, TTO based value sets are preferred and VAS value sets for non-economics investigations [11-24]. Results of index scores using these approaches are available for a number of countries/ regions (www.euroqol.org). However, methodology of assigning numerical values to value sets need to consider among others, the theoretical properties and empirical characteristics of the valuation methods and relevance in decision-making [25]. The authors suggested desirability of equality of assigned numerical numbers and the number of unique possible health profiles.
Example of calculation of value sets for EQ-5D-3L and EQ-5D-5L given by [25] can be questioned on soundness of central estimates of each dimension – level combination. Such calculations with censored data (fixed upper bound for 55555 and lower bound for 11111) may often lead to situations where variance is different at different range of values i.e. heteroskedasticity.
The EQ-5D value sets are to be obtained through representative sample of population so as to represent the societal perspective. Between EQ-5D-5L and EQ-5D-3L, the former was preferred for better measurement properties, reduced ceiling effect of the 3L in both general population and patient groups and higher discriminatory power [26].
Distribution of EQ-5D-3L value set usually result in undesirable gaps which tend to reduce sensitivity and accuracy of the instrument [26].The problem is less for EQ-5D-5L. In addition, non-satisfaction of normality and homoscedasticity condition may mislead the estimates.
To demonstrate presence of clusters in EQ-5D-3L and EQ-5D-5L distributions[27,28], used K-means clustering. One disadvantage of K-means clustering is requirement of fixing value of K first and deciding the stopping rule to find the optimal number of clusters. Normally, such technique does not specify measure of effectiveness of clustering. Efficiency of the two EQ-5D classification systems was evaluated by Shannon’s index 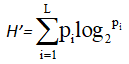 where L denotes number of levels (3 for 3L and 5 for 5L) and pi is proportion of observations in the i-th level (i = 1, …, L) [29]. However, other measures of classification efficiency considering distance between clusters and similarity within a cluster merits consideration.
Discriminating power of EQ-5D-5L or EQ-5D-3L was found in terms of F-statistics derived from the analysis of variance (ANOVA) tests of the two EQ-5D scores between participants with and without a health condition [30]. Assumptions of F-test include normally distributed data and samples are independent from one another. Prior verification of such assumptions is needed to use F-statistics. It is desirable to find discriminating value of a scale without considering any reference scale. Seven dissimilarity measures of discriminating value were compared, and Coefficient of Variation (CV) had maximum theoretical advantages [31]. Denoting discriminating value of the i-th item/dimension as  and test discriminating value as
  , for a test with m-items/dimensions, the author established that Cronbach alpha can be expressed by
  Cronbach a is popular to estimate reliability of an instrument from a single administration. Test-retest reliability will be high if health profiles and/or disease-intensity remain unchanged (i.e. no effect of treatment/care) during the period of time-gap. Cronbach a assumes among others continuous data, uncorrelated errors, normality, unidimensionality, etc. If number of eigen-values exceeding 1 is 2 or more implying departure from uni-dimensionality, Cronbach α should not be used.
For two different instruments X and Y, criterion validity of X is reported as correlation between X and Y (rXY ). However, rXY may reflect validity of Y also. In addition, the approach assumes similarity of latent variables being measured by X and Y and administration of both X and Y to the same sample. To avoid such problems, structural validity of transformed scores by EFA followed by confirmatory factor analysis (CFA) along with checking of measurement invariance across type of causes of disease using multigroup CFA was preferred [32]. Conducting EFA and the CFA on the same sample pool has been widely used in validation studies [33].
Comparison between 5L and 3L:
- 5 L was more responsive than 3 L and has similar or higher test-retest reliability [11].
- Discriminating power of EQ-5D-5Lexceeded the same for EQ-5D-3L in patients with type 2 diabetes mellitus (T2DM) [29].
- 5L is more sensitive than 3L in patient populations but not in general adult population.
Thus, findings of relative performance of the two instruments in one population cannot be generalized to other populations.
Proposed methods
Converting EQ-5D health profiles into numerical values can be done by assigning weights to each health state under each dimension and express health score of a person as weighted sum where positive weights Wij's for the i-th dimension and j-th level

However, the above was not satisfied by mapping between EQ-5D-3L value sets and EQ-5D-5L descriptive system involving 3,691 subjects (each completed both the 3L and 5L versions) in six countries and implementation of screening protocol so as to capture a broad spectrum of levels of health across the dimensions of EQ-5D for both the 5L and 3L versions [34].
Suppose EQ-5D-5L has been administered to n-persons where fij > 0 denotes frequency of the j -th level (response category) of the i-th dimension. The emerging data can be summarized as given in Table 2.
| Dimension |
Proportion of responses to each Level |
Total of proportions |
| |
Level 1 |
Level 2 |
Level 3 |
Level 4 |
Level 5 |
| 1 |
 |
 |
 |
 |
 |
1 |
| 2 |
 |
 |
 |
 |
 |
1 |
| 3 |
… |
… |
|
|
… |
|
| 4 |
… |
… |
|
|
… |
|
| 5 |
 |
… |
… |
… |
 |
1 |
| Total |
 |
 |
… |
… |
 |
1 |
Table 2 Data-driven weights (p_ij's) to Dimension-level combinations.
The data-driven weights as illustrated above can be used to assign numerical values to health profile of a person as weighted sum. For example, EQ-5D profile of 12345 can be expressed as an expected value  which is different from 54321
  . Following similar approach, dimension score of each dimension can also be obtained.
Observations:
• Score of i-th person in 5L denoted by Yi5L is in terms of expected values which is continuous.
Yi5L is additive since  where X and Y are independent and the persons can be taken as independent.
Possible to find mean, variance of Y5L and correlations matrix of dimensions for a sample
Y5L can be standardized to follow N (0,1) by 
To avoid negative values, Zi may be transformed to proposed score Pi to have a score range [1,100] by the following linear transformation

Methodology of Y5L scores and P-scores may be uniform for EQ- 5D-5L, EQ-5D-3L and EQ-5D-Y
Limitations: Y5L values and hence P-scores depend heavily on the sample. If the sample consists of predominantly healthy persons, health-state patterns will be tilted towards high weights for level 1 and 2. The method may work best for sample of patients suffering from same disease like
Breast Cancer, Colorectal Cancer, Lymphoma, Melanoma, etc. where homogeneity of treatment and related factors during the follow-up periods can be assumed.
Benefits:
• The proposed continuous Pi score having a score range between 1 and 100 following normal distribution can be taken as a measure of disease severity.
• Conversion of health profiles from EQ-5D-5L to continuous P-scores with normality avoids the problem of interpretation of added/subtracted variables.
• Normality of continuous variable Pi ensures that scores are not skewed and enables calculation of all descriptive statistics and also undertake relevant analysis used in multivariate statistical inferences under parametric set-up viz. estimation of population mean and variance. testing of hypothesis of equality of mean of P-scores of two populations or one population across time.
• Treatments/cares may be taken as effective, in case of rejection of the null hypothesis
 where pre-treatment group and post-treatment group constitute the two populations which are not independent.
Relationship can be established between EQ-5D-5L and EQ-5D- 3L. To fit relationship of the form  one can test
  against
  .
.
A group of persons can be ranked with respect to Y-score or P-scores
Percentage of progress or deterioration made by the i-th patient in t -th time-period in comparison to the previous time-period can be assessed by  where Pit denotes P-score (severity) of the i-th patient in t-th time period. Thus, the ratio
  reflects responsiveness of the scale and evaluate effectiveness of a treatment plan.
The ratios for t = 2,3,…..and so on, help to draw pathof improvement/decline of one or a group of patients which may facilitate drawing useful conclusions including better prognostication.
Reliability of a dimension (rtt(i)) can be found as correlation between the dimension score and total score (analogous to item-total correlation). Avoidinguni-dimensionality assumption of Cronbach alpha,questionnaire/testreliability can be expressed as a function of item reliabilities as follows [35]:
 (2)
(2)
where SXi denotes sample SD of the i-th item.
Classification:
Y5L score corresponding to minimum EQ-5D profile of 11111 is  and the same corresponding to maximum EQ-5D profile of 55555 is
  . Call
as DY(Max - Min). Divide DY(Max - Min) into four or five equal parts and generate boundary points for classification of persons in 4 to 5 mutually exclusive classes i.e. quartile or pentile clustering. The cut-off point (Y0) indicates that persons with scores ≤Y0 are normal and persons with scores >Y0 are taken to be suffering from health disorder. However, efficiency of classification by boundary points and/or cut-off scores, need to be measured in terms of similarity within class and dissimilarity between classes. Davies-Bouldin Index (DBI) [36] is a frequently used measure of efficient classification [37]. Computation of DBI for K-classes requires calculation of mean, variance, maximum and minimum value for each class and uses them to the definition of DBI as  where diameter of a cluster/class is defined as:
where ni: Number of members in the i-th class and Ci: Centroid (or mean) of i-th cluster
Upper limit of DBI is 1 and lower value implies better efficiency.
DBI for K=2 will reflect goodness of the cut-off point.
However, implications of classifications are required to be tested from clinical point of view.
Empirical illustration
The proposed method of scoring EQ-5D-5L value sets is illustrated with a hypothetical data involving 5-dimensions, each having 5-levels, and a sample size of 100.
Calculations of weights to different levels of different dimensions are shown in Table 3.
| Dimension |
Level 1 |
Level 2 |
Level 3 |
Level 4 |
Level 5 |
Total |
| 1 |
Freq.= 4 |
10 |
7 |
34 |
45 |
100 |
| Weights= 0.04 |
0.10 |
0.07 |
0.34 |
0.45 |
1 |
| 2 |
Freq.= 43 |
25 |
11 |
13 |
8 |
100 |
| Weights=0.43 |
0.25 |
0.11 |
0.13 |
0.08 |
1 |
| 3 |
Freq.= 27 |
31 |
10 |
18 |
14 |
100 |
| Weights= 0.27 |
0.31 |
0.10 |
0.18 |
0.14 |
1 |
| 4 |
Freq.= 5 |
12 |
10 |
31 |
42 |
100 |
| Weights= 0.05 |
0.12 |
0.10 |
0.31 |
0.42 |
1 |
| 5 |
Freq.= 12 |
14 |
11 |
27 |
36 |
100 |
| Weights= 0.12 |
0.14 |
0.11 |
0.27 |
0.36 |
1 |
Table 3 Empirical weights.
Y-score of persons can be calculated as weighted sum using the weights given in the Table 1 avoiding tied scores. For example, Y5Lscores of five persons, each with Likert score of 20 are shown in Table 4.
| Health state |
Dim 1 |
Dim 2 |
Dim 3 |
Dim 4 |
Dim 5 |
Summative
Likert Score |
Y5L scores |
| 44255 |
4 |
4 |
2 |
5 |
5 |
20 |
6.40 |
| 53255 |
5 |
3 |
2 |
5 |
5 |
20 |
7.10 |
| 52454 |
5 |
2 |
4 |
5 |
4 |
20 |
6.65 |
| 25355 |
2 |
5 |
3 |
5 |
5 |
20 |
4.80 |
| 42455 |
4 |
2 |
4 |
5 |
5 |
20 |
6.48 |
Table 4 Illustrative Y5L scores of persons with equal summative score.
Thus, Y5L score considering different weights to different levels of different dimensions resulted in breaking ties of summative Likert scores and distinguished the persons with same summative score on the basis of how the score was obtained. In other words, Y5Lscore provides unique numerical score to health profile of each subject.
Descriptive statistics: Mean, variance and coefficient of variation (CV) of Y5L score and corresponding P-score are shown in Table 5.
| Description |
Y5L score |
P-score |
| Score range: |
1.40 to 7.35 |
1 to 100 |
| Mean |
4.8419 |
49.50999 |
| Variance |
1.9539 |
667.4648 |
 |
0.288692 |
0.521821 |
| Inter quartile distance (Q3-Q1) |
1.9375 |
29.25001 |
Number of outliers
(belowQ1− 1.5(IQR) or above Q3 + 1.5 (IQR) |
Nil |
Nil |
| Correlation between Y5L score and P-score |
0.991193 |
Table 5 Descriptive statistics.
Observations:
• High range of P-scores resulted in higher values of mean and variance
• Y5Lscore with smaller CV is less dispersed than the P-scores with higher CV.
• The interquartile range (IQR) measured by Q3 - Q1 is a measure of variability, based on dividing a data set into quartiles. Lower value of IQR and variance of Y5Lscore reflect data consistency.
No outliers were observed for the Y5Lscore. P-scores  obviously had no outliers. However, distribution of Y5Lscore was not symmetric since its mode was 6.4 against mean of 4.84.
P-scores derived from Y5L score through linear transformations were highly correlated, as expected.
However, P-scores resulted in more number of tied scores in comparison to a few tied scores by Y5L scores.
Correlations among dimensions:
Y5Lscores were computed separately for each of the five dimension. Mean, SD and CV for the dimensions are given in Table 6.
| Description |
Dim 1 |
Dim 2 |
Dim 3 |
Dim 4 |
Dim 5 |
| Mean |
1.5112 |
0.448 |
0.5229 |
1.3277 |
1.0295 |
| SD |
0.797986 |
0.056586 |
0.192324 |
0.766802 |
0.671303 |
| CV |
0.528048 |
0.126309 |
0.367802 |
0.577542 |
0.652067 |
Table 6 Dimension-wise descriptive statistics of Y5L scores.
Dimension score as weighted sum had different data variability.
Dimension reliability:
Reliability of a dimension could be taken as its correlation to total Y5Lscores. The Table 7 gives dimension -total correlations for Y5Lscores.
| |
Dim 1 |
Dim 2 |
Dim 3 |
Dim 4 |
Dim 5 |
Total  scores scores |
| Dim 1 |
1 |
0.10855 |
0.01234 |
0.05797 |
0.23420 |
0.69272 |
| Dim 2 |
|
1 |
0.01335 |
0.05856 |
-0.04499 |
0.11612 |
| Dim 3 |
|
|
1 |
0.05735 |
0.05130 |
0.22017 |
| Dim 4 |
|
|
|
1 |
-0.12656 |
0.51123 |
| Dim 5 |
|
|
|
|
1 |
0.55566 |
Table 7 Correlation Matrix of dimension scores and total Y5L score.
Poor correlations between a pair of dimensions tend to indicate that dimensions were independent. However, this may be checked by PCA. Except dimension 2 and 3, other dimensions were found to have reliability exceeding 0.5
Reliability of the instrument with scoring system using equation (2) was as high as 0.98.
Conclusions
A simple method of numerical scoring of value-sets emerging from EuroQol five-dimensional questionnaires is proposed. Data driven weights are assigned to different levels of different dimensions and continuous scores (Y5L) corresponding to a health state are obtained as weighted sum. Y5L -scores are further transformed by linear transformations to P-scores ∈ [1,100] is normally distributed. P-scores can be taken as a measure of disease severity.The approach makes no assumption about distributions of dimension/level scores and satisfies many desired properties and application of statistical analysis under parametric set up.
The proposed method of scoring can be uniform for EQ-5D-5L, EQ-5D-3L and EQ-5D-Y.
Benefits of the proposed method include:
• Testing effectiveness of treatments/cares by testing  by paired t-test since pre-treatment group and post-treatment group are not independent.
• Fitting relationship between EQ-5D-5L and EQ-5D-3L.
• Classifying and ranking of a group of persons
Quantifying progress or deterioration made by the i-th patient in t -th time-period in comparison to the previous time-period by where Pit denotes P-score of the i-th patient in t-th time period. The ratio reflects responsiveness of the scale and effectiveness of a treatment plan for better prognostication.
Facilitating computation of reliability of a dimension and questionnaire avoiding uni-dimensionality assumption of Cronbach alpha.
Illustration of the proposed method of scoring health states and its properties are given with a hypothetical data. Future studies with real life data are suggested on psychometric properties of the scoring system proposed.
Acknowledgement: Nil
Funding Details: Nil
Conflict of Interests: No potential conflict of interest is reported.
38416
References
- Spitzer WO, Dobson AJ, Hall J, Chesterman E, Levi J, et al. (1981) Measuring the quality of life of cancer patients: A concise QL-index for use by physicians. J Chronic Dis 34: 585–597.
- Hunt SM, McEwen J, McKenna SP (1985) Measuring health status: a new tool for clinicians and epidemiologists. J R Coll Gen Pract 35: 185–188.
- Ware JE, Sherbourne CD (1992) The MOS 36-item shortform health survey (SF-36). A. Conceptual framework and item selection. Medical Care 30: 473–483.
- World Health Organization (2000) World Health Organization Disability Assessment Schedule (WHODASII). Training Manual: a guide to administration. Geneva: WHO.
- BastienCH, Vallieres A, Morin CM (2001) Validation of the Insomnia Severity Index as an outcome measure for insomnia research. Sleep Med2: 297–307.
- McDowell I, Martini CHM, Waugh W (1978) A method for self-assessment of disability before and after hip replacement operations. Br Med J 2: 875-879.
- World Health Organization (2001) International Classification of Functioning, Disability and Health: ICF. Geneva: WHO.
- Masthoff ED, Trompenaars FJ, van Heck GL, Hodiamont PPG, de Vries J (2005) Validation of the WHO Quality of Life assessment instrument (WHOQOL-100) in a population of Dutch adult psychiatric outpatients. European Psychiatry 20: 465-473.
- Centers for Disease Control and Prevention (2000) Measuring Healthy Days: Population Assessment of Health-Related Quality of Life, Atlanta, Georgia: CDC.
- Badia X, Arribas F, Ormaetxe JM, Peinado R, de Los Terrero MS (2007) Development of a questionnaire to measure health-related quality of life (HRQoL) in patients with atrial fibrillation (AF- QoL). Health Qual Life Outcomes 5: 37.
- Herdman M, Gudex C, Lloyd A, Janssen M, Kind P, et al. (2011) Development and preliminary testing of the new five-level version of EQ-5D (EQ-5D-5L). Qual Life Res 20:1727-1736.
- Payakachat N, Ali MM, Tilford JM (2015) Can The EQ-5D Detect Meaningful Change? A Systematic Review. Pharmacoeconomics 33:1137-1154.
- Hounsome N, Orrell M, Edwards RT (2011) EQ-5D as a quality of life measure in people with dementia and their carers: evidence and key issues. Value Health 14:390-399.
- Jin X, Al Sayah F, Ohinmaa A, Marshall DA, Johnson JA (2019) Responsiveness of the EQ-5D-3L and EQ-5D-5L in patients following total hip or knee replacement. Qual Life Res28:2409-2417.
- Bilbao A, García-Pérez L, Arenaza JC, García I, Ariza-Cardiel G, et al. (2018) Psychometric properties of the EQ-5D-5L in patients with hip or knee osteoarthritis: reliability, validity and responsiveness. Qual Life Res 27:2897-2908.
- Nolan CM, Longworth L, Lord J, Canavan JL, Jones SE, et al. (2016) The EQ-5D-5L health status questionnaire in COPD: validity, responsiveness and minimum important difference. Thorax 71:493-500.
- Ramos-Goñi JM, Oppe M, Stolk E, Shah K, Kreimeier S, et al. (2020) International Valuation Protocol for the EQ-5D-Y-3L. Pharmacoeconomics 38:653-663.
- Kreimeier S, Oppe M, Ramos-Goni JM, Cole A, Devlin N, et al. (2018) Valuation of EuroQol Five-Dimensional Questionnaire, Youth Version (EQ-5D-Y) and EuroQol Five-Dimensional Questionnaire, Three-Level Version (EQ-5D-3L) Health States: The Impact of Wording and Perspective, Value in Health 21: 1291-1298.
- Ogon M, Krismer M, Sollner W, Kantner-Rumplmair W, Lampe A (1996) Chronic low back pain measurement with visual analogue scales in different settings. Pain64: 425–428.
- Aun C, Lam, YM, Collett B (1986) Evaluation of the use of visual analogue scale in Chinese patients. Pain25: 215–221.
- Scott J, Huskisson EC (1979) Vertical or horizontal visual analogue scales. Ann Rheum Dis 38: 560.
- WilliamsonA, Hoggart B (2005) Pain: a review of three commonly used pain rating scales. J Clin Nurs 14: 798–804.
- Dexter F, Chestnut DH (1995) Analysis of statistical tests to compare visual analog scale measurements among groups. Anesthesiology82: 896–902.
- KindP (2003) Guidelines for value sets in economic and non-economic studies using EQ-5D. In: Brooks R, Rabin R, de Charro F (editors) The measurement and valuation of health status using EQ-5D: a European perspective. Kluwer Academic Publisher, Dordrecht, pp: 29–41.
- Devlin N, Parkin D, Janssen B (2020) Analysis of EQ-5D Values. In: Methods for Analysing and Reporting EQ-5D Data. Springer, Cham.
- Janssen MF, Pickard AS, Golicki D, Gudex C, Niewada M, et al. (2012) Measurement properties of the EQ-5D-5L compared to the EQ-5D-3L across eight patient groups: A multi-country study. Qual Life Res 22:1717-1727.
- Parkin D, Devlin N, Feng Y (2016) What determines the shape of an EQ-5D index distribution? Med Decision Making36:941–951.
- Feng Y, Devlin N, Bateman A, Zamora B, Parkin D (2019) Distribution of the EQ-5D-5L Profiles and Values in Three Patient Groups. Value Health 22:355–361.
- Wang P, LuoN, Tai ES, Thumboo J (2016) EQ-5D-5L is More Discriminative Than the EQ-5D-3L in Patients with Diabetes in Singapore. Value Health Reg Issues 9: 57–62.
- You R, Liu J, YangZ,Pan C, Ma Q, et al. (2020) Comparing the performance of the EQ-5D-3 L and the EQ-5D-5 L in an elderly Chinese population. Health Qual Life Outcomes 18: 97.
- Chakrabartty SN (2020) Discriminating Value of Item and Test. International Journal of Applied Mathematics and Statistics 59: 61-78.
- Chakrabartty SN (2020) Improved Quality of Pain Measurement. Health Science1: 1-6.
- Dawes J (2002) Five point vs. eleven point scales: does it make a difference to data characteristics? Australasian Journal of Market Research10: 39-47.
- van Hout B, Janssen MF, Feng YS, Kohlmann T, Busschbach J, et al. (2012) Interim Scoring for the EQ-5D-5L: Mapping the EQ-5D-5L to EQ-5D-3L Value Sets. Value Health 15: 708-715.
- Chakrabartty SN (2019) Limitations of Insomnia Severity Index and Possible Remedies. JSM Neurol Disord Stroke 5: 1-9.
- Davies D, Bouldin W (1979) A cluster separation measure, IEEE Transactions on Pattern Analysis and Machine Intelligence 1: 224-227.
- Kim M, Ramakrishna RS (2005) New indices for cluster validity assessment. Pattern Recognition Letters 26: 2353–2363.

