Keywords
Type 2 Diabetes mellitus, Insulin, Hyperglycemia
Introduction
Type 2 Diabetes mellitus (T2DM) is a chronic disease characterized as hyperglycemia in the context of insulin resistance. Rates of T2DM have accelerated markedly since 1960, becoming a global epidemic recognized by the World Health Organization (WHO) [1,2]. With symptoms of excess thirst, frequent urination and constant hunger, T2DM is associated with a ten-year-shorter life expectancy [3]. In T2DM patients, failed response of cells to normal insulin level causes insulin resistance, which triggers liver inappropriately releases glucose into the blood [4]. Evidences have shown that deregulated insulin pathway is the major contributor in insulin resistance [5,6]. Tyrosine-protein phosphatase nonreceptor type 1 (PTPN1) negatively regulates insulin signaling pathway by dephosphorylating the phosphotyrosine residues of the activated insulin receptor kinase [7,8]. PTPN1 is considered a promising therapeutic target for the treatment of T2DM [9].
Initially, Bowden et al. observed evidence for association of the PTPN1-containing chromosomal region with T2DM [10], which has led scientists to evaluate the PTPN1 gene for association with T2DM. Efforts have been made to identifying T2DM associated single nucleotide polymorphisms (SNPs) of PTPN1, whereas the inconsistent and controversial results make linkages of these SNPs with T2DM remain inconclusive [11-17]. To evaluate the correlation between PTPN1 genetic polymorphism and T2DM susceptibility, a meta-analysis was performed to systematically review the published studies focusing on associations of PTPN1 SNPs and T2DM.
Methods
Literature searching strategy
In order to get as many relative studies as possible, extensive literature searching in PubMed and CNKI was performed without language restriction using key words "PTPN1'' or "PTPN1B " in combination with "SNP" or "Single Nucleotide Polymorphism" or/and "T2DM" or "Type 2 Diabetes". The last research was conducted on June 15, 2015. Reference list of selected citations were also checked for any eligible studies left behind.
Inclusion and exclusion criteria
Eligible studies were selected according to the following criteria: full text case-control studies; investigating the association between PTPN1 SNPs and clinically diagnosed T2DM, not insulin resistance phenotypes or impaired glucose tolerance; SNPs distribution within Hardy-Winberg equilibrium (HWE); providing detail genotype frequencies. The eligibility of each citation was performed by two reviewers independently according to the inclusion criteria.
Data extraction
The following data was extracted from each eligible study: name of the first author, publication year, country where the study was carried out, ethnicity, genotyping method, origin of control, genotyped SNPs, HWE, number of cases and controls, number of different genotypes in cases and controls. Data extraction was conducted by two reviewers independently.
Statistical analysis
The association strength between PTPN1 SNPs and T2DM susceptibility was measured by odds ratio (OR) with 95% confidence intervals (95% CI). The pooled ORs were obtained by random effects meta-analysis in allele (2 vs 1), heterozygote (12 vs 11), homozygote (22 vs 11), dominant (12+22 vs 11), and recessive model (22 vs 12+11) [18], respectively (2 represents minor allele). Influence analyses were conducted to determine the effect of individual study on pooled results and test the reliability of results [19]. I-squared was used to indicate the proportion of heterogeneity between studies in total variation. Meta-regression was performed to detect the source of heterogeneity [20] For meta-regression analysis, the genotyping methods were divided into two groups: sophisticated instrument aided (SIA) (metrix-assisted laser desorptio ionization-time of flight mass spectroscopy using a sequenom platform, SNPLexTM, or SNaPshot) and non- SIA (RFLP or Bi-PASA PCR); origins of control were classified into sex and age matched and non-sex and age matched; sample size was grouped into two: <1000 and >1000 subjects. Publication bias was detected with Begg's and Egger's test [21] and p<0.05 was considered significant. All the statistical analysis was performed with STATA software.
Results
Characteristic of eligible studies
We identified 13 case-control datasets from 8 citations [11-18] (Figure 1). Characteristics of the eligible datasets were summarized in Table 1 and Supplementary Table 1. Only one study was performed in Chinese Han population, whereas the rest were studies of Caucasian. Most of the citations were published in English, the rest two were published in Chinese and Spanish. T2DM cases were diagnosed using oral glucose tolerance test (OGTT) with the criteria of WHO. Blood samples were used for DNA extraction and genotyping in all studies. HWE distribution of genotypes was tested for all SNPs and most of them were in consistent with HWE except for rs914458(C>G) reported by Cheyssac et al. [13] and rs4811078 and rs2426158 reported by Bento et al. [22] SNPs deviated from HWE were excluded from meta-analysis. Twenty two PTPN1 SNPs were studied among these datasets.
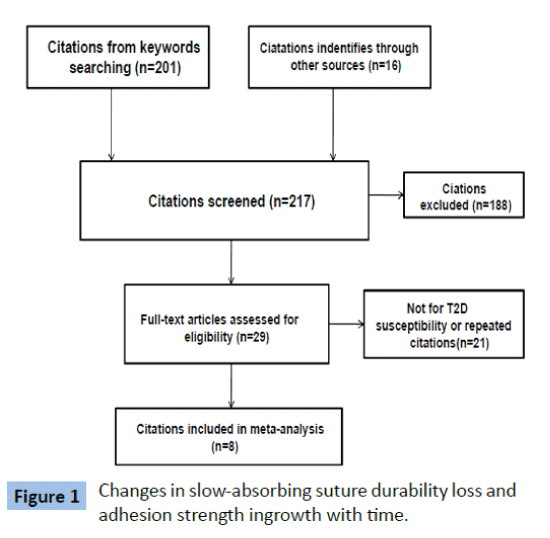
Figure 1: Changes in slow-absorbing suture durability loss and adhesion strength ingrowth with time.
| Author |
Location/Ethnicity |
Cases/Controls |
SNPs studied |
Genotyping Method |
HWE |
Gender |
Diagnostic Method of Diabetes |
| Anaya et al. [16] |
Peru/Peruvian |
93/123 |
rs914458(C>G) |
PCR and ABI Prism 310 |
Yes |
Mixed |
Diagnosed from hospital |
| Bodhini et al. [11] |
India/Indian |
262/249 |
rs941798(A>G)
rs3787345(T>C)
rs2230604(C>T)
rs2282147(C>T)
rs718049 T>C)
rs718050(G>A)
rs1689673(148insG) |
PCR-RFLP |
Yes |
Mixed |
Fasting plasma glucose>=7mmol/L or 2 h postglucose value>=11.1 mmol/L |
| Ding et al. [17] |
China/Han population |
108/102 |
rs2230605(A>G) |
Bi-PASA PCR |
Yes |
Mixed |
Fasting blood-glucose>=7.8mmol/L, 2h OGTT>= 11.1 mmol/L |
| Traurig et al. [12] |
India/Pima Indian |
573/464 |
rs2282147(C>T)
rs718050(G>A)
rs6020546(C>T)
rs718630(T>G)
rs3787335(T>G)
rs1570179(C>T)
rs754118(C>T)
rs968701(A>G)
rs3787348(G>T) |
SNPlex |
Yes |
Mixed |
OGTT using the criteria of the WHO |
| Małodobra et al. [18] |
Poland/Polish |
48/50 |
rs1689673(148insG) |
PCR SNaPshot |
Not mentioned |
Mixed |
|
| Cheyssac et al. [13] |
France/French |
325/311 |
rs941798(A>G)
rs3787345(T>C)
rs718050(G>A)
rs3787335(T>G)
rs1570179(C>T)
rs754118(C>T)
rs914458(C>G)
rs6020563(T>G)
rs6126033(C>T)
rs2426159(A>G) |
SNPlex |
Yes
Except rs914458 |
Mixed |
Fasting plasma glucose>=7 mmol/L; or treatment by antidiabetic agents and IGF as as fasting plasma glucose between 6.2-6.9 mmol/L |
| Cheyssac et al. [13] |
France/French |
902/736 |
rs941798(A>G)
rs3787345(T>C)
rs718050(G>A)
rs3787335(T>G)
rs1570179(C>T)
rs754118(C>T)
rs914458(C>G)
rs6020563(T>G)
rs6126033(C>T)
rs2426159(A>G) |
SNPlex |
Yes
Except rs914458 |
Mixed |
Fasting plasma glucose>=7 mmol/L; or treatment by antidiabetic agents and IGF as as fasting plasma glucose between 6.2-6.9 mmol/L |
| Bento et al. [14] |
USA/American |
575/510 |
rs941798(A>G)
rs3787345(T>C)
rs2282147(C>T)
rs718049(T>C)
rs718050(G>A)
rs1689673(148insG)
rs754118(C>T)
rs3787348(G>T) |
|
Yes except rs4811078 and rs2426158 |
Mixed |
Not mentioned |
| Florez et al. [15] |
USA/Scandinavia |
471/471 |
rs2230605(A>G)
rs941798(A>G)
rs3787345(T>C)
rs2230604(C>T)
rs2282147(C>T)
rs718049(T>C)
rs718050(G>A)
rs6020546(C>T)
rs718630(T>G)
rs754118(C>T)
rs968701(>-G)
rs3787348(G>T)
rs914458(C>G)
rs6067484(A>G)
rs6020594(A>G)
P387L(T>C)
1484insG(O>G) |
metrix-assisted laser desorptio ionization-time of flight mass spectroscopy using a sequenom platform |
Yes |
Mixed |
OGTT |
| Florez et al. [15] |
USA/Sweden |
514/514 |
Same as above |
Same as above |
Yes |
Mixed |
OGTT |
| Florez et al. [15] |
USA/GCI U.S. |
1226/1226 |
Same as above |
Same as above |
Yes |
Mixed |
OGTT |
| Florez et al. [15] |
USA/GCI Poland |
1009/1009 |
Same as above |
Same as above |
Yes |
Mixed |
OGTT |
| Florez et al. [15] |
USA/Canada |
127/127 |
Same as above |
Same as above |
Yes |
Mixed |
OGTT |
| Total |
|
6233/5892 |
|
|
|
|
|
Table 1: Characteristics of the eligible studies.
Meta-analysis results
For most of these SNPs, meta-analysis was performed in allele, heterozygote, homozygote, dominant, and recessive model, respectively, whereas only allele and/or heterozygote model were conducted for those SNPs without homozygote cases (Supplementary Table 2). We observed increased risk of T2DM susceptibility to rs2230605 (A>G) (A vs G : OR 1.13, 95% CI 0.72- 1.78; AG vs AA: 1.17, 0.72-1.91), and rs1689673(1484insG) (G vs O: 1.07, 0.93-1.25) (Table 2). Mild positive associations with T2DM incidence were found in rs3787345(T>C), rs6020594(A>G) (Table 2). Interestingly, some SNPs were found to be reversely correlated with T2DM susceptibility. Strong reverse correlation with T2DM was observed in rs2230604(T vs C: OR 0.90, 0.80-1.00; CT vs CC: OR 0.90, 0.80-1.02; TT vs CC: OR 0.74, 0.47-1.16; CT+TT vs CC: OR 0.89, 0.79-1.00; TT vs CT+CC: OR 0.76, 0.48-1.20) and rs6126033(T vs C: OR 0.86, 0.64-1.16; CT vs CC: OR 0.87, 0.66-1.14; TT vs CC: OR 0.85, 0.24-3.04; CT+TT vs CC: OR 0.86, 0.64-1.15; TT vs CT+CC: OR 0.86, 0.24-3.09) (Table 3). Relatively mild reverse associations with T2DM incidence were found for rs718049(T>C), rs718050(G>A), rs6020546(C>T), and rs718630(T>G) (Table 2). No obvious associations with T2DM susceptibility were observed for the rest SNPs.
| SNP |
Model type |
Number of datasets |
OR |
95% CI |
I-squared |
ph |
| rs2230605(A>G) |
Allele (G/A) |
4 |
1.13 |
[0.72-1.78] |
58.00% |
0.067 |
| Heterozygote (AG/AA) |
1.17 |
[0.72-1.91] |
55.10% |
0.083 |
| rs1689673(148insG) |
Allele (G/O) |
8 |
1.07 |
[0.93-1.25] |
26.20% |
0.22 |
| Heterozygote(OG/OO) |
1.02 |
[0.89-1.17] |
0.00% |
0.693 |
| rs6020594(A>G) |
Allele (G/A) |
5 |
1.03 |
[0.67-1.58] |
56.20% |
0.058 |
| Heterozygote (AG/AA) |
1.03 |
[0.68-1.56] |
53.20% |
0.074 |
| rs3787345(T>C) |
Allele (C/T) |
10 |
1.03 |
[0.95-1.11] |
40.60% |
0.087 |
| Heterozygote (TC/TT) |
1.01 |
[0.92-1.10] |
0.00% |
0.504 |
| Homozygote (CC/TT) |
1.05 |
[0.92-1.21] |
30.70% |
0.163 |
| Dominant (TC+CC/TT) |
1.02 |
[0.92-1.13] |
26.40% |
0.201 |
| Recessive (CC/TC+TT) |
1.05 |
[0.96-1.14] |
0% |
0.444 |
Table 2: Meta-analysis results for SNPs prone to T2DM.
| SNP |
Model type |
Number of datasets |
OR |
95% CI |
I-squared |
p |
| rs2230604(C>T) |
Allele (T/C) |
6 |
0.90 |
[0.80-1.00] |
0.00% |
0.857 |
| Heterozygote (CT/CC) |
0.90 |
[0.80-1.02] |
0.00% |
0.893 |
| Homozygote (TT/CC) |
0.74 |
[0.47-1.16] |
0.00% |
0.99 |
| Dominant (CT+TT/CC) |
0.89 |
[0.79-1.00] |
0.00% |
0.848 |
| Recessive (TT/CT+CC) |
0.76 |
[0.48-1.20] |
0% |
0.994 |
| rs718049(T>C) |
Allele (C/T) |
7 |
0.92 |
[0.84-1.00] |
41.40% |
0.115 |
| Heterozygote (TC/TT) |
0.93 |
[0.84-1.02] |
0.00% |
0.603 |
| Homozygote (CC/TT) |
0.84 |
[0.71-1.01] |
36.70% |
0.149 |
| Dominant (TC+CC/TT) |
0.90 |
[0.81-1.01] |
24.90% |
0.239 |
| Recessive (CC/TC+TT) |
0.95 |
[0.84-1.06] |
0% |
0.943 |
| rs718050(G>A) |
Allele (A/G) |
10 |
0.94 |
[0.88-1.00] |
22.70% |
0.234 |
| Heterozygote (GA/GG) |
0.94 |
[0.87-1.02] |
0.00% |
0.841 |
| Homozygote (AA/GG) |
0.89 |
[0.79-1.01] |
9.90% |
0.352 |
| Dominant (GA+AA/GG) |
0.93 |
[0.86-1.01] |
0.00% |
0.514 |
| Recessive (AA/GA+GG) |
0.93 |
[0.84-1.02] |
0% |
0.54 |
| rs6020546(C>T) |
Allele (T/C) |
6 |
0.89 |
[0.74-1.08] |
73.80% |
0.002 |
| Heterozygote (CT/CC) |
0.90 |
[0.74-1.09] |
66.10% |
0.012 |
| Homozygote (TT/CC) |
0.95 |
[0.66-1.36] |
32.70% |
0.203 |
| Dominant (CT+TT/CC) |
0.89 |
[0.72-1.09] |
71.90% |
0.003 |
| Recessive (TT/CT+CC) |
0.99 |
[0.73-1.32] |
7% |
0.367 |
| rs718630(T>G) |
Allele (G/T) |
6 |
0.95 |
[0.90-1.03] |
0.00% |
0.776 |
| Heterozygote (TG/TT) |
0.96 |
[0.86-1.06] |
0.00% |
0.96 |
| Homozygote (GG/TT) |
0.93 |
[0.82-1.06] |
0.00% |
0.8 |
| Dominant (TG+GG/TT) |
0.95 |
[0.85-1.05] |
0.00% |
0.875 |
| Recessive (GG/TG+TT) |
0.96 |
[0.86-1.08] |
0% |
0.891 |
Table 3: Meta-analysis results for SNPs reversely correlated to T2DM.
Heterogeneity
Heterogeneity between studies was low for most of SNPs concerned. For those comparisons with greater than 40% I-squared values, we investigated the source of heterogeneity by genotyping method, source of control, and sample size with meta-regression analysis. Meta-regression results revealed sample size and source of control, rather than genotyping method, contributed to the source of heterogeneity. Sample size could explain 8%, 12%, 11%, 12%, and 9% of the between studies variance for rs941798(A>G) (allele model), rs941798(A>G) (homozygote model), rs2282147(C>T) (allele model), rs2282147(C>T) (homozygote model), and rs754118(C>T) (allele model), respectively (Table 4). Source of control could explain 32% and 100% of the variance for rs3787345(T>C) (allele model) and rs718049(T>C) (allele model) (Table 4).
| SNP |
Model |
I-squared |
Tau-squared |
Genotyping |
Source of control |
Sample size |
| Tau-squared |
p |
Tau-squared |
p |
Tau-squared |
p |
| rs941798(A>G) |
Allele |
47.10% |
0.0064 |
0.008 |
0.406 |
0.010 |
0.889 |
0.006 |
0.181 |
| Homozygote |
44.50% |
0.0239 |
0.028 |
0.378 |
0.036 |
0.920 |
0.021 |
0.173 |
| rs3787345(T>C) |
Allele |
40.60% |
0.0052 |
0.006 |
0.482 |
0.004 |
0.168 |
0.007 |
0.963 |
| rs2282147(C>T) |
Allele |
46.40% |
0.0067 |
0.009 |
0.564 |
0.007 |
0.366 |
0.006 |
0.193 |
| Homozygote |
40.00% |
0.0239 |
0.028 |
0.430 |
0.021 |
0.372 |
0.021 |
0.188 |
| rs718049(T>C) |
Allele |
41.40% |
0.0054 |
0.008 |
0.646 |
0.000 |
0.060 |
0.006 |
0.339 |
| rs6020546(C>T) |
Allele |
73.80% |
0.0369 |
0.034 |
0.309 |
0.034 |
0.309 |
0.049 |
0.962 |
| Heterozygote |
66.10% |
0.0353 |
0.031 |
0.267 |
0.031 |
0.267 |
0.050 |
0.993 |
| Dominant |
71.90% |
0.0435 |
0.040 |
0.301 |
0.040 |
0.301 |
0.058 |
0.995 |
| rs754118(C>T) |
Allele |
43.20% |
0.0055 |
0.008 |
0.570 |
0.007 |
0.447 |
0.005 |
0.218 |
| rs3787348(G>T) |
Allele |
50.70% |
0.0071 |
0.010 |
0.508 |
0.008 |
0.395 |
0.009 |
0.498 |
| Homozygote |
47.90% |
0.0263 |
0.038 |
0.563 |
0.025 |
0.340 |
0.032 |
0.464 |
Table 4: Meta-regression analysis.
Sensitivity analysis and publication bias
For SNPs with at least 7 datasets, sensitivity analysis was performed to explore influence of individual study on the pooled results. The results showed that no individual study affected the pooled OR significantly for the SNPs studied (Data not shown). Publication bias was evaluated by Begg's and Egger's test. No significant bias was observed (p>0.05) (Table 5).
| SNP |
Number of datasets |
p values for Begg's Test |
p values for Egger's Test |
| Allele |
Heterozygote |
Homozygote |
Dominant |
Recessive |
Allele |
Heterozygote |
Homozygote |
Dominant |
Recessive |
| rs941798(A>G) |
9 |
0.75 |
0.92 |
0.45 |
0.75 |
0.92 |
0.99 |
1.00 |
0.98 |
0.98 |
0.98 |
| rs3787345(T>C) |
10 |
0.37 |
1.00 |
0.28 |
0.59 |
0.59 |
0.39 |
0.74 |
0.39 |
0.53 |
0.45 |
| rs2282147(C>T) |
8 |
0.90 |
1.00 |
0.90 |
1.00 |
0.90 |
0.91 |
0.85 |
0.95 |
0.88 |
0.87 |
| rs718049(T>C) |
7 |
1.00 |
0.55 |
1.00 |
0.55 |
0.76 |
0.40 |
0.21 |
0.45 |
0.22 |
0.83 |
| rs718050(G>A) |
10 |
0.59 |
0.59 |
0.47 |
0.37 |
0.86 |
0.33 |
0.07 |
0.38 |
0.10 |
0.85 |
| rs754118(C>T) |
9 |
1.00 |
1.00 |
0.75 |
1.00 |
0.75 |
0.72 |
0.78 |
0.70 |
0.74 |
0.68 |
| rs3787348(G>T) |
7 |
0.76 |
1.00 |
1.00 |
1.00 |
1.00 |
0.57 |
0.51 |
0.59 |
0.58 |
0.51 |
| rs914458(C>G) |
8 |
0.54 |
0.17 |
0.90 |
0.39 |
0.90 |
0.65 |
0.24 |
0.77 |
0.42 |
0.57 |
Only SNPs with at least 7 datasetswere included forBegg's and Egger's test.
Table 5: Begg's and Egger's test.
Discussion
In this meta-analysis, 13 eligible datasets containing 6233 T2DM cases and 5892 control subjects, were included and analyzed. Overall 22 SNPs of PTPN1 were investigated. Most of PTPN1 SNPs genotyped are located within non-coding regions. Our metaanalysis confirmed limited number of PTPN1 SNPs associated with T2DM susceptibility. rs1689673(148insG) and rs2230605(A>G) were positively associated with T2DM susceptibility, whereas rs2230604 (C>T), rs6126033(C>T), and rs2426159(A>G) were reversely associated with T2DM susceptibility.
Our results confirmed the associations of rs1689673(148insG) with T2DM susceptibility, which are consistent with several casecontrol studies. Paola et al. identified 1484insG(a variation in 3'UTR of PTPN1) in two Italian populations, and 1484insG was further found to be associated with several features of insulin resistance [23]. Subjects carrying 1484insG showed over-expressed PTPN1 mRNA in skeletal muscle. As PTPN1 is a negative regulator of the insulin signaling pathway, elevated expression of PTPN1 caused by 1484insG would lead to insulin resistance and T2DM susceptibility. Our pooled meta-analysis found no association of T2DM susceptibility with rs941798, rs754118, rs2282147, and rs3787348, which were reported as T2DM associated SNPs in the study of two independently ascertained collections of Caucasian subjects [22].
Our results showed that several SNPs [rs2230604(C>T), rs6126033(C>T), rs718049(T>C), rs2426159(A>G), rs718050 (G>A), rs6020546(C>T), and rs718630(T>G)] displayed reverse correlations with T2DM, indicating those SNPs are protective. Interestingly, rs6126033(C>T), rs718049(T>C), rs2426159(A>G), and rs718050(G>A) are intron variants, while rs6020546(C>T) and rs718630(T>G) are promoter variants. Intron variants might lead to impaired intron splicing followed by translation of PTPN1 mutant proteins. Reports have shown that some introns also possess transcriptional regulation activity [24-27], so both intron and promoter variants of PTPN1 might suppress the transcription of PTPN1 gene, resulting in active insulin signaling. Future investigations are needed to validate these hypotheses.
Due to limited number of datasets, we didn't stratify the datasets by ethnic group, genotyping method, source of control, or sample size. So any potential OR differences caused by these influential factors could not be distinguished. For most SNPs investigated, we didn't observed high heterogeneity between studies. Our meta-regression analysis indicates that different genotyping methods didn't contribute into the heterogeneity between studies, whereas the source of control and sample size were the influential factors to the pooled estimates. Adoption of sex- and age-matched control could partially avoid inclusion of unnecessary heterogeneity, and bigger sample size could make the statistics more authentic and convincing.
Of the 22 SNPs investigated, 19 SNPs are located in the non-coding regions of PTPN1 (Supplementary Table 2). Of the 3 SNPs located in exons, only one SNPs leads to amino acid substitution. The disequilibrium distributions of SNPs between coding and noncoding region indicates that intact PTPN1 protein is essential for individual survival and growth. We hypothesized that, compared with SNPs in non-coding regions, individuals carrying SNPs in coding regions tended to be eliminated during evolution. So we suggest that underlying mechanism of PTPN1 SNPs with T2DM susceptibility is more likely at gene transcription level.
In conclusion, our pooled meta-analysis produced more authentic and convincing results on T2DM associated PTPN1 SNPs. More genetic studies are needed to validate the biological effects of those PTPN1 SNPs at molecular level. The T2DM associated SNPs also have great guiding significance for therapeutic strategy development in clinical T2DM treatment.
9700
References
- Whiting DR, Guariguata L, Weil C, Shaw J (2011) IDF diabetes atlas: global estimates of the prevalence of diabetes for 201 and 2030. Diabetes Res ClinPract 94: 311-321.
- Guariguata L (2012) By the numbers: new estimates from the IDF Diabetes Atlas Update for 2012. Diabetes Res ClinPract 98: 524-525.
- Vijan S (2010) In the clinic. Type 2 diabetes. Ann Intern Med 152: ITC31-15.
- Bhatt HB, Smith RJ (2015) Fatty liver disease in diabetes mellitus. HepatobiliarySurgNutr 4: 101-108.
- Okita K, Iwahashi H, Kozawa J, Okauchi Y, Imagawa A, et al. (2013) Homeostasis model assessment of insulin resistance for evaluating insulin sensitivity in patients with type 2 diabetes on insulin therapy. Endocr J 60: 283-290.
- Matsuzaka T, Shimano H (2011) Molecular mechanisms involved in hepatic steatosis and insulin resistance. J Diabetes Investig 2: 170-175.
- Combs AP (2010) Recent advances in the discovery of competitive protein tyrosine phosphatase 1B inhibitors for the treatment of diabetes, obesity and cancer. J Med Chem 53: 2333-2344.
- Rajala RV, Basavarajappa DK, Dighe R, Rajala A (2013) Spatial and temporal aspects and the interplay of Grb14 and protein tyrosine phosphatase-1B on the insulin receptor phosphorylation. Cell Commun Signal 11: 11-96.
- Onoda T, Li W, Higai K, Koike K (2014) Evaluation of 147 Kampo prescriptions as novel protein tyrosine phosphatase 1B (PTP1B) inhibitory agents. BMC Complement Altern Med 14: 64.
- Price J, Brewer C, Howard T (1997) Construction of a physical map of chromosome 20q12-13 and linkage disequilibrium analysis in diabetic nephropathy patients. Am J Hum Genet 58: A241.
- Bodhini D, Radha V, Ghosh S, Majumder PP, Mohan V (2011) Lack of association of PTPN gene polymorphisms with type 2 diabetes in south Indians. J Genet 90: 323-326.
- Traurig M, Hanson RL, Kobes S, Bogardus C, Baier LJ (2007) Protein tyrosine phosphatase 1B is not a major susceptibility gene for type 2 diabetes mellitus or obesity among Pima Indians. Diabetologia 50: 985-989.
- Cheyssac C, Lecoeur C, Dechaume A, Bibi A, Charpentier G, et al. (2006) Analysis of common PTPN gene variants in type 2 diabetes, obesity and associated phenotypes in the French population. BMC Med Genet 7: 44.
- Florez JC, Agapakis CM, Burtt NP, Sun M, Almgren P, et al. (2005) Association testing of the protein tyrosine phosphatase 1B gene (PTPN1) with type 2 diabetes in 7,883 people. Diabetes 54: 1884-1891.
- Anaya MP, Garcia-Quispes WA, Soto FL, Rojas CP, Torres Gonzale D, et al. (2014) Genetic association analysis between SNP rs914458 of protein tyrosine phosphatase, non-receptor type 1(ptpn1) gene and Type 2 Diabetes in Peruvian Population. Horiz Med 14: 31-36.
- Ding YJ, Peng HM (2007) Association of three genetic single nucleotide polymorphisms in PTPN gene with risk of type 2 diabetes mellitus in chinesehanpoupolation. Chinese Journal of Gerontology 27: 2310-2313.
- Malodobra M, Lebioda A, Majda F, Skoczynska A, Dobosz T (2007) Correlation of SNP polymorphism in GAD2 and PTPN genes with type 2 diabetes in obese people. Via Medica Medical Publishers 7: 220-224.
- Dersimonian R, Laird N (1986) Meta-analysis in clinical trials. Control Clin Trials 7: 177-188.
- Tobias A (1999) Assessing the influence of a single study in the meta-anyalysis estimate. Stata Technical Bulletin.
- Thompson SG, Higgins JP (2002) How should meta-regression analyses be undertaken and interpreted? Stat Med 21: 1559-1573.
- Egger M, Davey SG, Schneider M, Minder C (1997) Bias in meta-analysis detected by a simple, graphical test. BMJ 315: 629-634.
- Bento JL, Palmer ND, Mychaleckyj JC, Lange LA, Langefeld CD, et al. (2004) Association of protein tyrosine phosphatase 1B gene polymorphisms with type 2 diabetes. Diabetes 53: 3007-3012.
- Di Paola R, Frittitta L, Miscio G, Bozzali M, Baratta R, et al. (2002) A variation in 3' UTR of hPTP1B increases specific gene expression and associates with insulin resistance. Am J Hum Genet 70: 806-812.
- Stemmler MP, Hecht A, Kemler R (2005) E-cadherin intron 2 contains cis-regulatory elements essential for gene expression. Development 132: 965-976.
- Hural JA, Kwan M, Henke G, Hock MB, Brown MA (2000) An intron transcriptional enhancer element regulates IL-4 gene locus accessibility in mast cells. J Immunol 165: 3239-3249.
- Kwan M, Powell DR, Nachman TY, Brown MA (2005) An intron GATA-binding site regulates chromatin accessibility and is essential for IL-4 gene expression in mast cells. Eur J Immunol 35: 1267-1274.
- Zhou G, Myers R, Li Y, Chen Y, Shen X, et al. (2001) Role of AMP-activated protein kinase in mechanism of metformin action. J Clin Invest 108: 1167-1174.