Keywords
Stunting; Underweight; Wasting; Afambo; Afar; Northeastern Ethiopia
Introduction
Malnutrition results from an unbalanced diet that does not contain all the necessary nutrients and/or inadequate or excessive consumption of nutrients. It can also result from diseases that interfere with the body’s ability to use the nutrients consumed. Malnourished children have lowered resistance to infection. Therefore, they are more likely to die from common childhood illnesses such as diarrhea and respiratory infections [1-3].
Nutritional status is primarily measured by child’s growth in height and weight. However, to determine the extent of malnutrition, there are three indicators (stunting, wasting and underweight) expressed as standard deviation (SD) units from the median of the reference group. Children who fall below -2SD from the median of the reference population are regarded as moderately malnourished, while those who fall below -3SD from the median of the reference population are considered severely malnourished [4-6].
Stunting (height/length-for-age) represents the long-term effects of malnutrition in a population and is not sensitive to short-term changes in dietary intake. On the other hand, wasting (weight-for-height/length) represents the failure to receive adequate nutrition in a short period of time. However, underweight (weight-for-age) is a composite index of stunting and wasting: a child can be underweight for his/her age because he/she is stunted, wasted, or both. It is an overall indicator of the nutritional status of population [5,6].
Malnutrition is associated with more than half of all child mortality worldwide [7]. According to the 2008 lancet series, 20% of children younger than five years in low and middle income countries are underweight. Globally, 10% (55 million children) are wasted and of these 19 million are severely wasted. About 32% (178 million) of under-five children around the world are stunted. Of the estimated 178 million, 90% live in 36 countries, one of which is Ethiopia [8]. The recent Ethiopian demographic and health survey showed that 53% of under-five mortality is attributed to malnutrition. Forty four percent of children younger than five years are stunted, 10% are wasted, and 29% are underweight [5]. In Dollo Ado district of Ethiopia wasting was 42.3%, underweight (47.7%) and stunting was 34.4% [6].
Furthermore, more than 44% of the pastoral communities are food insecure where the three malnutrition indices are highest in Afar Regional State [9]. A cross sectional study in Aysaita district of Ethiopia revealed that the prevalence of stunting, wasting and underweight were 67.8%, 12.8% and 46.1%, respectively [10]. Hence, the prevalence of malnutrition in Afar Regional State is above the national average.
Reducing child malnutrition is central in the achievement of the health sector transformation plan (HSTP). However, the prevalence of malnutrition in Afar Regional State is far from the government’s HSTP target of stunting (26%), wasting (4.9%) and underweight(13%) among under-five children by the end of 2020 [11]. Moreover, interventions on child malnutrition need evidence on factors associated with child malnutrition in different parts of Ethiopia particularly in pastoralist communities. Despite this fact, there is limited literature on factors associated with malnutrition in Afar Regional state. Therefore, this study was conducted in Afambo district of Afar Regional state to assess under nutrition and associated factors among children aged six to fifty nine months. Hence, this study may help interventions to improve child nutritional status in the study area and Afar Regional State.
Methods and Materials
Study setting and design
A community based cross sectional study was conducted in Afambo district of Afar Regional state from January 21 to February 05/2015. Afambo district is one of the eight districts in Zone one. It is located at 677 kms from Addis Ababa and 67 kms from the city of Samara. There are seven kebeles (the smallest administrative units next to district in Ethiopia). There are two health centers and eleven health posts. Based on the 2007 census population projection, the district has a total population of 29,399, of which 2,639 are estimated to be children aged 6-59 months.
Sample size and sampling procedure
The sample size was calculated based on a single population proportion formula as follows:
Where n = required sample size, Z = critical value for normal distribution at 95% confidence level (1.96), d = 0.05 (5% margin of error) and an estimated non-response rate of 5% were considered. Then the largest sample size was taken after calculating the sample size based on the three indicators of under nutrition prevalence of wasting (42.3%) in Dollo Ado district of Ethiopia [6], the prevalence of stunting and underweight in Aysaita district 67.8% and 46.1%, respectively [10]. A sample size of 401, calculated based on the prevalence of underweight, was found to be the largest and was taken as a sample size for this study.
First Afambo district was selected purposively since more agro-pastoralists are living in this district. Secondly, from the seven kebeles in the district, four were randomly selected by lottery. To give equal chance in the selection of the sampling unit, proportional allocation technique was employed across each selected kebeles. Then to select the sampling units (households having children aged 6-59 months), first the total number of households with children aged 6-59 months was divided by the sample size in each selected kebeles and then systematic random sampling technique was applied.
At the time of survey, from each household unit one eligible mother-child pair was selected. If there was more than one mother-child pair in one household unit, one mother with the youngest child was selected. From mothers who had more than one child aged 6-59 months, the youngest child was selected as the reference. If mothers had twin children aged 6-59 months, one child was selected by lottery method.
Data collection process and instrument
Data were collected using a pre-tested, interviewer administered structured questionnaire. The questionnaire was prepared first in English and translated in to Qafar’af (the local language), then back to English to check for consistency. The Qafar’af version of the questionnaire was used to collect the data. Eight high school graduates who can speak the local language were recruited as data collectors. Then the questionnaire was pretested on two kebeles which were not included in the research. The pretest was done to ensure clarity, wordings, logical sequence and skip patterns of the questions. Then the pretest amendments on the questionnaire were made accordingly.
Anthropometric measurements (weight and length/height) were done for all children included in the study. Length of the infants (6-23 months) was measured in a recumbent position using a board with a wooden base and movable headpiece. Height was measured in children older than two years of age in standing position to the nearest 0.1 cm. Weight was measured in kilogram to the nearest 0.1 kg using digital weight scale which was checked against a standard weight for its accuracy in daily basis. Calibration of instrument against zero reading was made following weighting of every child. Children were weighted with light clothing and without shoes. All anthropometric measurements were taken by high school graduates with assistant.
Study variables
The dependent variables were wasting, stunting and underweight. Children below minus two standard deviation (-2SD) from the median of the WHO reference population for weight-for-age, length/height-for-age and weight-for-length/ height were considered as underweight, stunted and wasted, respectively. All the three dependent variables were categorized into two, those children who were exposed to the event (stunted, wasted or underweight) coded as “1” and those who were not exposed to the event (not stunted, not wasted or not underweight) coded as “0” for regression analysis.
The independent variables were maternal characteristics (age, occupation, educational status, marital status, ethnicity, religion), household characteristics (family size, income, household head, household hanger scale), paternal education status, maternal health service and obstetric related variables (antenatal care (ANC), place of delivery, postnatal care (PNC), mode of delivery, child feeding counseling at ANC and PNC checkups), child characteristics (sex and age), child feeding practices (breastfeeding, bottle feeding in the 24 hours preceding the survey, dietary diversity, complementary feeding, prelacteal feeding) and diarrhea in the two weeks preceding the survey.
Data processing and analysis
Data were checked for completeness and inconsistencies. It was also cleaned, coded and entered into Epi Data version 3.02. WHO Anthro version 3.2.2 was used to convert height and weight measures into z-scores and to estimate the prevalence of under nutrition by using the WHO reference population. Then, SPSS version 20 was used to analyze the data. Descriptive statistics was calculated for continuous variables while frequency distribution was used to express the distribution of categorical variables and to show the prevalence of stunting, underweight and wasting.
Binary logistic regression analysis was performed. The crude odds ratio (COR) with 95% confidence interval was estimated to assess the association between each independent variables and the outcome variable. Variables with p-value < 0.25 in the binary logistic regression analysis were considered in the multivariable logistic regression analysis. The Hosmer- Lemeshow goodness-of-fit with enter procedure was used to test for model fitness. Adjusted odds ratio (AOR) with 95% confidence interval was estimated to assess the strength of the association. Variables with p-value <0.05 in the multivariable logistic regression analysis were considered as significant and independent predictors of stunting, underweight and wasting.
Ethical consideration
The study was approved by the Ethical Review Committee (ERC) of Samara University. An official letter was written from Samara University to Afambo district administration office. Then permission and support letter were written to each selected kebeles. The participants enrolled in the study were informed about the study objectives, expected outcomes, benefits and the risks associated with it. A written consent was taken from the participants before the interview. Confidentiality of responses was maintained throughout the study.
Results
Socio-demographic characteristics of the study participants
A total of 370 mother-child pairs were included in the study, resulting in a response rate of 92.3%. About 84% and 85% of the mothers were Afar in ethnicity and religiously Muslim, respectively. About 35% of the mothers were household heads, and 68.4% of mothers and 79.7% of fathers did not attend formal education (Table 1).
| Variable |
Frequency |
Percent (%) |
| Age of mother (in year) (n=370) |
|
|
| <20 |
19 |
5.1 |
| 20-34 |
265 |
71.6 |
| >34 |
86 |
23.3 |
| Mean (± SD ) age of mothers |
29.16(+6.20) years |
|
| Ethnicity (n=370) |
|
|
| Afar |
312 |
84.3 |
| Amhara |
55 |
14.9 |
| Tigray |
3 |
0.8 |
| Maternal religion (n=370) |
|
|
| Muslim |
314 |
84.9 |
| Orthodox |
56 |
15.1 |
| Maternal occupation (n=370) |
|
|
| Housewife |
224 |
60.5 |
| Agro-pastoralist |
115 |
31.1 |
| Government employee |
20 |
5.4 |
| Trader |
11 |
3 |
| Maternal education status (n=370) |
|
|
| No formal education |
253 |
68.4 |
| Formal education |
117 |
31.6 |
| Maternal marital status (n=370) |
|
|
| Currently unmarried* |
21 |
5.7 |
| Married |
349 |
94.3 |
| Husband educational status (n=349) |
|
|
| No formal education |
278 |
79.7 |
| Formal education |
71 |
20.3 |
| Household head (n=370) |
|
|
| Mothers of index children |
133 |
35.9 |
| Fathers of index children |
237 |
64.1 |
| Sex of the index child (n=370) |
|
|
| Male |
178 |
48.1 |
| Female |
192 |
51.9 |
| Age of the index child (in month) (n=370) |
|
|
| 6-17 |
146 |
39.5 |
| 18-29 |
126 |
34 |
| 30-41 |
68 |
18.4 |
| 42-53 |
23 |
6.2 |
| >54 |
7 |
1.9 |
| Mean (±SD) age of children |
22.42(+12.69) months |
|
| Family size (n=370) |
|
|
| 2 |
13 |
3.5 |
| 3-4 |
110 |
29.7 |
| >5 |
247 |
66.8 |
| Average monthly income (ETB) |
|
|
| <1000 |
135 |
36.5 |
| >1000 |
235 |
63.5 |
| *single, widowed, divorced. ETB= Ethiopian birr. SD= standard deviation. |
Table 1 Socio-demographic characteristics of mother-child pairs in Afambo district, Northeast Ethiopia, 2015.
Maternal and child health service utilization
One hundred ninety five mothers (52.7%) had attended antenatal care (ANC). Of those who had attended ANC, about 30% had attended four and more ANC visits. Majority of mothers had delivered the index child at home (Table 2).
| Maternal health services |
Frequency |
Percent (%) |
| Antenatal care (ANC) visit (n=370) * |
|
|
| Yes |
195 |
52.7 |
| No |
175 |
47.3 |
| Number of ANC visit (n= 195) |
|
|
| 1 |
10 |
5.1 |
| 2-3 |
126 |
64.6 |
| >4 |
59 |
30.3 |
| Child feeding counseling at ANC visit (n=195) |
|
|
| Yes |
160 |
82.1 |
| No |
35 |
17.9 |
| Delivery place (n=370) |
|
|
| Home |
242 |
65.4 |
| Health institution |
128 |
34.6 |
| Mode of delivery (n=370) |
|
|
| Vaginal delivery |
354 |
95.7 |
| Caesarean section delivery |
16 |
4.3 |
| Postnatal care (PNC) visit (n=370) * |
|
|
| Yes |
168 |
45.4 |
| No |
202 |
54.6 |
| Child feeding counseling at PNC visit (n=370) |
|
|
| Yes |
129 |
76.8 |
| No |
39 |
23.2 |
| *at least one visit |
Table 2 Distribution of mothers based on maternal health service utilization in Afambo district, Northeast Ethiopia, 2015.
Child feeding practices
Nearly 91% of mothers had ever breastfed their index child. Of those who had ever breastfed, 40.4% mothers initiated breastfeeding within one hour of birth. Colostrum avoidance and prelacteal feeding were practiced by 34.9% and 49.6% of mothers, respectively (Table 3).
| Variables |
Frequency (n) |
Percent (%) |
| Ever breastfeeding (n=370) |
|
|
| Yes |
337 |
91.1 |
| No |
33 |
8.9 |
| Early breastfeeding practice (n=337) |
|
|
| Yes |
201 |
40.4 |
| No |
136 |
59.6 |
| Prelacteal feeding (n=337) |
|
|
| Yes |
167 |
49.6 |
| No |
170 |
50.4 |
| Colostrum feeding (n=370) |
|
|
| Yes |
241 |
65.1 |
| No |
129 |
34.9 |
| Complementary feeding initiation at six months of age (n=370) |
|
|
| Yes |
|
|
| No |
69 |
18.6 |
| |
301 |
81.4 |
| MDDS in the previous 24 hour (n=370)* |
|
|
| Yes |
114 |
30.8 |
| No |
256 |
69.2 |
| Bottle feeding in the previous 24 hours (n=370) |
|
|
| Yes |
98 |
26.5 |
| No |
272 |
73.5 |
| Household hunger scale (n=370) |
|
|
| Little to no hunger |
226 |
61.1 |
| Moderate hunger |
120 |
32.4 |
| Severe hunger |
24 |
6.5 |
| Diarrhea in the last two weeks (n=370) |
|
|
| Yes |
80 |
21.6 |
| No |
290 |
78.4 |
| *MDDS=Minimum dietary diversity score. |
|
|
Table 3 Child feeding practices and household hunger scale in Afambo district, Northeast Ethiopia, 2015.
Nutritional status of children
As shown in Figures 1, 2 and 3, Z-score curves are displaced to the left of WHO growth reference curve demonstrating that under nutrition is prevalent in children aged 6 to 59 months in Afambo district.
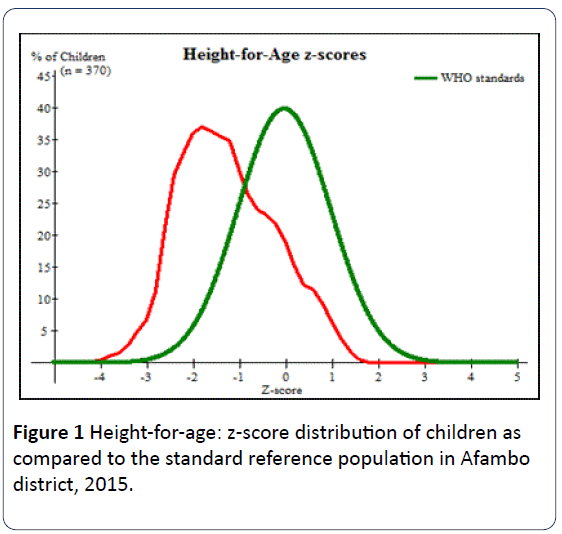
Figure 1: Height-for-age: z-score distribution of children as compared to the standard reference population in Afambo district, 2015.
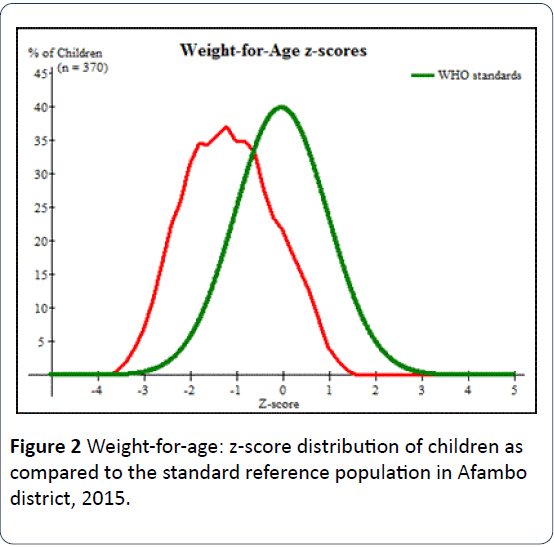
Figure 2: Weight-for-age: z-score distribution of children as compared to the standard reference population in Afambo district, 2015.
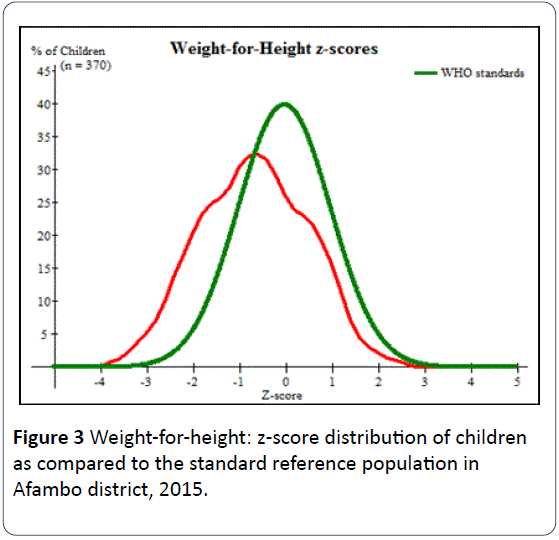
Figure 3: Weight-for-height: z-score distribution of children as compared to the standard reference population in Afambo district, 2015.
Stunting (HAZ) and associated factors
The mean (±SD) of HAZ of the study children was -1.24(±1.02) (Figure 1). The prevalence of stunting for male and female children was 34.8% and 29.7%, respectively. The overall prevalence of stunting among the study children was 32.2% (95% CI: 27.4-36.9%) (Table 4).
| Nutritional status (n=370) |
Frequency |
Percent |
| Stunting |
Normal (HAZ ≥ -2SD) |
251 |
67.8 |
| Moderate stunting (HAZ ≥-3SD &<-2SD) |
112 |
30.3 |
| Severe stunting (HAZ<-3SD) |
7 |
1.9 |
| Underweight |
Normal (WAZ≥ -2SD) |
283 |
76.5 |
| Moderate underweight (WAZ ≥ -3SD &<-2SD) |
83 |
22.4 |
| Severe underweight (WAZ<-3SD) |
4 |
1.1 |
| Wasting |
Normal (WHZ ≥-2SD) |
319 |
86.2 |
| Moderate wasting (WHZ ≥ -3SD &<-2SD) |
46 |
12.4 |
| Severe wasting (WHZ <-3SD) |
5 |
1.4 |
Table 4 Distribution of under nutrition among children aged six to fifty nine months in Afambo district, Northeast Ethiopia, 2015.
The binary logistic regression analysis showed that sex of the index child, antenatal care visit, household hanger scale and colostrum avoidance were statistically associated with stunting. In the multivariable logistic regression analysis being male [AOR: 1.88; 95% CI (1.01, 3.49)], not attending antenatal care visits [AOR: 3.87; 95% CI (1.87, 7.99)], severe [AOR: 6.49; 95% CI (1.62, 26.01)] and moderate household hanger scale [AOR: 2.88; 95% CI (1.27, 6.51)] were independent predictors of increased odds of stunting among children aged 6 to 59 months (Table 5).
| Variable |
Stunting n (%) |
COR (95% CI) |
AOR (95% CI) |
| Household head |
|
|
|
| Mothers of the index child |
49(36.8) |
1.392 (0.89,2.18) |
1.00(0.47,2.12) |
| Fathers of the index child |
70(29.5) |
1 |
1 |
| Sex |
|
|
|
| Male |
62(34.8) |
1.27 (0.82,1.96) |
1.88(1.01,3.49)* |
| Female |
57(29.7) |
1 |
1 |
| ANC visit |
|
|
|
| No |
72(41.1) |
2.2(1.41,3.44)* |
3.87 (1.87,7.99)** |
| Yes |
47(24.1) |
1 |
1 |
| Minimum dietary diversity |
|
|
|
| No |
83(32.4) |
1.04(0.65,1.67) |
1.423(0.69,2.89) |
| Yes |
36(31.6) |
1 |
|
| Household hunger scale |
|
|
|
| Little to no hunger |
55(24.3) |
1 |
1 |
| Moderate hunger |
51(42.5) |
2.30(1.43,3.69)* |
2.88 (1.273,6.51)* |
| Severe hunger |
13(54.2) |
3.67 (1.56,8.67)* |
6.49 (1.62,26.01)* |
| Prelacteal feeding |
|
|
|
| Yes |
62(37.1) |
1.42(0.89,2.24) |
0.95 (0.50,1.78) |
| No |
50(29.4) |
1 |
1 |
| Colostrum feeding |
|
|
|
| No |
51(39.5) |
1.66(1.06,2.61)* |
1.10 (0.55,2.18) |
| Yes |
68(28.2) |
1 |
1 |
| Postnatal care visit |
|
|
|
| No |
70(34.7) |
1.29 (0.83,2.00) |
1.26(0.63,2.49) |
| Yes |
49(29.2) |
1 |
|
| Maternal Age |
|
|
|
| <20 |
3(15.8) |
1 |
1 |
| 20-34 |
90(34.0) |
2.74 (0.78,0.97) |
5.24(0.95,28.90) |
| >34 |
26(30.2) |
2.31 (0.62,8.62) |
2.29 (0.39,13.16) |
| Monthly household income |
|
|
|
| <1000 |
55(40.7) |
1.84(1.17,2.87) |
1.35(0.64,2.85) |
| >1000 |
64(27.2) |
1 |
1 |
| Hosmer and Lemeshow Test=0.739. COR= Crude odds ratio. AOR= Adjusted odds ratio. CI= confidence interval. *significant at p<0.05. **significant at p<0.001. |
Table 5 Binary and multivariable logistic regression analysis showing factors associated with stunting in Afambo district, Northeast Ethiopia, 2015.
Underweight (WAZ) and associated factors
The mean (±SD) of WAZ of the study children was -1.14(±0.95) (Figure 2). The prevalence of underweight for male and female children was 22.5% and 24.5%, respectively. The overall prevalence of underweight among the study children was 23.5% (95% CI:19.2-27.8%) (Table 4).
Binary logistic regression analysis showed that antenatal care visit, household hanger scale, prelacteal feeding, colostrum avoidance and postnatal care visit were significantly associated (at p<0.05) with underweight. As shown in Table 6 in the multivariable model the factors associated with increased odds of underweight were colostrum avoidance [AOR: 2.34; 95% CI(1.19,4.61)], household hanger scale [severe hunger (AOR:3.68; 95% CI (1.13,12.00)), moderate hanger AOR: (AOR: 3.47; 95% CI (1.65,7.29))] and not attending antenatal care visit [AOR = 9.14 (95% CI: 4.35-19.23)] (Table 6).
| Variable |
Underweight n (%) |
COR (95% CI) |
AOR (95% CI) |
| ANC visit |
|
|
|
| No |
66(37.7) |
5.02(2.91,8.66)** |
9.14(4.35,19.23)** |
| Yes |
21(10.8) |
1 |
1 |
| Household hunger scale |
|
|
|
| Little to no hunger |
34(15.0) |
1 |
1 |
| Moderate hunger |
41(34.2) |
2.93 (1.73,4.95)** |
3.47(1.65,7.29)* |
| Severe hunger |
12(50.0) |
5.65 (2.34,13.61)** |
3.68(1.13,12.00)* |
| Prelacteal feeding |
|
|
|
| Yes |
50(29.9) |
1.92(1.15,3.19)* |
1.15(0.63,2.11) |
| No |
31(18.2) |
1 |
1 |
| Colostrum feeding |
|
|
|
| No |
44(34.1) |
2.38(1.46,3.89)* |
2.34(1.19,4.61)* |
| Yes |
43(17.8) |
1 |
1 |
| Postnatal care visit |
|
|
|
| No |
57(28.2) |
1.81(1.09,2.98)* |
0.78(0.37,1.66) |
| Yes |
30(17.9) |
1 |
1 |
| Maternal educational status |
|
|
|
| Non formal education |
85(24.6) |
3.76(0.87,16.28) |
2.54(0.52,12.49) |
| Formal education |
2(8.0) |
1 |
1 |
| Complementary feeding initiation at six months of age |
|
|
|
| Yes |
11(15.9) |
1 |
1 |
| No |
76(25.2) |
1.78(0.89,3.57) |
1.40(0.60,3.26) |
| Hosmer and Lemeshow Test=0.331. COR= Crude odds ratio. AOR= Adjusted odds ratio. CI= confidence interval. *significant at p<0.05. **significant at p<0.001. |
Table 6 Binary and multivariable logistic regression analysis showing factors associated with underweight in Afambo district, Northeast Ethiopia, 2015.
Wasting (WHZ) and associated factors
The mean (±SD) of WHZ of children aged 6 to 59 months was -0.68(±1.14) (Figure 3). The overall prevalence of wasting in the study area was 13.8% (95% CI:10.3-17.3%) of which 12.9% male and 14.6% female children were wasted, respectively (Table 4).
The binary logistic model showed that mother-headed households, not attending antenatal care visit, diarrhea in last two weeks preceding the survey, bottle feeding, colostrum avoidance, appropriate age (at 6 completed months) of complementary feeding initiation and postnatal care visit were significantly associated (at p<0.05) with wasting. In multivariable logistic model not attending antenatal care visit [AOR: 2.87; 95% CI (1.18, 6.96)], diarrhea in last two weeks preceding the survey [AOR: 3.48; 95% CI (1.66, 7.30)] and bottle feeding [AOR: 2.95; 95% CI (1.46, 5.97)] were associated with increased odds of wasting. The factor associated with decreased odds of wasting was mother-headed households [AOR: 0.37; 95% CI (0.15, 0.92)] (Table 7).
| Variable |
Wasting n (%) |
Crude odds ratio (95% CI) |
Adjusted odds ratio (95% CI) |
| Household head |
|
|
|
| Mothers of the index child |
10(7.5) |
0.39(0.19,0.80)* |
0.37(0.15,0.92)* |
| Fathers of the index child |
41(17.3) |
1 |
1 |
| Maternal occupation |
|
|
|
| Housewife |
37(56.5) |
1.87(0.97,3.59) |
1.57(0.73,3.39) |
| Other† |
14(9.6) |
1 |
|
| ANC visit |
|
|
|
| No |
37(21.1) |
3.47(1.80,6.66)** |
2.87(1.18,6.96)* |
| yes |
14(7.2) |
1 |
|
| Site of delivery |
|
|
|
| Home |
38(15.7) |
1.65(0.84,3.22) |
0.77(0.32,1.83) |
| Health institution |
13(10.2) |
1 |
|
| Household hunger scale |
|
|
|
| Little to no hunger |
26(11.5) |
1 |
1 |
| Moderate hunger |
19(15.8) |
1.45(0.76,2.74) |
1.88(0.77,4.56) |
| Severe hunger |
6(25.0) |
2.56(0.93,7.04) |
2.051(0.63,6.74) |
| Diarrhea in the last 2 weeks |
|
|
|
| No |
31(10.7) |
1 |
1 |
| Yes |
20(25.0) |
2.79(1.49,5.22)* |
3.48(1.66, 7.30)* |
| Bottle feeding in the last 24 hour |
|
|
|
| No |
24(8.8) |
1 |
1 |
| Yes |
27(27.6) |
3.93(2.14,7.23)** |
2.95(1.46, 5.97)* |
| Colostrum feeding |
|
|
|
| No |
27(20.9) |
2.39(1.32,4.35)* |
2.07(0.99,4.31) |
| Yes |
24(10.0) |
1 |
1 |
| Complementary feeding initiation at six months of age |
|
|
|
| Yes |
|
|
|
| No |
4(5.8) |
1 |
1 |
| |
47(15.6) |
3.00(1.05,8.65)* |
2.82(0.82,9.67) |
| Postnatal care visit |
|
|
|
| No |
35(17.3) |
1.99(1.06,3.72)* |
0.917(0.37,2.29) |
| Yes |
16(9.5) |
1 |
|
| Maternal Age |
|
|
|
| <20 |
5(26.3) |
1 |
1 |
| 20-34 |
30(11.3) |
0.36(0.12,1.06) |
0.31(0.09,1.09) |
| >34 |
16(18.6) |
0.64(0.20,2.04) |
0.39 (0.09,1.62) |
| Hosmer and Lemeshow Test=0.375. COR= Crude odds ratio. AOR= Adjusted odds ratio. CI= confidence interval. *significant at p<0.05. **significant at p<0.001. †Government employee, trader, agro-pastoralist. |
Table 7 Binary and multivariable logistic regression analysis showing factors associated with wasting in Afambo district, Northeast Ethiopia, 2015.
Discussion
The prevalence of stunting, underweight, and wasting in this study were 32.2%, 23.5% and 13.8%, respectively. The multivariable logistic regression model showed that sex of the index child, antenatal care visits and household hanger scale were independent predictors of stunting. In addition, colostrum avoidance, household hanger scale and antenatal care visit were significantly associated with underweight. Finally, antenatal care visits, diarrhea in last two weeks preceding the survey, bottle feeding and household headship were significantly associated with wasting.
The levels of underweight, stunting and wasting identified in this study were lower as compared with other studies in Ethiopia [5,6,10,12-14]. Stunting was higher compared with the studies done in Gumbrit of Amhara region [15] and Kersa Demographic Surveillance and Health Research Centre [16]. This discrepancy might be due to socio-cultural, child feeding and life style variations across the communities. However, according to the world health organization classification in assessing severity of malnutrition by prevalence ranges among children aged less than five years, the prevalence of under nutrition in Afambo district was high.
Moderate and severe household hanger scales were associated with increased odds of stunting and underweight. The recent Ethiopian demographic and health survey showed that a higher proportion of children in the lowest household wealth quintile are stunted than children in the highest wealth quintile [5]. In Gumbrit of North West Ethiopia, children belonging to the low-income households were at a higher risk of being stunted and underweight than children of better income families [15]. Similar findings were also reported at India [17] and Kenya [18]. Moreover, it was found that children of households having poor socioeconomic status were more likely to be stunted and underweight compared with the children of households having rich socioeconomic status [19].
In Afambo district, not attending antenatal care visit was associated with increased odds of stunting, underweight and wasting among children aged 6-59 months. Similar result was reported at Medebay Zana District of Ethiopia [13] and Nigeria [20]. This could be lack of antenatal visit might create favorable environment for traditional child feeding malpractices that might affect child nutritional status. In addition, mothers who had attended antenatal visit might be advised by health professionals on proper child feeding practices.
This study revealed that boys were more likely to be stunted compared with girls. Similarly male children were more likely to be stunted compared with female children in Bule Hora district [21]. This result is similar to the results of previously conducted studies [5,13,22,23]. This sex related difference requires further study, but it is believed that boys are more influenced by environmental stress than girls [24,25].
Colostrum avoidance had significant association with increased odds of underweight among the study children. This might be probably colostrum provides protective effect to the newborns, and infants who did not receive colostrum might have high incidence, duration and severity of illnesses such as diarrhea and pneumonia which contribute to malnutrition. Similar finding was reported at west Gojjam [14] and Nigeria [26].
Diarrhea in the two weeks and bottle feeding during the 24 hours preceding the survey were predictors of wasting. A high prevalence of wasting was observed among children who had diarrhea in the two weeks before the survey and who fed on bottle in Afambo district. Similar findings were reported at Bule Hora district [21], Nigeria [26], Somali Region [27] and Durbete town [28]. This could be bottle fed children are more likely to get infections including diarrhea which then contributes to wasting. There is also a reciprocal relationship; malnourished children will have diarrhea.
Children of mother-headed households were less likely to be wasted in Afambo district. In rural Amhara communities, children from male-headed households were more likely to be wasted than children from female-headed households [29]. This could be explained in such a way that mothers who were household head might decide on proper child feeding practices compared to mothers who were not household head. Moreover, mothers might have more time to be with their children throughout the whole day. Therefore, they can prepare and serve foods in the safe way.
This study could have the following limitations. Firstly, it was difficult to establish a cause–effect relationship. Secondly, the findings could be affected by recall, interviewer and social desirability bias. It might also be liable to anthropometric measurement bias which could result in misclassification of children’s nutritional status. However, due attention was given to the study procedures, including the process of training, standardization of anthropometric measurements, and close supervision throughout the field activities.
Conclusion
The prevalence of under nutrition among the study children is high based on WHO classification in assessing severity of malnutrition by prevalence ranges. In the multivariable analysis not attending antenatal care and increasing level of household hanger scale were independent positive predictors of stunting and underweight. Moreover, colostrum avoidance and sex of the index child (being male) were associated with increased level of underweight and stunting, respectively. Finally, not attending antenatal care visits, diarrhea in last two weeks preceding the survey, bottle feeding during the 24 hours preceding the survey and mother-headed households were predictors of wasting. Therefore, adequate attention should be given by the district health office to raise awareness of mothers regarding the value of colostrum feeding and the hazards of bottle feeding. It is also important to provide health education and information to the mothers on the advantages of antenatal care and diarrhea management in the study area.
Funding
Samara University (funder) had no role in the study design, data collection and analysis, decision to publish, or preparation of the manuscript. Samara University had no grant numbers. The university gives financial support for researchers (staffs) who submit their proposals. The university considers conducting research is one of the community services.
Competing interests
The authors declare that they have no competing interests.
Authors’ contributions
All authors conceived, designed the study and supervised the data collection. MLL performed the data analysis, interpretation of data and drafted the manuscript. All authors read and approved the final manuscript.
Acknowledgments
Authors thank Samara University for supporting this study. Authors also thank supervisors, data collectors and study subjects.
9885
References
- Federal Ministry of Health (2008)National Nutrition Strategy. Addis Ababa, Ethiopia.
- Federal Ministry of Health (2005) Family health department. National strategy for child survival in Ethiopia. Addis Ababa, Ethiopia.
- Government of the Federal Democratic Republic of Ethiopia. National Nutrition Program. June 2013-June 2015.
- Macro ICF (2010) Nutrition of Children and Women in Ghana: A new look at data from the 2008 Ghana Demographic and Health Survey. Calverton, Maryland, USA.
- Central Statistical Agency [Ethiopia], ICF International. (2012) Ethiopia Demographic and Health Survey 2011.Addis Ababa, Ethiopia and Calverton, Maryland, USA.
- Solomon D,Amare W (2013) Magnitude and factors associated with malnutrition in children 6-59 months of age in pastoral community of Dollo Ado district, Somali region, Ethiopia. Sci J Public Health1: 175-183.
- United Nations System Standing Committee on Nutrition (UNS-SCN) (2004) 5thReport on the World Nutrition Situation: Nutrition for Improved development Outcomes.
- Black RE, Allen LH, Bhutta ZA, Caulfield LE, de Onis M, et al. (2008) Maternal and child undernutrition: global and regional exposures and health consequences. Lancet 371: 243-260.
- Aweke K,Tsehai A, MasreshaT, Andinet A, Berhanu WChallenges and opportunities in Community Based Nutrition (CBN) adaptation to pastoral areas in Ethiopia. Ethiopian Health and Nutrition Research Institute, Addis Ababa, Ethiopia.
- Fentaw R, Bogale A, Abebaw D (2013) Prevalence of child malnutrition in agro-pastoral households in Afar Regional State of Ethiopia. Nutr Res Pract 7: 122-131.
- Federal Ministry of Health-Ethiopia. (2015) Health Sector Transformation Plan (HSTP). 2015/16 - 2019/20 (2008-2012 EFY).
- Gezae B, Nigatu R (2014) Nutritional status of children under five years of age in Shire Indaselassie, North Ethiopia: Examining the prevalence and risk factors. Elsevier kontakt 16:e161-e170.
- Alemayehu M, Tinsae F, Haileslassie K, Seid O, Gebregziabher G et al. (2015) Under nutrition status and associated factors in under-5 children, in Tigray, Northern Ethiopia. ApplNutr Invest 31:964–970.
- Teshome B, Kogi – Makau W, Getahun Z,Taye G (2009) Magnitude and determinants of stunting in children under-five years of age in food surplus region of Ethiopia: The case of West Gojjam Zone. Ethiop J Health Dev 23: 98-106.
- Edris M (2007) Assessment of nutritional status of preschool children of Gumbrit, North West Ethiopia. Ethiop J Health Dev 21:125-129.
- Egata G, Berhane Y, Worku A (2013) Seasonal variation in the prevalence of acute undernutrition among children under five years of age in east rural Ethiopia: a longitudinal study. BMC Public Health 13: 864.
- Jai PS, Shyam BG, Ved PS,Prabhu NS (2013) Study of Nutritional Status Among Under Five Children Attending Out Patient Department at A Primary Care Rural Hospital, Bareilly(UP). SJAMS 1:769-773.
- Matanda DJ, Mittelmark MB, Kigaru DM (2014) Child undernutrition in Kenya: trend analyses from 1993 to 2008-09. BMC Pediatr 14: 5.
- Ruwali D (2011) Nutritional Status of Children Under Five Years of Age and Factors Associated in Padampur VDC, Chitwan. Health Prospect 10: 14-18.
- Ozor MO,Omuemu VO (2014) Relationship between antenatal visits and under-five under-nutrition: A case study of Ekpoma, Edo-Nigeria. AmJ Food SciNutrRes 1: 13-16.
- Asfaw M, Wondaferash M, Taha M, Dube L (2015) Prevalence of undernutrition and associated factors among children aged between six to fifty nine months in BuleHora district, South Ethiopia. BMC Public Health 15: 41.
- Yalew BM (2014) Prevalence of Malnutrition and Associated Factors among Children Age 6-59 Months at Lalibela Town Administration, North Wollo Zone, Anrs, Northern Ethiopia. J Nutr Disorders Ther 4: 132.
- Hien NN,Hoa NN (2009) Nutritional Status and Determinants of Malnutrition in Children under Three Years of Age in Nghean, Vietnam. Pak J Nutr 8: 958-964.
- Wamani H, Astrøm AN, Peterson S, Tumwine JK, Tylleskär T (2007) Boys are more stunted than girls in sub-Saharan Africa: a meta-analysis of 16 demographic and health surveys. BMC Pediatr 7: 17.
- Hien NN, Kam S (2008) Nutritional status and the characteristics related to malnutrition in children under five years of age in Nghean, Vietnam. J Prev Med Public Health 41: 232-240.
- Candyce H, Joseph E,Khalid O,Ndem A, Yahaya Y, et al. (2015) Childhood malnutrition is associated with maternal care during pregnancy and childbirth: a cross-sectional study in Bauchi and Cross River States,Nigeria. J Public Health Res 4:58-64.
- Fekadu Y, Mesfin A, Haile D, Stoecker BJ (2015) Factors associated with nutritional status of infants and young children in Somali Region, Ethiopia: a cross- sectional study. BMC Public Health 15: 846.
- Alelign T, Degarege A, Erko B (2015) Prevalence and factors associated with undernutrition and anaemia among school children in Durbete Town, northwest Ethiopia. Arch Public Health 73: 34.
- Herrador Z, Sordo L, Gadisa E, Moreno J, Nieto J, et al. (2014) Cross-Sectional Study of Malnutrition and Associated Factors among School Aged Children in Rural and Urban Settings of Fogera and LiboKemkem Districts, Ethiopia. PLoS ONE 9: e105880.

