Research Article - (2022) Volume 16, Issue 12
Disability and Quality of Life
Satyendra Nath Chakrabartty*
Indian Statistical Institute, Indian Institute of Social Welfare and Business Management, Indian Ports Association, India
*Correspondence:
Satyendra Nath Chakrabartty, Indian Statistical Institute, Indian Institute of Social Welfare and Business Management, Indian Ports Association,
India,
Email:
Received: 25-Nov-2022, Manuscript No. iphsj-22-13116;
Editor assigned: 28-Nov-2022, Pre QC No. iphsj-22-13116 (PQ);
Reviewed: 12-Dec-2022, QC No. iphsj-22-13116;
Revised: 19-Dec-2022, Manuscript No. iphsj-22-13116(R);
Published:
26-Dec-2022, DOI: 10.36648/1791- 809X.16.12.989
Abstract
Objectives: To review methodological issues of disability measuring tools (DMTs) and Health-related Quality of life (HRQoL) and to transform item-scores and health-profiles to continuous scores satisfying desired properties
Method: Using data driven weights, item score are converted to equidistant score (E) and value of Health-profile is obtained as weighted sum (Y). E-scores and Y-scores are standardized separately to Z-scores and further transformed to proposed scores (P) in [1, 100]. Scale score as sum of item-wise P-scores follow Normal distribution.
Results: P-scores offer better arithmetic aggregation, meaningful comparisons, relative importance of domains, predicting disability scores using HRQoL scores as predictors and statistical inferences for longitudinal or snap-shot data. Methods described to obtain responsiveness, theoretical reliability, factorial validity and equivalent scores of different scales.
Discussion: Proposed scores satisfying desired properties facilitate parametric analysis and computing psychometric concepts have theoretical advantages including meaningfulness of operations, better comparisons and use HRQoL scores as predictor of disabilities.
Keywords
Quality of Life; Likert item; Normal distribution; Reliability; Validity; Responsiveness
INTRODUCTION
Disability limits major life activities and refers to impairments resulting from disease or injury or old ages affecting physical, mental, emotional and psychosocial functions. Nature and extent of disability depends on types and severity of disease. Thus, people with disabilities form diverse and heterogeneous groups.Measurements of outcomes for different diseases and treatments need to satisfy desired properties of measurements and facilitate meaningful aggregation of item scores leading to meaningful comparisons of individuals or a sample of individuals. Assessing severity of disability and changes due to treatment, care, etc. are being done using bio-markers and patient-reported outcome (PROs) measures which gives discrete functional deficits like limitations in mobility or performance of daily living and socially defined life activities i.e. Health related Quality of life (HRQoL).
Large numbers of instruments are there to assess general and disease-specific disabilities including post-operation disabilities. Similarly, HRQoL instruments could be generic or disease-specific. Disease-specific HRQoL instruments are more responsive than generic ones [1]. However, use of generic measure together with disease-specific measure is common.
Both disability measuring tools(DMTs) and HRQoL assessing tools usually use summative scores of Likert items with K-number of response-categories (levels) where K= 3, 4, 5, 6, … or combination of items with different values of K including binary items. However, dimensions covered, numbers of items (scale length), width of items (number of response-categories), scoring methods, distributions of test scores, etc. are different for different instruments and can influence areas like treatment effect, patient care, policy issues, etc. Mean and standard deviation (SD) of Likert scales with K-point items increase as K increases [2]. Ordinal, discrete, skew, ceiling and floor effects of Likert/rating data often produce bias, violate assumptions of parametric analysis and normality checks are required [3]. Issues regarding levels of rating scales emphasizing statistical perspectives in using such scales were reviewed [4]. No agreed criterion for assessment of HRQoL was observed [5] who favoured 'health-profiles' for patients reflecting perceived health (or departures from health) in each selected dimension. EQ-5D-5L is popular where health-profile of a person is a 5 digit number, in five pre-selected dimensions. For example, health-profile 1-3-1-4-5 for the i-th person is different from 5-4-1-3-1 for the j-th person or any permutation of 1, 2, 3, 4 and 5 with repetitions. While 1-3-1-4-5 indicates extremely poor health-state in the 5th dimension, the reverse is indicated by 5-4- 1-3-1 implying different types of disabilities and clinical needs of the two persons. However, assigning numerical value to an EQ- 5D-5L pattern is not straightforward. Method of calculating valuesets for EQ-5D-5L with fixed upper bound 5-5-5-5-5 and lower bound 1-1-1-1-1proposed by [6] can be questioned on soundness of estimates of each dimension–level combination and often lead to situations where variance may vary at different values i.e. heteroskedasticity.
The paper describes method of transforming raw scores of items and also health-profiles to continuous scores following normal distribution, parameters of which can be estimated from data. Desirable properties of such transformations discussed including statistical testing and better calculation of reliability, validity, responsiveness (changes over time), equivalent scores of tests, etc.
Literature survey
Disability dimensions are different for different types of disease. HRQoL dimensions in leukaemia may vary depending on prognosis, disease-specific concerns, and treatment-specific concerns [7]. Evaluation of treatment-effect requires selection of appropriate HRQoL measure for the patient or patient groups receiving treatment. Such selection depends on health dimensions relevant to the set of patients and also psychometric qualities of the DMT and HRQoL instruments. For example, a tool to assess disabilities for patients after myocardial infarction (MI) should take into account the individual's responses to living with the disease, in terms of occupational, social, personal, sexual relationships, etc. and acute chronic physical consequences of the disease.
Measurements in the context of cardiovascular diseases (CVD) include assessment of outcomes, disease severity, impact of implemented interventions, patients' perception of their healthstatus before and after treatment, etc. Cervical spondylogenic myelopathy (CSM) is a disabling condition usually resulting from arthritic compression and consequent injury of the cervical spinal cord. Assessment scales are there for quantification of changes in CSM severity between pre- and post-operations to study outcome of surgery. Comparison of five stroke scales showed that measures of impairment are not adequate for describing health outcomes of surviving stroke patients [8]. Limitations in higher levels of physical functioning are not fully covered by these measures [9]. Four health-status measures were compared and no instrument performed uniformly as “best” or “worst [10]. Scoring of Sickness Impact Profile (SIP) items are inconsistent, illogical, ambiguous, and overall scores are difficult to interpret [11]. Inconsistent Factor structures of Minnesota Living with Heart Failure (MLHF) questionnaire have been questioned [12]. Factor analysis of General Health Questionnaire (GHQ-12) showed multi-factors against the claim of one-dimensional tool [13]. Studies suggested on responsiveness and comprehensibility of Myocardial infarction dimensional assessment scale (MIDAS) along with equivalence of measurement [14]. Responsiveness could not be evaluated for QoL after Myocardial Infarction (QLMI/ MacNew) [15]. High Cronbach's alpha of Myelopathy Disability Index (MDI) got reduced for each category when MDI-items were splitted into 4-categories (walking, hand function, transfers and dressing) [16]. Raw scores of each dimension of Late-Life Function and Disability Instrument (LLFDI) are transformed to scaled scores [0–100] based on one-parameter Rash model assuming only one latent dimension underlying all the items (unidimensionality) and local independence (uncorrelated items) [17]. If all the items are uncorrelated, sum of item variance = test variance ⇒ Cronbach alpha = 0. European Myelopathy Score (EMS) had lowest sensitivity to change among the seven scales of Severity of CSM and Post-Operative Improvement [16].
Observations from illustrative DMTs and HRQoL tests:
- Directions of scales differ. While higher score indicates less disability for LLFDI, SF 36
(Generic QoL scale), EMS, reverse is true for SIP, NHP, MDI, etc.
- Test length and test width, number of subscales are different.
- Total score of an individual in SF-36 is not provided. The same for EQ-5D-5L is not unanimous.
- Subscales with more number of items contribute more to total test scores. Need is felt to define battery reliability in terms of reliability of constituent sub-tests.
- Scales differ with respect to dimensional structure, cutoff scores, sensitivity of changes, etc. Better is to convert discrete test scores to continuous scores enabling detection of small changes and finding equivalent scores of different scales for integration of scales.
- Like most HRQoL measures, NHP does not provide relativeimportance across dimensions. Thus, comparison of dimensions is difficult [18].
- Scales use binary items or K-point Likert items or combination of both. Barring EQ-5D-5L, other instruments primarily consider summative Likert scores, despite inherent problems of ordinal Likert scores described below:
Major Problems of Likert scales
Response-categories like very often, often, once in a while, almost never and never could be dubious as individuals differ on frequency of an action to consider it as often. Pertinent question is how often is often? [19]
Patients differ on their subjective responses on physical, emotional and social functions and may not reflect true situations. For example, subjects reporting disturbed sleep showed normal sleep-patterns when monitored objectively [20].
Likert data fail to satisfy equidistant property thus, mean, SD are not meaningful [21]. Distance between successive response-categories is not uniform and unknown [22] Validity of parametric analyses of Likert-type data is often unclear [23]. Equidistant property demands constant distance between two successive response-categories. Unknown and different distributions of item scores and resultant dimension/test scores make it difficult to interpret X ± Y and to find joint distribution of X ± Y. Addition of two random variables X + Y = Z is meaningful, if P(Z = z ) = P (X= x, Y= z-x) for discrete case and 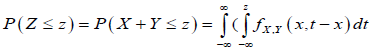 dx for continuous case. Thus, it is necessary to know probability density function (pdf) of each variable being added and their convolution.
Summative scores assigning equal importance to the items and dimensions are not justified due to different values of correlations of item/dimension scores with total score and different factor loadings.
Distribution of scale scores get distorted if “Zero” is taken as an anchor value of Likert items (e.g. MDI, SIP,) etc. Frequent zero responses to an item lowers variance and correlation with the item. Better is to consider anchor values as 1, 2, 3, 4, 5 etc. Decomposition of Likert scores using multipoles for reduced heterogeneity of responses of the respondents/raters was proposed [24], where anchor values were changed suitably before calculation of multipoles moments. Replacement of anchor values by linear transformation, keep nature of generated data invariant.
Summative Likert scores do not consider patterns of getting a particular score. Different responses to different items can generate tied test score for several persons. Thus, the scale fails to discriminate the respondents with tied score.
Different values of K distorts shape of distribution of scores and influence item/test parameters like reliability, validity, more by number of levels than the underlying variable. 4, 5, and 7-point scales of the same items were administered and number of options influenced the psychological distance between options, particularly for the 7-point scale [25]. Studies to find optimum number of response-categories to maximize reliability, validity produced contrasting results.
To find equivalent scores of 5-point and 7-point scales, regression equations, X7 =α1 +β1 X5 and X5 =α2 +β2 X7 were used [26]. However, equating is different from forecasting [27]. Variance XΛ7≠ Variance X7 ).Equated scores by regression equations are not interchangeable.
Proposed methods
Pre-adjustments
Rename anchor values as 1, 2, 3 avoiding zero. Convert each item to be positively related to the test score i.e. higher item score indicates higher level of disability and impairments.
Transforming scores of Likert items and EQ-5D-5Litems in stages proposed so that proposed item scores (Pi ) follows Normal distribution and 1≤ Pi ≤100 [28].
Convert raw score of each Likert item to continuous, monotonic equidistant scores through weighted sum ensuring 5 W5 − 4W4 4 W4 − 3 W3 = 3 W3 − 2W2 = 2W2 −W 1= Constant ≥ for K=5 (say),where positive weights based on frequencies of levels of items are different for different items. If a subject chooses say 4-th response-category, his/her weighted score for the item exceeds the transformed score if he/she had chosen 3rd response category For sample size n, define
 as proportion of responses in j-th level of i-th EQ-5D-5L item.Wij 's are data-driven weights satisfying Wij 's
 and facilitate single value to healthprofile of a person as weighted sum. For example, profile of 1-2-3-4-5 for i-th person
w11)+w22)+3(w33)+4(w44)+5(w55)
Which is different from 5-4-3-2-1 for j-th person? Yj =w11)+w22)+3(w33)+4(w44)+5(w55)
Scores as weighted sum are expected values and continuous [29].
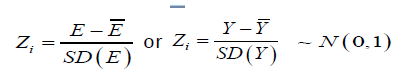
II: Standardize E -scores or Y-scores of each item by
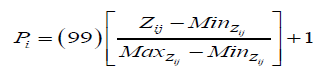
III: Transform ' i Z s to proposed score [1,100] by which follows normal distribution.
Proposed scale score of an individual is the sum of his/her scores in each dimension or sum of P-scores of all items, following normal where variance depends on covariance between pair of P-scores. Scale scores of QoL can also be converted to the proposed P-scores.
Properties
1. Irrespective of item formats, Pi’s in [1,100] are continuous, monotonic, with normality and satisfy desired properties like:
P1: Meaningful arithmetic aggregation of item scores to get scale scores (Pscales)reflecting positions of individuals in the trait continuum.
Pi: Computation of mean, variance and other moments of Pscales
P1:Same range of scores for each item
Benefits of normally distributed Pscales )
Help in parametric analyses, estimation of population mean µ),population variance σ2),testing statistical hypothesis like
H0:µ1=µ2H0: σ12= σ22 σ etc. either for longitudinal data or snap-shot data.
Provide unique ranks to the individuals.
Quantify effect of small change in i-th dimension (δâ?Pi ) to scale score Pscales)by
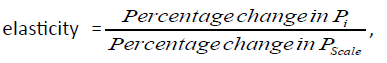 facilitating ranking of the dimensions.
Find responsiveness of the scale in terms of percentage progress/ deterioration of the i-th patient between two successive time periods by
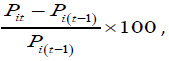 which also indicates effectiveness of a treatment plan. If higher P-scores higher ⇒ disabilities, Pit− P(i-t)>0 indicates progress in t-th period over (t-1)-th
period. Reverse is true for Pit− P(i-t)>0 . Similarly, progress for a group of patients can be assessed where Pt< P(t-1) Testing of significance of progress since ratio of two normally distributed variables follows X2 distribution.H0 : Progress(t+1)over t = 0 may avoid need to find minimal important difference of a scale for comparing changes over time among the group of patients.
Plotting of progress/deterioration of one or a group of patients across time can be used to study progress pattern i.e. responses to treatments from the start.
Help to fit regression equation of DMT on HRQoL and use HRQoL scores as predictor of disabilities after adjusting demographic characteristics, after checking normality of error scores.
- x0of test X and y0 of test Y are equivalent (x0⇔y0) if
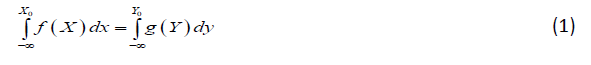
Where f(X) and g(Y) denote pdf of X ~ N (μ1 ,σ1) and ~ N( μ2 ,σ2) i.e. area under the curve f ( x) up to x0 = area of the curve g ( y) up to y0 [30].The equation (1) can be solved using Standard Normal Table. Finding equivalent scorecombinations is possible even if the scales have different number of items or dimensions.
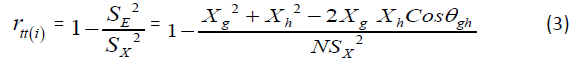
Reliability
Normally distributed P-scores enables estimation of item variance, scale variance and estimation of Cronbach alpha of DMT or HRQoL at population level. Reliability can better be found as per the theoretical definition from single administration [31]. This involves dichotomization of a test/dimension in two parallel g-th and h-th subtests with lengths
 and angle between the two vectors representing the subtests (Cosθgh ). For sample size N, error variance of a dimension is

And reliability of i-th dimension as per theoretical definition is
Equation (3) helps to find battery reliability where scale/battery score is the sum of scores of the dimensions (say m) by:
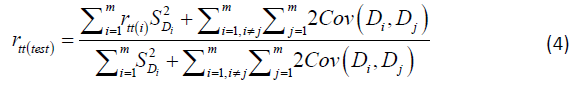
Where SDi denotes sample SD of the i-th dimension.
If battery score is taken as weighted sum of dimensions i.e.Yi= where and wi>0 and
 battery reliability of weighted scores is
Properties
- Test reliability, isomorphic to the theoretical definition is possible.
- If X follows normal, true score of an individual with observed score X0 is estimated by
X0 ± SEM , where SEM = sample SE ,
- Split-half reliability as correlation between two parallel subtests rgh is different from theoretical reliability (rtt) from (3).
- Normally distributed scores help to test H0:rtt(test)=1 which is equivalent to test H0:σx2=σr2 against H0:rtt(test)=1 using test statistic
 and reject H0 if F is large F>Fα,(N-1,N-1))
Validity
A HRQoL scale may have different validity for different DMT. If X and Y are two scales and rxy=0.70 (say), then 0.70 is the validity of X and also of Y. If rxy is still more, two different scales are probably not needed.
The problems of selection of criterion scale with matching dimensions, score ranges, etc. can be avoided by Factorial Validity defined as ratio of the first eigenvalue to the sum of all eigenvalues i.e.

where λ1 is the highest eigenvalue corresponding to the main factor for which the scale was developed. Normally distributed P-scores satisfy assumption of PCA and enable computations of λi’s and component loadings of an item = (the
eigenvector) × √the eigenvalue which can be interpreted as the correlation of the item with the principal component or item validity.
Properties
- Factorial validity is simple to comprehend
- Item validity is given in terms of component loading
- Sum of item validities ≠Scale validity.
- Eigenvalue ≈0 indicates existence of multicolinearity among the items
Classifications
Classifications of individuals to a finite number of non-overlapping classes are often done by a recommended categorization of total scores. However, boundary points need to ensure that members within a class/cluster are similar (small within-group variance) and members between classes/clusters are dissimilar (high between-group variance). Efficiency of classification needs to be evaluated. Quartile clustering helps in classification of individuals in four mutually exclusive quartiles Q1, Q2 , Q3 , Q4 assigning equal probability to each quartile/class i.e.
Conclusion
The proposed method generating normally distributed scores contributes to improve scoring of instruments Relating to assessment of disabilities due to various diseases and HRQoL, avoiding limitations of summative Likert scores. P-scores facilitate better arithmetic aggregation, meaningful comparisons,unique ranks, analysis under parametric set up for estimation of population parameters and statistical testing, classification, and integration of various scales. In addition, proposed scores also help to use HRQoL-scores as predictor of disabilities after adjusting demographic characteristic and compute reliability, battery reliability, validity, item validity, responsiveness, etc. in better fashion. Health care professionals and researchers can take advantages of the proposed method to convert ordinal discrete scores to normally distributed continuous scores with desired properties, including assessment and testing of responsiveness and evaluating psychometric parameters. Future studies with longitudinal multi-data set may be undertaken for generalization of findings along with better psychometric properties of the proposed transformation for improved patient care and clinical outcomes.
REFERENCES
- Wiebe S, Guyatt G, Weaver B, Matijevic S, Sidwell C (2003)Comparative responsiveness of generic and specific quality-of-life instruments.J Clin Epidemiol 56:52-60.
Indexed at, Google Scholar, Crossref
- Finn R H (1972) Effects of some variations in rating scale characteristics on the means and reliabilities of ratings.Educ Psychol Meas 32:255-265.
Indexed at, Google Scholar, Crossref
- Simkovic M, Trauble B (2019) Robustness of statistical methods when measure is affected by ceiling and/or floor effect.PLoS ONE14: e0220889.
Google Scholar, Crossref
- Harpe S E (2015) How to analyze like art and other rating scale data. Currents in Pharmacy Teaching and Learning 7: 836-850.
Indexed at, Google Scholar, Crossref
- Hunt SM, McEwen J, McKenna SP (1985) Measuring health status: a new tool for clinicians and epidemiologists. J R Coll Gen Pract 35: 185-188.
Google Scholar
- Devlin N, Parkin D, Janssen B (2020) Analysis of EQ-5D Profiles. In: Methods for Analyzing and Reporting EQ-5D.
Google Scholar, Crossref
- Redaelli A, Stephens JM, Laskin BL (2003)The burden and outcomes associated with four leukemia’s: AML, ALL, CLL, and CML. Expert Rev Anticancer Ther3: 311-329.
Google Scholar, Crossref
- De Haan R, Horn J, Limburg M. (1993) A comparison of five stroke scales with measures of disability, handicap, and quality of life. Stroke 24: 1178-1181.
Google Scholar, Crossref
- Duncan, Pamela W (1997) Stroke Recovery.Topics in Stroke Rehabilitation4: 51-58.
Indexed at, Google Scholar, Crossref
- Essink-Bot ML, Krabbe PF, Bonsel GJ, Aaronson NK. (1997) an empirical comparison of four generic health status measures. The Nottingham Health Profile, the Medical Outcomes Study 36-item Short-Form Health Survey, the COOP/WONCA charts, and the EuroQol instrument.Med Care35: 522-537.
Indexed at, Google Scholar, Crossref
- Pollard B, Johnston M (2001) Problems with the Sickness Impact Profile a theoretically based analysis and a proposal for a new method of implementation and scoring. Social Sci Med 52: 921-934.
Indexed at, Google Scholar, Crossref
- Heo S, Moser DK, Riegel B(2005) Testing the psychometric properties of the Minnesota Living with Heart Failure questionnaire.Nurs Res54: 265-272.
Indexed at, Google Scholar, Crossref
- Gao F, Luo N, Thumboo (2004)does the 12-item General Health Questionnaire contain multiple factors and do we need them?Health Qual Life Outcomes2:63.
Google Scholar, Crossref
- Fiorin BH, Moreira RSL, Filho BL (2020) Validity and reliability of the dimensional assessment scale after myocardial infarction. RevistaEletronica de Enfermagem 1-8.
Indexed at, Google Scholar, Crossref
- Hofer S, Saleem A, Stone J, Thomas R, Tulloch H (2012) The Mac New Heart Disease Health-Related Quality of Life Questionnaire in patients with angina and patients with ischemic heart failure. Value Health 15: 143-150.
Indexed at, Google Scholar, Crossref
- Singh A, Crockard HA (2001) Comparison of Seven Different Scales used to Quantify Severity of Cervical Spondylotic Myelopathy and Post-Operative Improvement. Jr Outcome Measurement 5: 798-818.
Indexed at, Google Scholar
- Jette AM, Haley SM, Coster WJ (2002) Late life function and disability instrument: I. Development and evaluation of the disability component. J Gerontol A Biol Sci Med Sci. 57: M209-M216.
Indexed at, Crossref
- Lowe Derek, Grady O, John G, McEwen, James and Williams, Roger (1990) Quality of life following liver transplantation: a preliminary report. J Royal College of Physicians of London24: 43-46.
Indexed at, Google Scholar
- Gu Y, Wen Q, Wu D (1995) How Often Is Often? English Language Teaching5: 19-35.
Google Scholar
- Edinger JD, Fins AI, Glenn DM (2000) Insomnia and the eye of the beholder: Are there clinical markers of objective sleep disturbances among adults with and without insomnia complaints? J Consult Clin Psychol 68: 586-593.
Indexed at, Google Scholar, Crossref
- Gail MS, Artino AR (2013) Analyzing and interpreting data from likert-type scales. J grad med edu 5:541-542.
Indexed at, Google Scholar, Crossref
- Munshi Jamal (2014) A Method for Constructing Likert Scales. SSRN Electronic Journal. 10.2139/ssrn.2419366.
Indexed at, Google Scholar
- Lantz B (2013) Equidistance of Likert-Type Scales and Validation of Inferential Methods Using Experiments and Simulations. Elec J Bus Res Met 1: 16-28.
Indexed at, Google Scholar
- Lipovetsky Stan, Conklin Michael (2018) Decreasing Respondent Heterogeneity by Likert Scales Adjustment via Multipoles. Stats1: 169-175.
Indexed at, Google Scholar, Crossref
- Wakita T, Ueshima N, Noguchi H (2012) Psychological distance between categories in the Likert scale: Comparing different numbers of options.Edu Psychological Meas 72: 533-546.
Indexed at, Google Scholar, Crossref
- Colman, Andrew, Norris, Claire Preston, Carolyn (1997) Comparing Rating Scales of Different Lengths: Equivalence of Scores from 5-Point and 7-Point Scales. Psychological Reports 80.
Google Scholar
- Livingston SA (2004) Equating test scores (without IRT).Princeton NJ: ETS.
Indexed at, Google Scholar
- Chakrabartty Satyendra Nath (2020) Combining Likert items with Different number of Response Categories. Proc Eng Sci 2: 311-322.
Google Scholar
- Chakrabartty S N (2021) Alternate method of scoring Euroqol Five-Dimensional Scales. Health Science journal, 15: 1-8.
Google Scholar
- Chakrabartty Satyendra Nath (2021b) Integration of various scales for measurement of insomnia, Res MethodsMed Health Sci.
Indexed at, Google Scholar, Crossref
- Chakrabartty, Satyendra Nath (2020b) Reliability of Test Battery. Meth Innov 13:1-8.
Google Scholar
Citation: Chakrabartty SN (2022) Disability and Quality of Life . Health Sci J. Vol. 16 No.12: 989.

