Keywords
Spatial accessibility; Health care; Medical geography; GIS; Greece
Introduction
Research that ties geography and medicine together has long been pursued [1]. Perhaps the earliest studies are those tracking the diffusion of infectious disease, but research that highlights spatial imbalances in various health-related ailments is not new and continues to accumulate today [2]. Health Geography can provide a spatial understanding of a population's health, the distribution of disease in an area, and the environment's effect on health and disease. It also deals with accessibility to health care and spatial distribution of health care providers and diseases [3].
Access is a multidimensional concept that describes people’s ability to use health services when and where they are needed [4]. It mainly refers to the relationship between attributes of service need and the characteristics of service delivery systems. On the other hand, accessibility focuses on the geographical location of services in relation to population in need [5]. With respect to health services, which are services whose aim is to improve health, a critical question central to any health care planning department or organization is: “Are services located in areas of high need?”. Regardless of how it is measured, potential accessibility to [public] health services is distributed unevenly over space [6]. This, unfortunately, reflects the way most health services are provided. GIS provide methods and tools for viewing geographical variation in accessibility. In this respect, they can reveal differential accessibility patters, which can be further, analyzed and investigated [7].
Health Care and Disease Geography are considered subfields of Medical Geography. Many of the concepts underlying the development of the field of medical geography were already psresent in the medical writings of Aristotle, Plato and Hippocrates who first published their observations regarding geography and human or animal medical problems [8,9]. However, it wasn’t until researchers like Samuel Mitchell (1799 – Samuel Mitchell – An Outline on Medical Geography) and Henry Marshall (1832 – Henry Marshall - Disease Geography) brought the two topics and teachings together to a single medical philosophy and system [10].
This paper aims to show that with the methods and tools offered by GIS to the field of health services research, it is possible to create maps and spatial interpretations that are not complex and do not require special data or systems. Yet, they provide insight into the investigation and improvement of health-related policy and planning issues [11]. As an indicative case study we analyze and evaluate the Greek Public Health Care System during the 1997 - 2007 decade. More specifically, health care supply, demand and service location quotients (LQ) are calculated for the fifty-three prefectures of Greece on a yearly basis. Data used to formulate the above quotients were provide by the Hellenic Statistical Service of Greece and refer to total population, number of hospitals, number of hospital beds and number of patients per prefecture.
Disease and health care geographies – medical geography
Medical or health geography is an area of research that incorporates geographic techniques into the study of health and the spread of diseases as the distribution of health services. To this end, it aims to provide an understanding of health problems and improve the health of people based on the various geographic factors influencing them. As a consequence, mapping plays a huge role in the field [12]. Maps are created to show for example current issues like the index of pain or Google Flu Trends across the United States or historic outbreaks of things like the 1918 influenza. Furthermore, they visually study factors, which can be considered to correlate with observed random, uniform or clustered patterns at any given time.
Such studies are important because they share implications on a country’s population growth and health problems tendencies. Local governments can then consider these factors when planning and/or determining the best use of public funds. It was mid- 1800s when John Snow’s without realizing the role he might play in the development of the field used mapping to find the source of cholera in London. He thus defined the earliest and most famous example of medical geography after which a plethora of quantitative techniques of geographical analysis found their place in public health planning.
Although health care is an undoubted public good, in geographical terms it is not equally available to all individuals [13,14]. To this end, demand for public health services which is continuously distributed across space, is usually characterized by inequalities of access in terms of the practicality of using them. The location of health care facilities depends largely on the nature of the health care system in operation, and will be heavily influenced by historical factors due to the heavy investment costs in facilities such as hospitals and surgeries [15,16]. Access to primary care is therefore a very significant component of access to the whole system. In a 'planned' health care system, we would expect the distribution of facilities to fairly closely match the distribution of demand. By contrast, a market-oriented system might mirror the locational patterns that we find in other business sectors, such as retail location. We may attempt to measure either potential accessibility or revealed accessibility, but we should note that there is a well-established pattern of utilisation increasing with access, i.e. people who have easier access to health care use it more often.
Assessing provider and service availability levels in an area can make an important contribution to studies of health care access. In such a framework, geographical analysis methods and techniques can be utilized in order to identify inequalities in facilities or funds distribution and/or reallocate of health care resources. Another focus of medical geography relates to the spatial analysis of population-based measures of access, health care delivery, and resource allocation. These issues are particularly relevant to policymakers, health services researchers, and planners. Examples of these types of studies include:
• Studies of physician supply and demand by region or area.
• Patient origin and geographic access studies.
• Small-area analyses that evaluate geographic variations in medical outcomes and practice patterns.
• Marketing studies that analyze geographic variations in patient flows.
Effective cartography and map interpretation have been important elements in the evolution of modern medical geography from both the disease ecology and spatial analysis perspectives [17]. The widespread adoption of maps and other geographic displays as analytic and decision-support tools has been fueled recently by the increased availability of software and databases for personal computers. These graphical displays can be powerful tools that reveal underlying relationships or processes. Maps and cartographic analyses are appearing more often in health services research journals and monographs, and their utility and ease of use are demonstrated here [18]. Atlases and collections of maps relevant to health are now available as reference sources and as guides for policymaking. There are thousands of data sets that can be used with hundreds of commercially available mapping software programs.
This publication leads the reader through several commonly used methods for the production of maps and visual displays that can be used for policy analysis, research, and/or planning purposes. By bridging the gap between the development and use of the tools and techniques of geography for health policy analysis, health services research, and health care planning, this effort incorporates both demonstrations and interpretations of applications using real-world examples. These applications reflect both the disease ecology and spatial analysis aspects of the field of medical geography, depicting the utility of the analytic and summary capabilities available to researchers, planners, and analysts.
Geographic information systems
A geographic information system (GIS) is a system designed to capture, store, manipulate, analyze, manage, and visualize all types of geographically referenced data. Nowdays, the acronym GIS is also used to mean geographical information science or geospatial information studies; In a simplifying analogy, GIS can be thought of as the merging of, geostatistical analysis, and geodatabases and cartography. The term describes any information system that stores, edits, analyzes, integrates, displays and shares geographic information in a decision making context.
Related by accurate spatial information, an incredible variety of real-world and projected past or future data can be analyzed, interpreted and represented to facilitate education and decision making [19]. This key characteristic of GIS has begun to open new avenues of scientific inquiry into behaviors and patterns of previously considered unrelated real-world information [20].
Given the vast variety of quantitative geographical analysis techniques that have been developed over the last fifty years, any summary or review can only cover the subject to a limited depth [21]. This is a rapidly changing field, and GIS packages are increasingly including analytical tools as standard built-in facilities or as optional toolsets, add-ins or 'analysts'. In many instances such facilities are provided by the original software suppliers (commercial vendors or collaborative non commercial development teams), whilst in other cases facilities have been developed and are provided by third parties. Furthermore, many products offer software development kits (SDKs), programming languages and language support, scripting facilities and/or special interfaces for developing one's own analytical tools or variants. The website Geospatial Analysis as well as the associated book and ebook provide a reasonably comprehensive guide to the subject. The impact of these alternative paths to perform spatial analysis create a new dimension to geographical thinking or "geographical intelligence" which, when delivered via intranet, significantly enhances access to operations and procedures not usually attached to this type of information.
The location quotient
Florence (1939) introduced the use of the location quotient as a measure of geographic concentration within a region. The Location Quotient (LQ) is a valuable way of revealing what makes a particular region “unique” in comparison to the national average. Essentially, It can quantify how concentrated a particular phenomenon, characteristic, occupation, or group is in a region as compared to the nation [22]. In this respect, an “Area LQ” is formulated by dividing the areal concentration by the national concentration measuring the extent to which specific areas depart from the national average norm. It can be calculated using Equation (1).
 (1)
(1)
Where Xi = value of variable X in area i, Yi = value of variable Y in area i, X = regional value of variable X, Y = regional value of variable Y. High values for (LQ > 1) indicate a high degree of concentration of a particular variable in an area. Values LQ < 1 indicate low concentrations and values of LQ = 1 indicate the distribution is the same as the national average [23].
Mapping spatial indices
Thematic mapping involves mapping of feature attribute characteristics (e.g. census variables like median household income). Choropleth (shaded area) maps are the most widely produced type of thematic maps by urban planners. Census data combined with geographic information systems analysis makes it possible for policy officials to better understand unmet needs. GIS applications are well known and used in human, health and social services although it is a rapidly growing area [24,25]. This paper discusses how health service program delivery and planning can benefit from spatial analysis methods and GIS.
Case study: mapping disease and health care in Greece
We use Geographic Information Systems to analyze and evaluate the Greek Public Health Care System during the 1997 - 2007 decade. More specifically, health care supply, demand and service location quotients (LQ) were calculated for the fifty-three prefectures of Greece on a yearly basis. Data used to formulate the above quotients were provide by the Hellenic Statistical Service of Greece and refer to total population, number of hospitals, number of hospital beds and number of patients per prefecture. Quantifying provider and service availability levels in an area can make an important contribution to planning of health care access. In such a framework, geographical analysis methods and techniques are utilized in order to identify inequalities in facilities or funds distribution and/or reallocate of health care resources.
More specifically, following such a methodological process we can define:
• Areas with lower than average supply levels
• Areas with higher than average illness levels
• Areas where obsverved levels of demand don’t meet those of supply
In this manner, problematic regions can be identified and priorities set in order to optimize the allocation of available resources for health services.
Data
The Hellenic Statistical Service supplied the required data of the 1997 – 2007 decade. They consist of total population P, number of patients A, number of hospitals H and number of hospital beds B recorder per year and prefecture.
In Table 1 totals at the country level and per year of the study period are displayed while in Tables 2 and 3 the per year difference percentages and cumulative percentages with respect to 1997 are summarized.
Table 1: Health care demand and supply data per year.
| Year |
Population |
Hospitals |
H-beds |
Patients |
| 1997 |
10.746.326 |
344 |
51.629 |
1.452.132 |
| 1998 |
10.810.106 |
341 |
46.515 |
1.544.381 |
| 1999 |
10.863.221 |
339 |
51.404 |
1.598.649 |
| 2000 |
10.905.647 |
337 |
51.5 |
1.688.847 |
| 2001 |
10.935.221 |
336 |
52.276 |
1.736.127 |
| 2002 |
10.970.656 |
320 |
52.105 |
1.823.163 |
| 2003 |
11.008.311 |
322 |
51.479 |
1.894.496 |
| 2004 |
11.042.572 |
318 |
51.455 |
1.974.277 |
| 2005 |
11.084.660 |
317 |
52.511 |
2.023.998 |
| 2006 |
11.019.737 |
317 |
52.486 |
2.065.757 |
| 2007 |
11.647.946 |
313 |
53.888 |
2.118.760 |
Table 2: Health care demand and supply difference percentage per year.
| Year |
Population |
Hospitals |
H-beds |
Patients |
| 1997 |
0 |
0 |
0 |
0 |
| 1998 |
0,59% |
-0,87% |
-9,91% |
6,35% |
| 1999 |
0,49% |
-0,59% |
10,51% |
3,51% |
| 2000 |
0,39% |
-0,59% |
0,19% |
5,64% |
| 2001 |
0,27% |
-0,30% |
1,51% |
2,80% |
| 2002 |
0,32% |
-4,76% |
-0,33% |
5,01% |
| 2003 |
0,34% |
0,63% |
-1,20% |
3,91% |
| 2004 |
0,31% |
-1,24% |
-0,05% |
4,21% |
| 2005 |
0,38% |
-0,31% |
2,05% |
2,52% |
| 2006 |
-0,59% |
0,00% |
-0,05% |
2,06% |
| 2007 |
5,70% |
-1,26% |
2,67% |
2,57% |
Table 3: Health care demand and supply cumulative difference percentage per year.
| Year |
Population |
Hospitals |
H-beds |
Patients |
| 1997 |
0 |
0 |
0 |
0 |
| 1998 |
0,59% |
-0,87% |
-9,91% |
6,35% |
| 1999 |
1,08% |
-1,46% |
0,61% |
9,87% |
| 2000 |
1,48% |
-2,05% |
0,79% |
15,51% |
| 2001 |
1,75% |
-2,35% |
2,30% |
18,31% |
| 2002 |
2,07% |
-7,11% |
1,97% |
23,32% |
| 2003 |
2,41% |
-6,48% |
0,77% |
27,23% |
| 2004 |
2,73% |
-7,72% |
0,72% |
31,45% |
| 2005 |
3,11% |
-8,04% |
2,78% |
33,96% |
| 2006 |
2,52% |
-8,04% |
2,73% |
36,03% |
| 2007 |
8,22% |
-9,30% |
5,40% |
38,59% |
It is obvious that while population and especially the number of patients are steadily increasing during the study decade the same does not account for hospital beds and hospitals. Actually, the number of hospital is the only parameter with a clear declining tendency. Total number of hospital beds increases but with the lowest observed rate (Figure 1).
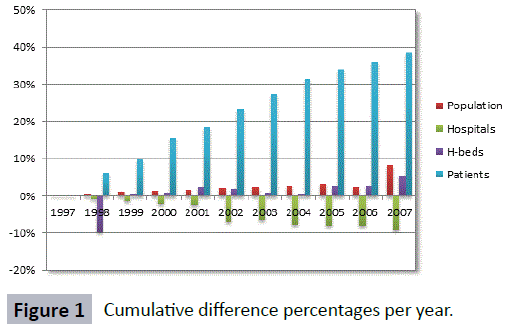
Figure 1: Cumulative difference percentages per year.
The calculated location quotients are mapped by year and prefecture in order to reveal spatial variations. Here quotients for the distribution of Hospital beds and Population are mapped by prefecture. According to the proposed methodological approach the demand, supply and service location quotients are calculated for every prefecture throughout the decade 1997 – 2007 according to Equation 1 comparing each prefecture to the country.
Aiming to optimally visualize spatial and temporal variations in parameter values five (5) range value categories were defined for each location quotient (Table 4). A different color is assigned to each category in such a manner that the degree of variation intensity can be clearly identified on the maps.
Table 4: Location Quotient (LQ) categories.
| Color |
Value range |
Category |
| |
1,20 ≤ LQ |
Very intense |
| |
1,05 ≤ LQ < 1,20 |
Intense |
| |
0,95 ≤ LQ < 1,05 |
Average |
| |
0,80 ≤ LQ < 0,95 |
Moderate |
| |
0,00 ≤ LQ < 0,80 |
Very moderate |
The new census digital administrative maps of Greece issued by the Hellenic Statistical Service provided the basis for geographical visualization and analysis of healthcare data.
According to the above, health care location quotients of demand, supply and service were calculated and mapped by year and prefecture in order to reveal their spatial variations.
Supply
The Health Care Supply Location Quotient HCSLQt i where t is the year with t = 1997 … 2007 and i is the prefecture id with i = 1 … 53, was calculated as follows:
 (2)
(2)
Where,HBt iis the number of Hospital Beds and Pt i is the total population at every prefecture i for year t.
Statistical analysis of results presented in Table 5 shows that there is an average of approximately 69% of the countries prefectures that throughout the 1997 – 2007 decade are falling significantly short in terms of health care supply.
Table 5: Health Care Supply LQ category prefecture membership per year of study.
| Supply |
<= 0.8 |
<= 0.95 |
<= 1.05 |
<= 1.20 |
> 1.20 |
SUM |
| 1996 |
37 |
5 |
1 |
4 |
6 |
53 |
| 1997 |
34 |
1 |
2 |
3 |
13 |
53 |
| 1998 |
34 |
5 |
0 |
4 |
10 |
53 |
| 1999 |
39 |
1 |
3 |
4 |
6 |
53 |
| 2000 |
39 |
1 |
3 |
4 |
6 |
53 |
| 2001 |
37 |
3 |
4 |
3 |
6 |
53 |
| 2002 |
37 |
3 |
2 |
4 |
7 |
53 |
| 2003 |
38 |
3 |
3 |
2 |
7 |
53 |
| 2004 |
38 |
3 |
1 |
5 |
6 |
53 |
| 2005 |
36 |
5 |
2 |
4 |
6 |
53 |
| 2006 |
34 |
8 |
3 |
2 |
6 |
53 |
| 2007 |
33 |
5 |
4 |
3 |
8 |
53 |
However, their spatial pattern as depicted in Figures 2-5 differs significantly each year (dark blue polygons). In this respect, from the geographically compact cluster in Northern Greece for year 1997 and the alarmingly expanding instances of 2000 and 2004, year 2007 has to show slight improvement in certain areas such of contemporary Greece.
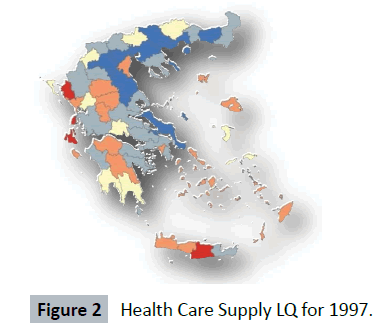
Figure 2: Health Care Supply LQ for 1997.
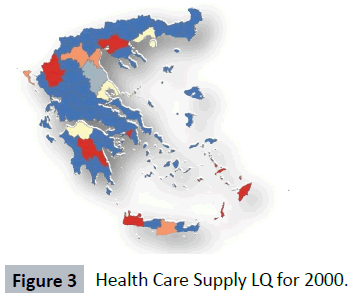
Figure 3: Health Care Supply LQ for 2000.
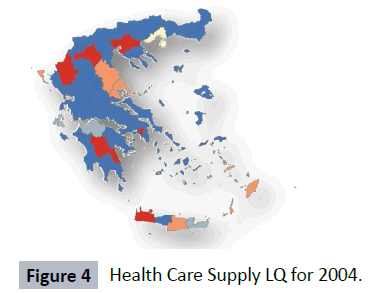
Figure 4: Health Care Supply LQ for 2004.
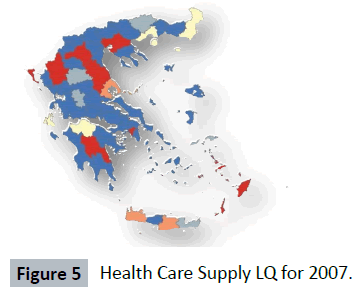
Figure 5: Health Care Supply LQ for 2007.
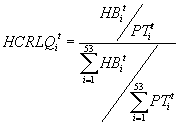
Demand
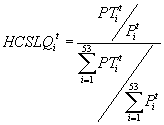
In a similar way, the Health Care Demand Location Quotient HCDLQi t where t is the year with t = 1997 … 2007 and i is the prefecture id with i = 1 … 53, was calculated as follows:
 (3)
(3)
Where, PTt iis the number of Patients and Pt i is the total population at every prefecture i for year t.
The statistical analysis of results presented in Table 6 shows that there is an average of approximately 18% of the countries prefectures that throughout the 1997 – 2007 decade hold a disconcerting lead in terms of health care demand. Another 34% of the countries prefectures without exceling in patients’ percentages certainly show increased disease levels.
Table 6: Health Care Demand LQ category prefecture membership per year of study.
| DEMAND |
<= 0.8 |
<= 0.95 |
<= 1.05 |
<= 1.20 |
> 1.20 |
SUM |
| 1996 |
7 |
14 |
11 |
15 |
6 |
53 |
| 1997 |
19 |
3 |
9 |
7 |
15 |
53 |
| 1998 |
6 |
8 |
11 |
16 |
12 |
53 |
| 1999 |
6 |
11 |
11 |
14 |
11 |
53 |
| 2000 |
3 |
12 |
9 |
20 |
9 |
53 |
| 2001 |
2 |
14 |
14 |
14 |
9 |
53 |
| 2002 |
3 |
13 |
9 |
18 |
10 |
53 |
| 2003 |
4 |
11 |
11 |
19 |
8 |
53 |
| 2004 |
4 |
11 |
12 |
19 |
7 |
53 |
| 2005 |
4 |
10 |
13 |
19 |
7 |
53 |
| 2006 |
7 |
10 |
8 |
23 |
5 |
53 |
| 2007 |
6 |
7 |
9 |
16 |
15 |
53 |
Both their spatial pattern and tendency as depicted in Figures 6-9 show signs of spatial expansion for each case study year (dark red polygons). More specifically, from the geographically dispersed distribution of high demand areas all over Greece for years 1997, 2000 and 2004 a slightly more clustered pattern evolves for year 2007 in certain areas of continental Greece.
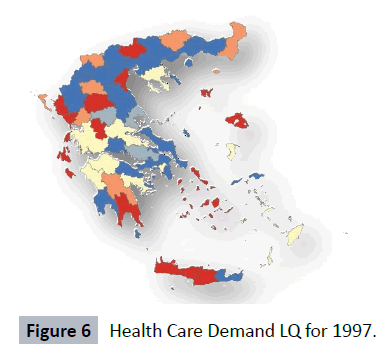
Figure 6: Health Care Demand LQ for 1997.
Figure 7: Health Care Demand LQ for 2000.
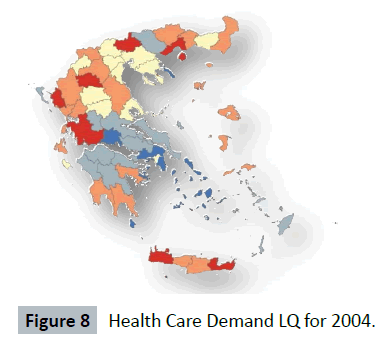
Figure 8: Health Care Demand LQ for 2004.
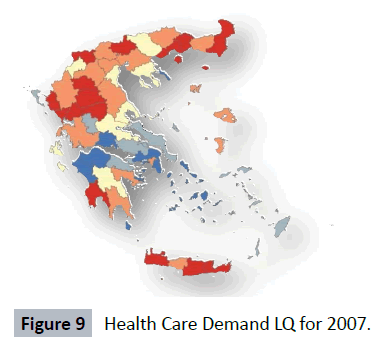
Figure 9: Health Care Demand LQ for 2007.
Nearly 50% of the Crete, Epirus, Thessaly and East Macedonia – Thrace regions are in the alarm zone in terms of health care demand. Metropolitan areas such as Thessaloniki, Larisa, Ioannina and the Northern Aegean Islands need further attention mainly due to their stability in terms of problematic place taking in the diachronic demand scale.
Service
We measure health care service by a “patients to hospital beds” ratio. In this respect, the Health Care Service Location Quotient HCRLQt i where t is the year with t = 1997 … 2007 and i is the prefecture id with i = 1 … 53, is calculated as follows:
 (4)
(4)
Where, HBt i is the number of Hospital Beds and PTt i is the number of Patients at every prefecture i for year t.
Statistical analysis of computations shown in Table 7 exhibit an increased, compared to supply, average of approximately 72% of the countries prefectures that throughout the 1997 – 2007 decade are falling significantly short in terms of health care service.
Table 7: Health Care Service LQ category prefecture membership per year of study
| SERVICE |
<= 0.8 |
<= 0.95 |
<= 1.05 |
<= 1.20 |
> 1.20 |
SUM |
| 1996 |
37 |
5 |
1 |
4 |
6 |
53 |
| 1997 |
38 |
2 |
1 |
6 |
6 |
53 |
| 1998 |
36 |
3 |
3 |
1 |
10 |
53 |
| 1999 |
37 |
5 |
3 |
3 |
5 |
53 |
| 2000 |
38 |
5 |
0 |
4 |
6 |
53 |
| 2001 |
38 |
5 |
1 |
4 |
5 |
53 |
| 2002 |
40 |
2 |
2 |
2 |
7 |
53 |
| 2003 |
40 |
2 |
2 |
4 |
5 |
53 |
| 2004 |
38 |
4 |
2 |
3 |
6 |
53 |
| 2005 |
37 |
5 |
3 |
2 |
6 |
53 |
| 2006 |
38 |
5 |
1 |
3 |
6 |
53 |
| 2007 |
36 |
6 |
1 |
2 |
8 |
53 |
In the sense that through appropriate politics such realizations can lead to faster improvement of the Greek Health Care System, this 3% difference between supply and service levels can be considered as one of the main findings of this work.
A more detailed observation as well as visual analyses of patterns presented in Figures 10-13 concludes that recorded health care service levels are significantly low throughout the entire country.
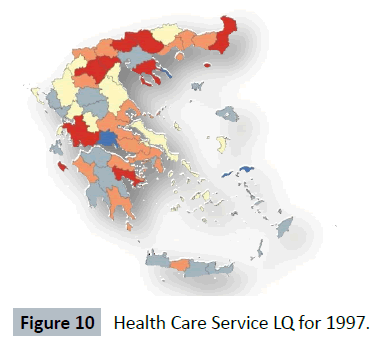
Figure 10: Health Care Service LQ for 1997.
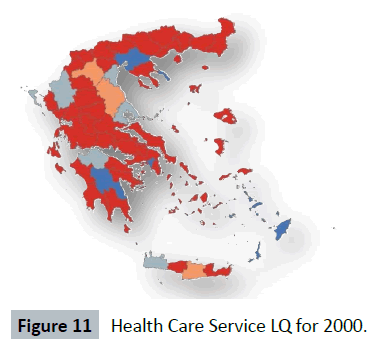
Figure 11: Health Care Service LQ for 2000.
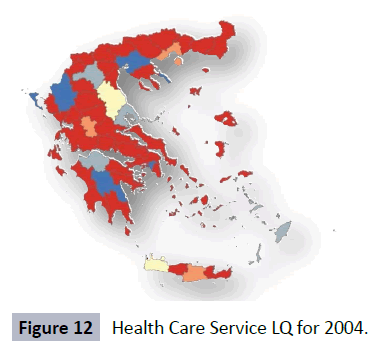
Figure 12: Health Care Service LQ for 2004.
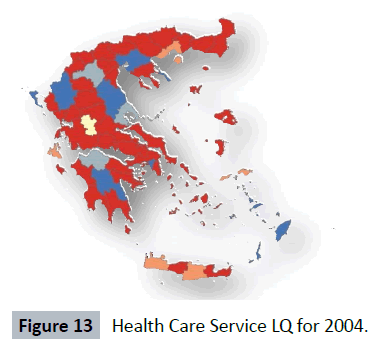
Figure 13: Health Care Service LQ for 2004.
The majority of the Greek Regions are underserved the only exceptions being the prefectures of Athens, Thessaloniki, Larisa, Ioannina, Arcadia and Dodecanese. This can be attributed to the fact that in the capital cities of these prefectures is established almost 90% of major hospitals and medical schools of Greece.
Concluding Remarks
This application of GIS in health services analysis and planning was designed to illustrate how geostatistic and cartographic methods can be applied to respective datasets. Most of the techniques introduced here do not demand a substantial background in either geography or statistics. Through the utilization of basic GIS mapping capabilities we to show that with what the technology of GIS offers to the field of health services research, it is possible to create maps and spatial interpretations that are not complex and do not require special data, personnel or systems. Yet, they provide significant insight into the investigation, assessment and improvement of health-related policy and planning issues.
Further analysis using GIS such as overlay or multilayer analysis can be carried out to identify unobserved areas of the country according to more than one criterion (variable). Identifying spatial clustering patterns of demand and supply in regions using GIS will be driven by two analytical motivations: (1) to examine the variation of demand and supply in spatial terms (shape, size, morphology), and; (2) to examine the extend to which demand and supply conditions differ inside and outside of “clusters”. If these patterns are consistently present in (number of) regions, we can establish strong empirical evidence to better depict the actual distribution of demand and supply in contemporary Greece!
9496
References
- Aday LA, Andersen RM (1981) Equity of access to medical care: a conceptual and empirical overview. Medical care 19: 4-27.
- Barrett A (1986) “Medical geography: concept and definitions” in Medical Geography: Progress and Prospect edited by M. Paccione, Routledge Revivals, New York, United States. 1-34.
- Cromley EK, McLafferty SL (2002) “GIS and Public Health”, The Guilford Press. New York, USA.
- John F, Rost K, Warren J (2000) Comparing alternative methods of measuring geographic access to health services. Health Serv Outcomes Res Methodol 1: 173-184.
- Grekousis, George, Photis YN (2014) Analyzing high-risk emergency areas with GIS and neural networks: The case of Athens, Greece. Prof Geogr 66: 124-137.
- Haithcoat, Timothy, Warnecke L, Nedovic-Budic Z (2001) Geographic information technology in local government: Experience and issues. The municipal year book 2001: 47-57.
- Horst, Michael A, Andrew SC (2010) "Observing the spread of common illnesses through a community: using Geographic Information Systems (GIS) for surveillance." J Am Board Fam Med 23: 32-41.
- Ibrahim, Sa’ad (2013) "Comparing Alternative Methods of Measuring Geographic Access to Health Services: An Assessment of People’s Access to Specialist Hospital in Kebbi State." AJIS 2: 109.
- Kitron U, Kazmierczak JJ (1997) Spatial analysis of the distribution of Lyme disease in Wisconsin. Am J Epidemiol 145: 558-566.
- Kontodimopoulos N, Nanos P, Niakas D (2006) Balancing efficiency of health services and equity of access in remote areas in Greece. Health Policy 76: 49-57.
- Koutelekos J, Photis Y N, Manetos P (2007) “Geographic Information Analysis and Health Infrastructure”, Health Sci J 1: 53-62.
- Koutelekos J, Photis YN, Milaka K, Bessa N, Manetos P (2008) “Primary care clinic location decision making and spatial accessibility for the Region of Thessaly”, Health Sci J 2: 20-24.
- Krieger N (2003) Place, space, and health: GIS and epidemiology. Epidemiology 14: 384-385.
- Kwofie, Mayer K (1976) "A spatio-temporal analysis of cholera diffusion in Western Africa." Econ Geogr 52: 127-135.
- Luo, Wei, Wang F (2003) "Measures of spatial accessibility to health care in a GIS environment: synthesis and a case study in the Chicago region." Environ Plan B - Plan Des 30: 865-884.
- Meyer SP (2010) A geographic assessment of ‘total’ health care supply in ontario: compnlementary and alternative medicine and conventional medicine. Can Geogr-Geogr Can 54: 104–122.
- Openshaw, Stan (1990) "Spatial analysis and geographical information systems: a review of progress and possibilities." Geogr info sys urban regional plan 17: 153-163.
- Photis, Yorgos N, Grekousis G (2012) Locational planning for emergency management and response: An artificial intelligence approach. Int J Sustain DevPlann 7: 372-384.
- Queralt, Magaly, Witte AD (1998) A map for you? Geographic information systems in the social services. Social Work 5: 455-469.
- Robinson, Guy M (1998) Methods and techniques in human geography. John Wiley & Son Ltd.
- Rushton G (2003) Public health, GIS, and spatial analytic tools. Annu Rev Public Health 24: 43-56.
- Vandoros S, Hessel P, Leone T, Avendano M (2013) "Have health trends worsened in Greece as a result of the financial crisis? A quasi-experimental approach." Eur J Pub Health 5: 727-731.
- Walter SD (1992) The analysis of regional patterns in health data. I. Distributional considerations. Am J Epidemiol 136: 730-741.
- Wheeler, Dennis (2013) Statistical techniques in geographical analysis. Routledge.
- Yang DH, Goerge R, Mullner R (2006) Comparing GIS-based methods of measuring spatial accessibility to health services. J Med Syst 30: 23-32.

