Keywords
Cost analysis; Cancer; Health care cost; Cost of illness; Health spending
Introduction
Cancer is the leading cause of death worldwide, responsible for 8.2 million deaths in 2012 [1,2] with increasing numbers of new cases in the past years. There were 14 thousand new cases of cancer and 32.6 million people living with cancer in 2012 (within 5 years of diagnosis) [3]. Global life expectancy for both sexes increased from 65.3 in 1990 to 71.5 years in 2013, while the number of deaths increased from 47.5 million to 54.9 million over the same interval [2].
The economies of Latin America and the Caribbean are growing rapidly, and the standard of living is improving. This scenario has also ensued sedentary lifestyles, unhealthy dietary habits, smoking, alcohol consumption, environmental carcinogenic pollutants, sun exposure, urbanization, and population aging. The increase of life expectancy and of the population with 60 years old and older accounted for a higher incidence of cancer in developing countries. More than 60% of cancer cases occur in Africa, Asia, Central America and South America, and 70% of cancer deaths worldwide occur in these regions. WHO (The Global Economic Burden of Noncommunicable Diseases) estimated that these numbers may increase further yet because of lack of early detection and poor access to treatment.
In 2013, more than 190 thousand Brazilians died of cancer [2] and 596 thousand new cases are expected for 2016, including cases of non-melanoma skin [4]. The non-melanoma skin cancer (182 thousand new cases) is the most frequent in the Brazilian population, followed by prostate tumors (69 thousand), female breast cancer (57 thousand), colon and rectum (33 thousand), lung (27 thousand), stomach (20 thousand) and cervical uteri (15 thousand) [4].
The global economic cost of new cancer cases in 2009, including medical and non-medical costs, productivity losses, and the cost of cancer research, was estimated to be at least US$286 billion [5]. The current health expenditure in Brazil is approximately 9.5% of the GDP per capita. WHO data show US $ 1,085 spent in health per capita in 2013 in Brazil, 48.2% of these costs are government costs. The USA (United States of America) was the country with the highest health expenditure in the world, with annual spending of US$ 9,146 per capita in the same period, representing 17.1% of the GDP [6].
The estimated economic impact of cancer in the Brazilian health system is a growing concern, especially nowadays with increased mortality and incidence of neoplasms in Brazil.
The aim of the study was to estimate the economic impact of cancer in the Brazilian health system from 2010 to 2015 and to evaluate this impact within the perspective of the Brazilian society–morbidity and mortality–public and private care. As the core data source, the Brazilian health system database was used.
Methods
This is a descriptive study with retrospective data analysis.
Source of data
Source of data included public available databases on hospital admissions (SIH-SUS – Unique Health System) and outpatient care (SIA-SUS) from the public health care system (SUS) [7], mortality [8], and social security (DATAPREV) [9]. Population data were taken from national database (IBGE) [10]. All data from public database cover the period from 2010 to 2015.
Medical care
The number of public hospital admissions was obtained from the Hospital Information System (SIH-SUS) and include the admissions covered only by SUS.
The outpatient treatments (including radiotherapy and all types of chemotherapy) were obtained from outpatient information system (SIA-SUS) covered only by the public health care system (SUS). The number of medical visits per disease is not available. We used the number of medical visits from all diseases available in the system to estimate the number of medical visits in the public system. The rate applied was 6%. The number of cancer home visits was not included in this study.
Private data for cancer care are not available. To estimate the number of hospital admissions and the outpatient’s treatments we used the distribution of hospital and outpatient coverage provided with open data by the National Supplementary Health Agency (ANS) each year [11].
Costs and definition
Direct costs are defined as the direct health-care costs [12]. In the study herein, the costs for medical procedures and services associated with treatment and cancer care were included in the direct costs of the medical care, plus hospitalization costs, outpatient visits and prescription drugs.
Indirect costs are defined as the costs resulting from productivity losses due to morbidity and premature mortality. Morbidity costs are defined as the time and economic output lost or forgone by the patient from his/her usual activities and work because of cancer and its treatment [13,14]. Mortality costs, as the value of the goods and services that would have been produced over the remaining lifetime by persons who died prematurely, are expressed as the present value of future productivity lost because of premature death [13].
The intangible or psychosocial costs of cancer include the pain and suffering from the disease and its treatment that affect health and well-being according to the Guidelines of Economic Evaluation of the Brazilian Ministry of Health [15]; these factors are not considered in this study.
The cancer costs were estimated based in the public funds assigned to the billing approved in the public system (SUS). Costs were calculated in Brazilian currency (BR R$) from 2010 to 2015, and converted into International Dollar (US INT $) from World Bank (Exchange rate BR R$ per (INT US$) = 1.4) data (Purchasing power parity conversion factor).
Direct costs
The total cost cancer-related estimated for the public sector is the result of the sum of the hospitalization and outpatient care costs from SUS patients.
Cancer outpatient costs spent by the Brazilian government are not available. To estimate the direct costs with oncological pharmaceutical assistance, data from the government expenditure in the same period from all causes were obtained. The same percentage of the hospital admissions cancerrelated (6% of overall expenditure) was assigned. This cost was similar to other national [16,17] and internationals studies [18-20].
Indirect costs
We estimated lifetime disease burden using the years of life lost due to premature mortality (years of life lost {YLLs}) and to morbidity or disability, while alive (years lost due to disability {YLDs}).
The costs related to loss of productivity resulting from morbidity, disability and premature death were estimated using the human capital approach, which assumes that the monetary value of lost productivity equals the current wage.
Morbidity costs were obtained by multiplying days lost from work due to cancer by an average age and gender-specific daily wage. The number of days lost was calculated by adding the number of hospital in-patient days to half the number of outpatient visits.
The estimated mortality costs are the product of the number of deaths and the expected value of an individual’s future earnings during the potential years of life lost, considering age and gender [21,22]. To estimate the mortality cost life-expectancy based on age and gender, employment rates and the appropriate discount rate to convert a stream of earnings into its present worth were adopted. To convert the stream of lifetime earnings into a present value, a 3% or 5% discount rate was used.
Per the human capital approach, the monetary value of lost productivity after 65 years of age becomes zero. However, it is inaccurate and unethical to place no economic value on a person’s life after age 65. Therefore, the average annual earnings of those between 60 and 64 years were used as a proxy for the economic value of the years remaining after 65 years. For a sensitivity analysis, the premature death costs were recalculated using 50% of the average annual earnings for ages 60–64 for the economic value of those aged over 65 years, instead of 100% [13,23].
Forecast of the cost of cancer care in the next five years
The forecast of the cancer cost was calculated by the sum of all direct and indirect costs in public and private care in Brazil. The progression was based in the temporal series analysis with data from 2010 to 2015. The Autoregressive Integrated Moving Average (ARIMA) [24] was adopted. The estimated costs over the next five years was carried out based on the 2010-2015 time series from a model (ARIMA) with the dependent variable transformed by natural logarithm.
Results
Brazilian population profile and health expenditures
Table 1 presents the Brazilian population, the percentage of people older than 65 years, the number of deaths and the number of cancer deaths. Cancer public admissions and the number of cancer outpatient visits care were taken from the public health system, and are included in Table 1. The number of admissions and outpatient’s visits using the coverage private rate assistance was estimated for each year. In 2010, the Brazilian population reached 199,242,462 people and in 2015, 204,450,649 (5% rise in the period). People older than 65 years were 14,289,462 in 2010 and 16,143,835 in 2015, a growth of 22%. The number of cancer deaths was 16% of the total death from diseases in Brazil in this period.
Table 1 Population, number of deaths, admissions, outpatient’s visits for cancer and health expenditure to cancer care, Brazil, 2010-2015.
| Data/Year |
2010 |
2011 |
2012 |
2013 |
2014 |
2015 |
| Brazilian population |
19,54,97,797 |
19,73,97,018 |
19,92,42, 462 |
20,10,32, 714 |
20,27,68, 562 |
20,44,50, 649 |
| Percentage of people older than 65 years |
1,32,53, 407 |
1,37,49,501 |
1,42,89,040 |
1,48,70, 086 |
1,54,89, 166 |
1,61,43, 835 |
| Number for deaths* |
11,36, 947 |
11,70,498 |
11,81,166 |
12,10,474 |
11,99,937 |
12,17,673 |
| Numbers of deaths for cancer* |
1,78,990 |
1,84,384 |
1,91,577 |
1,96,954 |
2,00,867 |
2,06,545 |
| Public Admissions |
1,13,57, 965 |
1,12,81,571 |
1,10,92,589 |
1,11,97, 160 |
1,13,20, 287 |
1,13,57, 491 |
| Public Admissions for cancer |
6,04,809 |
6,24,035 |
6,59,788 |
6,91,543 |
7,25,685 |
7,54,488 |
| Public Outpatients Visits for cancer† |
31,37,73,227 |
30,83,79,266 |
29,82,61,747 |
31,60,00, 066 |
33,99,03, 558 |
32,31,42, 992 |
| Coverage private rate assistance (%) |
23.6 |
24 |
24.6 |
25.5 |
26 |
25.6 |
| Estimated private admissions for cancer |
1,86,826 |
1,97,064 |
2,15,262 |
2,36,703 |
2,54,970 |
2,59,609 |
| Estimated private outpatient’s |
92,13, 321 |
99,08,628 |
1,00,61,180 |
1,08,16, 110 |
1,19,42, 557 |
1,11,18, 899 |
| |
|
|
|
|
|
|
Source: IBGE, SIA/DATASUS e SIH/DATASUS *number of death in 2014 and 2015 was estimated using data from temporal series from 2008 through 2013 with ARIMA progressing model †Estimated by the rate of total outpatient’s visits in the public system (6%)
Cancer admissions increased 125% in the period (from 659,788 to 754,488 in the public system and from 215,262 to 259,609 in the private system). Outpatient visits attributed to cancer care were 10,061,080 in 2010 and 11,118,899 in 2015 (8% growth).
The medical care cost is shown in Table 2. Public direct costs from admissions and outpatient´s visits were US INT$ 3.8 billion in 2010 and increased to US$ INT 4.8 billion in 2015. Brazil spent US INT$ 439,293,112 in 2010 and US INT$ 571,328,769 with prescription drugs in the public system. There was a 26% increase in direct costs in the period (from US INT $ 9,538,319,392 in 2010 to US INT $ 12,031,303,533 in 2015).
Table 2 Direct costs of cancer (US INT $), Brazil, 2010-2015.
| Data/Year |
2010 |
2011 |
2012 |
2013 |
2014 |
2015 |
| Public direct costs (admissions and outpatient) |
3,85,29, 50,614 |
4,12,88, 32,692 |
4,19,39,30,263 |
4,60,31,29,132 |
4,96,60, 81,355 |
4,84,27, 57,821 |
| Public prescription drugs |
43,92,93,112 |
45,53,26,335 |
54,79,60, 211 |
52,55,77,122 |
58,68,74,061 |
57,13,28,769 |
| Private expenditure on health (%) |
54 |
55 |
56 |
55 |
54 |
55 |
| Private estimated direct costs |
4,70,91, 61,861 |
5,04,63, 51,068 |
5,12,59,14,766 |
5,62,60,46,716 |
6,06,96, 54,990 |
5,91,89, 26,225 |
| Private prescription drugs |
53,69,13,804 |
55,65,09,965 |
66,97,29, 146 |
64,23,72,038 |
71,72,90,519 |
69,82,90,718 |
| Total direct costs |
9,53,83, 19,392 |
10,18,70,20,060 |
10,53,75, 34,385 |
11,39,71,25,008 |
12,33,99, 00,925 |
12,03,13,03,533 |
| Direct costs per person |
9,366 |
10,003 |
9,764 |
10,560 |
10,282 |
10,025 |
Source: SIA/DATASUS, SIH/DATASUS, Spending from Brazil´s government site and WHO
Cancer-related retirement and disability benefits are shown in Table 3. In Brazil, these expenditures are higher than with retirement. The Brazilian government spent approximately US INT $ 8.2 million in 2010 and US INT $ 12.9 million in 2015. Cancer disability benefits were responsible for approximately US NT $ 73.4 million in 2010 and US INT $ 131.5 in 2015.
Table 3 Retirement and disability benefits by cancer (US INT $), Brazil, 2010-2015.
| Data/ Year |
2010 |
2011 |
2012 |
2013 |
2014 |
2015 |
| Retirement spending’s |
82,05, 725 |
91,78, 770 |
1,00,62,525 |
1,16,55,770 |
1,20,53,762 |
1,29,42,432 |
| Disability benefits spending’s |
73,431,201 |
82,325,271 |
97,913,626 |
11,18,52, 999 |
12,01,92, 054 |
13,15,28, 740 |
| Total spending´s |
81,636,927 |
91,504,042 |
10,79,76,152 |
12,35,08, 769 |
13,22,45, 816 |
14,44,71, 173 |
Source: DATAPREV
The morbidity costs of cancer, defined as the value of lost earnings and the opportunity cost of lost productivity among currently employed persons are shown in Table 4. The number of admissions and outpatient visits were used to calculate the absenteeism. The morbidity cost of cancer was US INT $ 8,250,748,246 in 2010 and US INT $ 10,387,578,042 in 2015.
Table 4 Morbidity and mortality costs by cancer, Brazil, 2010-2015.
| Data/Year |
2010 |
2011 |
2012 |
2013 |
2014 |
2015 |
| Number of male admissions |
242,245 |
254,860 |
269,417 |
285,322 |
297,996 |
315,280 |
| Number of female admissions |
362,564 |
369,175 |
390,371 |
406,221 |
427,689 |
440,005 |
| Average length of staying |
5.7 |
5.6 |
5.5 |
5.5 |
5.4 |
5.4 |
| Absenteeism, male (admissions) |
1,380, 797 |
1,427,216 |
1,481,794 |
1,569,271 |
1,609,178 |
1,702,512 |
| Absenteeism, female (admissions) |
2,066, 615 |
2,067,380 |
2,147,041 |
2,234,216 |
2,309,521 |
2,376,027 |
| Number of outpatient visits |
298, 261,747 |
313,773, 227 |
308,379, 266 |
316,000, 066 |
339,903, 558 |
323,142, 992 |
| Average male salary |
$994 |
$957 |
$1,021 |
$1,100 |
$1,189 |
$1,151 |
| Average female salary |
$702 |
$543 |
$588 |
$644 |
$714 |
$639 |
| Morbidity cost of male by absenteeism in admissions |
$45,730,336 |
$45,534, 987 |
$50,451, 541 |
$57,539, 937 |
$63,754, 116 |
$65,318, 089 |
| Morbidity cost of female by absenteeism in admissions |
$48,386,833 |
$37,458, 957 |
$42,122, 890 |
$47,982, 438 |
$54,988, 586 |
$50,643, 318 |
| Morbidity cost of absenteeism in outpatient care |
$4,215, 361,671 |
$3,924, 033,033 |
$4,137, 421,816 |
$4,593, 286,668 |
$5,389, 899,277 |
$4,821, 293,447 |
| Morbidity cost of care |
$4,309, 478,840 |
$4,007, 026,976 |
$4,229, 996,247 |
$4,698, 809,042 |
$5,508, 641,978 |
$4,937, 254,854 |
| Price of bus ticket |
$1.67 |
$1.67 |
$1.74 |
$1.9 |
$1.9 |
$2.16 |
| Transportation cost of care |
$1,994,092,820 |
$2,097, 798,145 |
$2,149, 844,024 |
$2,400, 558,740 |
$2,582, 146,480 |
$2,791, 103,209 |
| Public morbidity cost |
$6,303, 571,660 |
$6,104, 825,12 |
$6,379, 840,27 |
$7,099, 367,78 |
$8,090, 788,458 |
$7,728, 358,063 |
| Coverage private rate assistance |
24 |
24 |
25 |
26 |
26 |
26 |
| Overall Morbidity Cost |
$8,250, 748,246 |
$8,032, 664,633 |
$8,461, 326,619 |
$9,529, 352,728 |
$10,933, 497,916 |
$10,387, 578,042 |
| YLL, male |
1648346 |
1692340 |
1718265 |
1815967 |
1810314 |
1814562 |
| YLL, female |
1418614 |
1485474 |
1508988 |
1582710 |
1577039 |
1581984 |
| Mortality Cost |
$31,610,195,445 |
$29,127,267,284 |
$31,718,779,982 |
$36,207,376,284 |
$39,337,717,890 |
$37,200,903,018 |
Source: SIA/DATASUS, SIH-DATASUS, SIM, PME/IBGE
Premature mortality from cancer significantly affects the productive capacity of the economy. The years of life lost (YLL) to cancer was used to estimate the mortality costs in Brazil in the period. The YLL in male are higher than in female. From 2010 to 2015, 19.6 million years of life were lost to cancer (10.5 million in male and 9.1 million in female). The mortality cost in 2010 was US INT $31.6 billion and 37.2 billion in 2015 (Table 4).
The total economic cost of cancer, including all cost components, was estimated to be US INT $49.5 billion in Brazil in 2010 and US INT $59.7 billion in 2015, which represents the average of 1.7% of the GPD in the period (Table 5). The cost per person and the mortality cost per death are showed in Table 5. Direct costs comprised 20% of total costs, morbidity costs 17%, and mortality costs 63%. The direct costs raised 26% in the period, the morbidity costs, 48% and mortality costs, 18%.
Table 5 Total costs by cancer (US INT $), Brazil, 2010-2015.
| Data / Year |
2010 |
2011 |
2012 |
2013 |
2014 |
2015 |
| Direct costs ($) |
9,53, 83,19, 391 |
10,18,70, 20,060 |
10,53,75, 34,386 |
11,39,71, 25,008 |
12,33,99, 00,925 |
12,03,13, 03,533 |
| Direct costs per person ($) |
9,366 |
10,003 |
9,764 |
10,560 |
10,282 |
10,025 |
| Morbility costs ($) |
8,25, 07,48, 246 |
8,03,26,64,633 |
8,46,13,26,619 |
9,52,93,52,728 |
10,93,34, 97,916 |
10,38,75, 78,042 |
| Morbility costs per person ($) |
8,102 |
7,887 |
7,840 |
8,829 |
9,110 |
8,655 |
| Mortality costs ($) |
31,61,01,95, 445 |
39,12,72, 67,284 |
31,71,87, 79,982 |
36,207, 376,284 |
39,33,77, 17,890 |
37,20,09, 03,018 |
| Mortality costs per death ($) |
1,76, 603 |
1,57,971 |
1,65,567 |
1,83,837 |
1,95,840 |
1,80,110 |
| Retirement and disability benefits costs ($) |
8,16, 36,927 |
9,15,04,042 |
10,79,76, 152 |
12,35,08, 769 |
13,22,45, 816 |
14,44,71, 173 |
| Total cost of cancer ($) |
49,48,09,00, 009 |
47,43,84, 56,018 |
50,82,56, 17,139 |
57,25,73, 62,789 |
62,74,33, 62,546 |
59,76,42, 55,765 |
| Total cost of cancer per person ($) |
48,586 |
46,581 |
47,092 |
53,052 |
52,280 |
49,797 |
| Total cost of cancer per capita ($) |
253.1 |
240.32 |
255.09 |
284.82 |
309.43 |
292.32 |
| % GPD with cancer |
1.88% |
1.60% |
1.62% |
1.89% |
1.82% |
1.62% |
Source: calculated by the author
The forecast of the cost of cancer used the total amount of public and private care costs in Brazil. The progression was based in the temporal series analysis with data from 2010 to 2015, using ARIMA model. After adjustment of the model, the linear progression was made with natural log. The stationary R2 was significant (0.860).
The observed cost of cancer in Brazil from 2010 to 2015 is shown in Figure 1. The values were used to estimate cost of cancer in Brazil from 2016 to 2020, showed in black. The dot lines depict the confidence interval (upper and lower). The predicted total cost of cancer in Brazil is rising exponentially and will reach nearly US INT $ 81 billion in 2020.
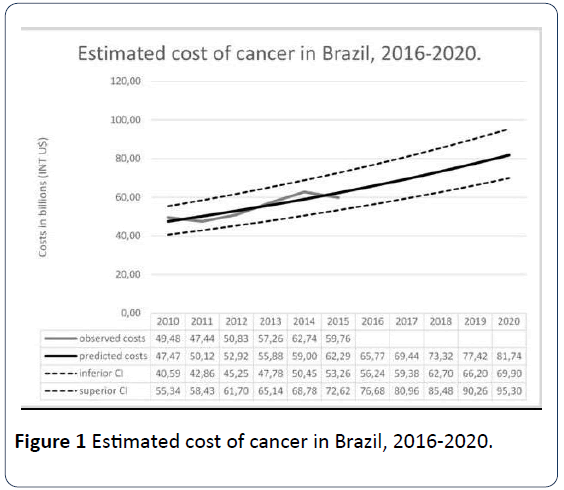
Figure 1: Estimated cost of cancer in Brazil, 2016-2020.
Discussion
This is the first study that evaluated the direct and indirect costs of cancer under the perspective of the Brazilian society. Health expenditures in Brazil are estimated at 9.5% of GDP and the average cost with cancer was estimated at 1.7% of GDP per year, reaching almost US$ 60 billion in 2015. Direct costs account for 20% of total costs of cancer in Brazil, morbidity costs, 17%, and mortality costs, 63% which means that cancer imposes a high corporate burden for the society.
The cost of cancer per person found in this study is similar to the cost of cancer in South Korea. Kim SG et al. published an important study that estimated the cost of cancer in the country in 2002. To compare this study with the results found in 2010 we converted the cost of cancer in Korea to the present value in 2010, using a 5% discount rate.
To estimate the burden of cancer in Brazil in the decade (from the beginning of 2010 through the end of 2020), the present value from 2010 through 2015 and the future value from 2016 through 2020 were used (discount rate of 5%). The present value found was US INT $368.4 billion and the future value is US INT $211.6 billion. The predicted impact of cancer in Brazil in this decade is US INT $580 billion, higher than the GPD of Switzerland in 2015 (US INT $501.6 billion).
The cost of cancer per person in Korea in 2002 was US INT $ 30,195. Converting to the present value in 2010, the cost would be US INT $ 51,539. In Brazil, the cost per person in the same year was US INT $ 45,846. Direct cost in Korea was 20% of the total, morbidity cost, 15% and mortality cost, 65%. In 2015, Kim SY et al. published a study that estimated the cost of cancer in 2009 that shows an important rise in direct cost. In that study, the mortality cost has constituted the overwhelming majority of the total productivity loss [25].
Premature deaths caused by cancer are one of the priorities to be discussed in Brazil. The cost of mortality due to the years of life lost (YLL) because of cancer are one of the highest compared to other countries [26], estimated the cost of cancer in USA at 2009 and in this study the mortality cost represents 35% of the total cost. Luengo-Fernandez et al. [27] estimated the economic burden of cancer across the European Union (EU) in 2008. Per this study, the mortality cost in EU was 41% of the total cost of cancer in 2008, and in United Kingdom it was 51%. Only Korea has a similar scenario in the year of 2002 (65% of the total cost) [13,24].
According to the World Bank (World Bank Group, 2016), in 2010 health costs represented 17.02% in USA, 10.2% in EU, 9.51% in UK, 8.27% in Brazil and 6.79% in South Korea. The present value spent with cancer in 2010 using a discount rate of 5% was estimated to compare the cost of cancer in different regions and studies. USA is the country with the highest percentage of GDP with cancer-related expenditure (2.58%), followed by Korea (1.27%), EU (0.94%) and UK (0.78%). In this study, Brazil spent 1.88% of GDP with cancer in 2010.
Because cost data comes from approved billing in the public database, most likely the cost is underestimated. This occurs in Brazil because the government has a budgeted cap in each state or municipality, so when the cost reaches the settled ceiling the billing is rejected. For this reason, the estimated cost of cancer in this study is considered conservative.
The oncological market information in Brazil is not available in public database. However, to overcome this limitation, national and international studies that showed that the oncological market is 6.7% of the total cost in the pharmaceutical arsenal were used [17].
Finally, to calculate the economic losses due to morbidity and mortality, we used the human capital approach. This method undervalues some groups, such as children and retired.
Although there is considerable variation in methodology and cost of illness (COI) analyses, a systematic COI study can provide valuable data for the relative socioeconomic burden of the disease [13,28].
Despite these acknowledged and data limitations, this is the first study to quantify the economic burden of cancer in Brazil using public database [29-31]. The economic burden is considerable and indicates a need for increased prevention, earlier diagnosis and cancer control policies in Brazil [32-35].
Conclusion
More than 60% of cancer cases occur in Africa, Asia, Central America and South America, and 70% of cancer deaths worldwide occur in these regions. Cancer costs have increased significantly over the past five years and will increase until 2020. Costs of cancer have sharply increased significantly in this decade, specially attributed to premature deaths mortality.
Ethical Statement
This research was made with public database, not requiring ethical statement.
19776
References
- Naghavi M, Wang H, Lozano R, Davis A, Liang X, et al. (2015) Global, regional and national age–sex specifi call-cause and cause-specific mortality for 240 causes of death, 1990–2013: A systematic analysis for the Global Burden of Disease Study 2013. Lancet 385: 117-171.
- Globocan/Iarc (2012) GLOBOCAN 2012: Estimated incidence, mortality and prevalence worldwide in 2012.
- INCA/Ministry of Health (2015) Estimate 2016: Incidence of cancer in Brazil. Rio de Janeiro: General coordination of prevention and surveillance / INCA.
- Economist Intelligence Unit (2009) Breakaway: The global burden of cancer- challenges and opportunities.
- WHO (2013) Global health observatory data repository. Health expenditure per capita, all countries, selected years.
- Brazil/Datasus (2016) Health Information (Tabnet) -Health Assistance. DATASUS. Department of Informatics at the SUS Service, 2016.
- Brazil/SIM (2016) Mortality information system. Health Information (TABNET) - Vital Statistics.
- Brazil/Dataprev (2016) Dataprev - Disability benefits granted by international classification of diseases (ICD).
- Ding D, Lawson KD, Kolbe-Alexander TL (2016) The economic burden of physical inactivity: A global analysis of major non-communicable diseases. Lancet 388: 1311-1324.
- Kim SG, Hahm MI, Choi KS, Seung NY, Shin HR, et al. (2008) The economic burden of cancer in Korea in 2002. Eur J Cancer Care. 17: 136-144.
- Yabroff KR, Lawrence WF, Clauser S, Davis WW, Brown ML (2004). Burden of illness in cancer survivors: Findings from a population-based national sample. J Natl Cancer Inst 96: 1322-1330.
- https://bvsms.saude.gov.br/bvs/publicacoes/diretrizes_metodologicas_diretriz_avaliacao_economica.pdf
- Azambuja MIR, Foppa M, Maranhão MFC, Achutti AC (2008) Economic burden of severe cardiovascular diseases in Brazil: An estimate based on secondary data. Arq Bras Cardol 91: 163-171.
- https://www.sbradioterapia.com.br/pdfs/relatorio-tribuna-contas-uniao.pdf
- Bloom DE, Cafiero ET, Jané-Llopis E (2011) The global economic burden of non-communicable diseases. World Ecomnomic Forum pp. 1-48.
- IMS Health for Informatics (2016) Global oncology trend report: A review of 2015 and outlook to 2020. IMS Heath, New Jersey.
- Kim HJ, Park TK, Jee SH (2001) Analysis of socioeconomic costs of smoking in Korea. Korean J Prevent Med 34: 183-190.
- Khorasani S, Rezaei S, Rashidian H (2015) Years of potential life lost and productivity costs due to premature cancer-related mortality in Iran. Asian Pac J Cancer Prev 16: 1845-1850.
- Liu LM, Hudak GB, Box GEP, Muller ME, Tiao GC (1994) Forecasting and time series analysis using tha SCA statistical system. Scientific Computing Associates Corp, Chicago.
- Kim SY, Park JH, Kang KH (2015). The economic burden of cancer in korea in 2009. Asian Pac J Cancer Prev 16: 1295-1301.
- Yabroff KR, Lund J, Kepka D, Mariotto A (2011). Economic burden of cancer in the United States: Estimates, projections, and future research. Cancer Epidemiol Biomarkers Prev 20: 2006-2014.
- Luengo-Fernandez R, Leal J, Gray A, Sullivan R (2013) Economic burden of cancer across the European Union: A population-based cost analysis. Lancet Oncology 14: 1165-1174.
- Sullivan R, Peppercorn JR, Sikora K, Zalcberg J, Meropol NJ, et al. (2011) Delivering aff ordable cancer care in high-income countries. Lancet Oncol 12: 933-980.
- European Society for Medical Oncology (2007) The burden and cost of cancer. Annals of Oncology 18: iii8–iii22.
- Freddie B, Ariana Z, Patricia C, Anne K, Rajaraman S, et al. (2014) Planning and developing population-based cancer registration in low- and middle-income settings. International Agency for Research on Cancer, Lyon.
- Brown ML, Fintor (1995) The economic burden of cancer. In: Kramer BS, Weed DL (eds.). Cancer Prevention and Control. Marcel Dekker, New York. pp: 69-81.
- Goss PE, Lee BL, Badovinac CT, Strasser WK, Chavarri GY, et al. (2013) Planning cancer control in Latin America and the Caribbean. Lancet Oncol 14: 391-436.
- Stewart BW, Wild CP (2014) World cancer report 2014. Lion, France. p. 603.

