Keywords
Epilepsy; Electrocardiograph; Non-stationary time series; Multifractality; Multifractal width; Auto-correlation coefficient
Introduction
Heart is one of the most important organs of human being. An electrocardiograph (ECG) is a bioelectrical signal which records the heart's electrical activity versus time. It is an important diagnostic tool for assessing heart functions [1]. Heart rhythm disorders, known as arrhythmias, present abnormal electrical activities due to cardiovascular diseases [2]. Cardiovascular disease is one of the major causes of death in the world. Rapid arrhythmias (greater than 100 beats per minute) are called tachycardias. Slow arrhythmias (slower than 60 beats per minute) are called bradycardias. Irregular heart rhythms are called fibrillations (as in atrial fibrillation and ventricular fibrillation) [1].
Epilepsy is one of the most common neurological disorders, second only to stroke, with a prevalence of 0.6% to 0.8% of the world's population [3]. Electroencephalograms (EEGs) and brain scans are common diagnostic test for epilepsy [4]. Epileptic seizures may be associated with autonomic deregulation manifesting, for example, blood pressure (BP) and heart rate (HR) changes [5]. Depending on the region of the brain that is compromised during seizures, acute changes in heart rate and/ or respiration can be seen. Besides the respiratory effects, such as apnoea, complex-partial seizures (CP) seem to affect the heart rate either through tachycardia or bradycardia, which in turn might be related to sudden unexplained death [6].
The widespread cardiac effects of epilepsy may range from minute changes in heart rate variability (HRV) to ictal sinus arrest. HRV reflects the beat-to-beat alterations in the HR and is mainly modulated by parasympathetic and sympathetic activity. HRV can be used as a tool to show information on the functional state of the autonomic nervous system. HRV is a mirror of neuronal influences on the cardiac pacemaker as one of the important functions of the autonomic nervous system. It is found to be lower with refractory epilepsy, possibly resulting from parasympathetic or vagal reduction. This can make patients more susceptible to tachycardia and fibrillation and possibly sudden unexpected death (SUDEP) [7]. With the advent of simultaneous EEG and ECG recording, different types of ictal cardiac dysrhythmia have been reported, and this has given some insight about a possible mechanism for SUDEP [8].
Analysis of ECG signal of epileptic patients having seizure has been reported by a several researchers. Al-Aweel et al. [9] used post-ictal heart rate data of a heterogeneous group of patients with partial epilepsy and they observed ‘this pattern is marked by the appearance of transient but prominent low-frequency heart rate oscillations (0.01 Hz to 0.1 Hz) immediately following five of 11 seizures recorded in 5 patients’ and remarked that ‘this finding may be a marker of neuro-autonomic instability, and, therefore, may have implications for understanding perturbations of heart rate control associated with partial seizures’. Later, analyzing the same dataset Amaranth [10] described ‘the implementation of power spectral density (PSD) technique to analyze ECG recording of post-ictal heart rate oscillations in partial epilepsy’. Zijlmans et al. [11] observed some ECG abnormalities in the pre-ictal period of partial and generalized seizures such as T wave inversion and ST elevation/depression. Leutmezer et al. [12] and Elmpt et al. [13] modelled heart rate signal using curve fitting methodology to detect seizure onset from ECG signals. Wong et al. [14] investigated ECG signals in a first seizure clinic and found a close cooperation between cardiology and neurology. Surges et al. [15] showed the QT interval to be shortened during the early postictal phase in patients suffering from refractory temporal lobe epilepsy. Many more studies have been reported where both pre-ictal and post-ictal studies have been done on ECG signals with a motivation of extracting relevant important information [1,16-19]. Jansen et al. [20] reported changes in heart rate in temporal-lobe and frontal-lobe seizures in childhood epilepsy. Varon et al. [21] proposed the necessity of development of user friendly warning systems to improve the quality of life of patients suffering from epileptic seizures from the respective changes in heart rate during the pre-ictal, ictal and post-ictal phases. Van der Kruijs et al. [22] investigated the autonomic nervous system functioning with epileptic seizures in pre-ictal time course of HRV. In a recent study Varon et al. [23] have also suggested seizures to effect autonomic control of heart rate and respiration. They studied ECG signals of patients suffering from focal and generalized seizures proposing two algorithms namely, principal component analysis and phase rectifying signal averaging to quantify morphology changes in QRS and cardio respiratory interactions respectively.
Kolsal et al. [24] have reported a study on heart rate variability in children with epilepsy to predict seizure. The finding of Kolsal et al. [24] is interesting but the technique that has been used for analysis is the conventional linear technique which has been challenged for quite some time for non-stationary signals. Any signal, the spectrum may cover wide range of frequencies and conventional time and frequency domain analysis techniques based on the linear fluctuation of heart rate is insufficient to outline the changes in heart rate dynamics [25-36]. To quantify this, nonlinear dynamics based methods such as fractal analysis and chaos theory have been introduced [37-39]. These techniques have quite successfully been implemented on HR signals and provided significant clinical information on cardiac diseases [40-45], but are yet to be used on a few more fields like evaluation of autonomic cardiovascular dysfunction in epilepsy etc.
Long-term memory-like structures are characterized by the amplitudes of the frequency (f) spectrum following a scale free power-law relationship of 1/f. Cardiac time series exhibits similar character where the long-range correlations indicate that, normally the fluctuations on one scale are self-similar to those on other scales [46]. Assuming the scaling properties were homogeneous throughout the entire signal, cardiac time series were treated as monofractal signals [47-54]. With advancement in analysis techniques, later it was revealed that the behavior of cardiac time series could not be adequately quantified by a single scaling parameter since it is far more inhomogeneous and non-stationary which is a clear indication that the dynamics of HR fluctuations has a higher level of multiscale complexity. That led to application of multi-exponent multi-fractal analysis on cardiac time series of normal subjects, patients with cardiac disease and also study of mice [52,53,55-58].
Numerous EEG studies demonstrate its nonlinear and nonstationary character [59-62]. Like EEG, ECG signals are also nonlinear and non-stationary [63-70]. Ivanov et al. [71] reported healthy human interbeat intervals to exhibit multifractal properties. Amaral et al. [72] also reported the multifractal behavior of HRV. Wang et al. [73] too analyzed ECG signals of healthy young adult subjects and old ones and characterized their multifractality.
In recent years, complex systems-natural or man-made are being studied applying rigorous chaos based nonlinear methods. EEG, ECG and EMG signals are examples of such systems which have been studied and reported in the light of this nonlinear methodology [74-77]. Unfortunately utilizing the state of the art methods of nonlinearity, ECG signals had not been studied in detail except by Jiang et al. [78], where ECG signals were studied applying visibility graph methods. But there also no quantitative assessment on the change of ECG patterns due to meditation had been analyzed. In an earlier work, Dutta, et al. [79] applied multifractal detrended fluctuation analysis (MFDFA) to human EEG for normal and epileptic patients in different physiological and pathological states. The results showed that the degree of multifractality of EEG for patients in an epileptic seizure were much higher compared to normal healthy people. Significant difference was also found in the degree of multifractality for normal humans with eyes open and eyes closed. Further in another work Ghosh et al. [80] studied the cross-correlation of EEG signals during seizure and in seizure free intervals of epileptic patients in the investigation of complex signals for assessment of cross-correlation among two nonlinear time series produced by real biological systems using multifractal detrended cross-correlation analysis (MFDXA) methodology which is used with high degree of success. The study revealed that, in the epileptogenic zone among seizure and seizure free interval, the degree of cross-correlation is more.
Since these analyses have provided important and meaningful information about the brain dynamics, we have therefore been encouraged to use those methods in post-ictal electrocardiographic information applying precisely MFDFA the results of which are not only new but a step forward towards identifying diagnosis, onset and prognosis. In addition, the application of MFDFA on pre-ictal and post-ictal ECG signals together with larger sample size can yield a better result towards identifying diagnosis, onset and prognosis. Again, in the modern scientific fields of studying different heart diseases, though MFDFA is a widely-used methodology [81-83] but to the best of our knowledge no study has been reported about the changes in heart rate dynamics after occurrence of seizure using MFDFA. The application of MFDFA methodology on ECG patterns can help in understanding the changes that occur in heart rate after patients have encountered seizure.
Kantelhardt et al. [84] conceived MFDFA for the first time as a generalization of the standard detrended fluctuation analysis (DFA), and have applied it successfully to study multifractal scaling behaviour of various non-stationary time series [84-90]. The application of MFDFA provides a method of determining the self-similarity or persistence in the series.
Data
This preliminary report is based upon analysis of 7-time series obtained from “PhysioNet” (https://www.physionet.org/ physiobank/database/szdb/) [9]. The data contains 11 partial seizures recorded in five women patients, aged between 31 and 48 years, lasting from 15-110 seconds during continuous EEG, ECG and video monitoring [91]. Multiple seizures were recorded for 2 subjects. The patients were without clinical evidence of cardiac disease and had partial seizures with or without secondary generalization from frontal or temporal foci. The recordings were made under a protocol which was approved by Beth Israel Deaconess Medical Center's (BIDMC) Committee on Clinical Investigations.
“Data were analyzed off-line using customized software. Onset and offset of seizures were visually identified to the nearest 0.1 second by an experienced electroencephalographer (DLS) blinded with respect to the HRV analysis. Continuous single-lead ECG signals were sampled at 200 Hz. From the digitized ECG recording, a heartbeat annotation file (a list of the type and time of occurrence of each heartbeat) was obtained using a version of commercially available arrhythmia analysis software” developed by Ho et al. [43].
Method of Analysis
We have performed a multifractal analysis of the ECG recordings of post-ictal partial seizures in five women patients following the prescription of Kantelhardt et al. [84].
Let us suppose x(i) for i =1, ............, N, be a non-stationary time series of length N. The mean of the above series is given by
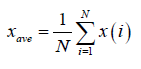 (1)
(1)
Considering x(i) as the increments of a random walk process around the average, the trajectory can be obtained by integration of the signal.
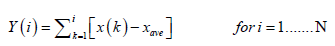 (2)
(2)
The level of measurement noise present in experimental records and the finite data are also reduced by the integration thereby dividing the integrated time series into Ns non-overlapping bins, where Ns = int(N/S) and where s is the length of the bin. As N is not a multiple of s, a small portion of the series is left at the end. Again, to include that left part, the entire process is repeated in a similar way starting from the opposite end, leaving a small portion at the beginning. Hence, 2Ns bins are obtained altogether and for each bin least-square fit of the series is done followed by determination of the variance.
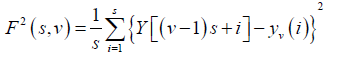 (3)
(3)
For each bin ν, ν =1 ........ Ns and
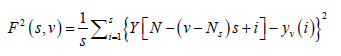 (4)
(4)
For ν = Ns + 1........, 2 Ns, where yν (i) is the least square fitted value in the bin ν. In our research work we have performed a least square linear fit (MFDFA-1). The study can also be extended to higher orders by fitting quadratic, cubic, or higher order polynomials.
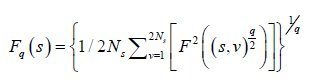
The qth order fluctuation function Fq(s) is obtained after averaging over 2 Ns, bins,
 (5)
(5)
where q is an index which can take all possible values except zero, as the factor 1/q becomes infinite with zero value. The procedure can be repeated by varying the value of s. With the increase in the value of s Fq S increases and for the long-range power correlated series Fq (s) shows power law behaviour,
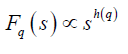
If such a scaling exists, in Fq will depend linearly on s with slope h(q). In general, the exponent h(q) depends on q. For a stationary time series, h(2) is identical with the Hurst exponent H. h(q) is said to be the generalised exponent. The value of h(0) cannot be obtained directly, because Fq blows up at q = 0. Fq cannot be obtained by normal averaging procedure; instead a logarithmic averaging procedure is applied.
 (6)
(6)
A monofractal time series is characterized by unique h(q) for all values of q. If small and large fluctuations scale differently, then h(q) will depend on q, or in other words the time series is multifractal. Kantelhardt et al. [92] have explained that the values of h(q) for q<0 will be larger than that for q>0.
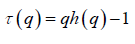
The generalized Hurst exponent h(q) of MFDFA is related to the classical scaling exponent ( ) by the relation,
(7)
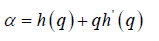
a monofractal series with long range correlation is characterized by linearly dependent q- order exponent τ(q) with a single Hurst exponent H. Multifractal signals have multiple Hursts exponent and τ (q) depends nonlinearly on q [93]. The singularity spectrum f(α) is related to τ(q) by Legendre transform [94].
 (8)
(8)
 (9)
(9)
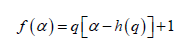
In general, the singularity spectrum quantifies the long-range correlations property of the time series [95]. The multifractal spectrum is capable of providing information about the relative importance of various fractal exponents in the time series, e.g. the width of the spectrum denotes range of exponents. A quantitative characterization of the spectra can be done by leastsquares fitting it to quadratic function [96] around the position of maximum α0 ,
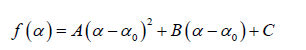 (10)
(10)
where C is a additive constant, 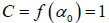 1; B indicates the asymmetry of the spectrum, and zero for a symmetric spectrum. The width of the spectrum can be obtained by extrapolating the fitted curve to zero. Width W is defined as
  with
with 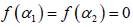 . It has been proposed by some workers [97] that the width of the multifractal spectrum is a measure of the degree of multifractality. Singularity strength or Holder exponent α and the dimension of subset series
  can be obtained from reln 9 and 10. For a monofractal series, h(q) is independent of q. Hence from relation 9 and 10 it is evident that there will be a unique value of α and , the value of α being the generalized Hurst exponent H and the value of being 1. Hence the width of the spectrum will be zero for a monofractal series. The more the width, the more multifractal is the spectrum.
The autocorrelation exponent γ can be estimated from the relation given below [98,99]
 (11)
(11)
For uncorrelated or short-range correlated data, h(2) is expected to have a value 0.5 while a value greater than 0.5 is expected for long-range correlations. Therefore, for uncorrelated data, γ has a value 1 and the lower the value the more correlated is the data.
Multifractality may be of two types: (i) “due to broad probability density function for the values of time series and (ii) due to different long range correlation for small and large fluctuation”. To ascertain the origin of multifractality the time series is randomly shuffled and then analyzed. While shuffling the values are arranged randomly so that all correlations are destroyed. The shuffled series will exhibit non-multifractal scaling if multifractality is due to long range correlation and if it is due to broad probability density, then, the original h(q) dependence is not changed, h(q) = hshuf(q). “But if both kinds of multifractality are present in a given series, then the shuffled series will show weaker multifractality than the original one” [84].
Superiority of MFDFA Over Other Conventional Methods
MFDFA has achieved highest precision in the scaling analysis. The results obtained by this method are more reliable compared to other conventional methods like Wavelet Analysis, detrended moving average (DMA), backward moving average (BMA), modified detrended fluctuation analysis (MDFA), continuous DFA (CDFA), Fourier DFA etc. Thus, for assessing correlation in nonlinear time series, it is considered as a very rigorous and robust tool. Again, MFDFA requires less effort in programming as compared to conventional DFA, since it does not require the modulus maxima procedure. According to some authors, the performance of MFDFA is better than other multifractal analyses methods [84,100,101]. Furthermore, MFDFA allows detection of multifractality in both stationary as well as non-stationary time series. Oswiecimka et al. [102] have shown that the application of MFDFA is the most reliable one; it is even more reliable compared to the most popular methodology wavelet transform modulus maxima (WTMM).
However, there are certain drawbacks in the MFDFA method. The problem may arise in the identification of correlation properties of real data where a large amount of data is missing or removed due to artifacts. Although it has been mentioned in the work of Ma et al. [103] major findings is not disturbed even with loss of data.
Results
The non-stationary times series of ECG data of partial seizures recorded in five women patients are analyzed following the method described above.
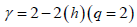
Multifractal analysis was employed for each set. The data was transformed to obtain the integrated signal. This process is effective in reducing noise in the data. The integrated time series was divided to Ns bins, where Ns = int(N/s), N is the length of the series. The qth order fluctuation function Fq(s) for q = -10 to +10 in steps of 1 was determined. Figure 1 depicts the linear dependence of ln Fq on ln s suggesting scaling behaviour. The slope of linear fit to ln Fq(s) versus ln s plots gives the values of h(q). The values of τ (q) were also determined. As we have mentioned earlier, nonlinear dependence of on τ (q) on q suggests multifractality, whereas for a monofractal series τ (q) depends linearly on q. The values of h(q) and τ (q) of all the post-ictal ECG signals are depicted in Figures 2 and 3 respectively.

Figure 1: Plot of log of fluctuation function (lnFq) vs. log of time scale (lns) of a particular ECG signal. From the slope of linear fit of the curves h(q) is obtained defining scaling behaviour of the series.
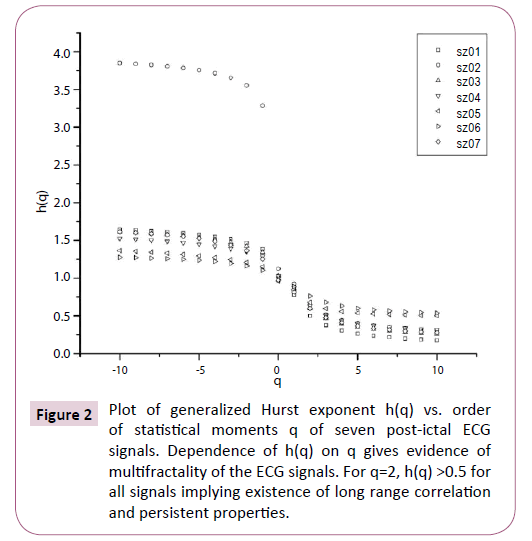
Figure 2: Plot of generalized Hurst exponent h(q) vs. order of statistical moments q of seven post-ictal ECG signals. Dependence of h(q) on q gives evidence of multifractality of the ECG signals. For q=2, h(q) >0.5 for all signals implying existence of long range correlation and persistent properties.
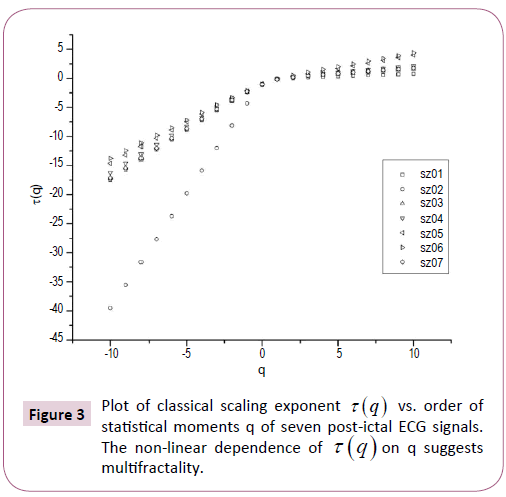
Figure 3: Plot of classical scaling exponent t (q) vs. order of statistical moments q of seven post-ictal ECG signals. The non-linear dependence of t (q) on q suggests multifractality.
The nonlinear dependence of τ(q) on q and the dependence of h(q) on q gives evidence for the multifractality of the post-ictal heart-rate oscillations. Figure 2 also depicts that the degree of dependence of h(q) on q, or in other words, the degree of multifractality is different in different cases. From the Figure 2 we can also see that for q=2 the generalized Hurst exponent h(q) of all the ECG signals is greater than 0.5 which means that long range correlation and persistent properties exist in all the sets.
We can also make a quantitative determination of the degree of multifractality from the multifractal spectrum. Ashkenazy et al. [97] have associated the width of the multifractal spectrum ( versus α ) with the degree of multifractality. Figure 4 shows the multifractal spectrum of seven post-ictal ECG signals.
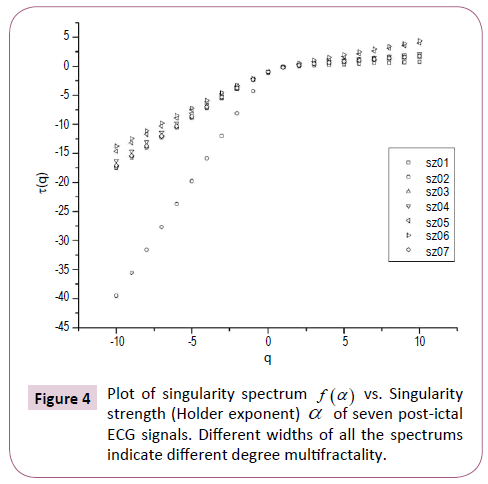
Figure 4: Plot of singularity spectrum f (a ) vs. Singularity strength (Holder exponent) a of seven post-ictal ECG signals. Different widths of all the spectrums indicate different degree multifractality.
The values of multifractal width w obtained by fitting the multifractal spectrums to Eq. (8) are listed in Table 1, from which we can observe that the multifractal widths of all the seven postictal ECG signals are different ranging from as low as 1.17 to as high as 3.95 We also included another Table 2, the main findings of which are published in our earlier communication [104].
| ECG signals |
Multifractal Width w |
Auto-correlation Exponent γ |
| Original |
Shuffled |
Original |
Shuffled |
| sz01 |
1.815 ± 0.177 |
0.894 ± 0.044 |
0.998 ± 0.012 |
0.995 ± 0.005 |
| sz02 |
3.950 ± 0.184 |
0.498 ± 0.009 |
0.709 ± 0.012 |
0.856 ± 0.006 |
| sz03 |
1.661 ± 0.134 |
0.781 ± 0.029 |
0.804 ± 0.014 |
0.962 ± 0.005 |
| sz04 |
1.527 ± 0.135 |
0.654 ± 0.020 |
0.733 ± 0.012 |
0.993 ± 0.006 |
| sz05 |
1.269 ± 0.119 |
0.761 ± 0.025 |
0.643 ± 0.007 |
1.085 ± 0.006 |
| sz06 |
1.165 ± 0.060 |
0.403 ± 0.006 |
0.475 ± 0.007 |
0.942 ± 0.005 |
| sz07 |
1.604 ± 0.085 |
0.742 ± 0.031 |
0.801 ± 0.006 |
0.908 ± 0.005 |
Table 1: Values of Multifractal Width (w) and Auto-correlation Exponent ( γ ) of seven post-ictal ECG
signals for original and shuffled series.
ECG signals of
healthy people |
Multifractal Width
(w) |
ECG signals of
CHF patients |
Multifractal Width
(w) |
| Sample I |
1.107 ± 0.152 |
Sample I |
1.735 ± 0.069 |
| Sample II |
1.179 ± 0.139 |
Sample II |
2.314 ± 0.087 |
| Sample III |
1.090 ± 0.082 |
Sample III |
1.146 ± 0.239 |
| Sample IV |
1.073 ± 0.045 |
Sample IV |
2.313 ± 0.039 |
| Sample V |
1.110 ± 0.151 |
Sample V |
1.240 ± 0.132 |
Table 2: Values of multifractal width (w) of ECG signals of normal healthy people and CHF patients (Channel I).
Table 2 shows on the basis of analysis of data obtained from BIDMC congestive heart failure database of five subjects that for normal heart, value of multifractal width ranges from 1.073 to 1.179, whereas for patients suffering from congestive heart failure (CHF), the corresponding values are from 1.146 to 2.314. A comparison of Tables 1 and 2 clearly reveals that the multifractal width of ECG recordings of seizure patients is greater than that observed for healthy subjects. Further in some cases the width of ECG of the seizure patients is found to be more than that of CHF also. Table 1 further reports the variation of auto-correlation exponent γ of the ECG signals.
Further from Table 1 we can see that the value of multifractal width for sz06 is the least and the auto-correlation exponent γ is 0.48 which indicates a high degree of correlation as we know lower the value of γ higher is the degree of correlation. Thus, from these two values we can say that for sz06 the effect of seizure on heart oscillations is the least. Further the same Table also reveals the fact that for sz02 the effect of seizure on ECG is the maximum as value of multifractal width w is twice than that of rest and γ also approaches uncorrelated behaviour.
In order to ascertain the origin of multifractality, the ECG signals were randomly shuffled and then analyzed. Table 1 clearly depicts the difference in values of the multifractal width and auto-correlation exponent for the original and shuffled series. We observe weaker multifractality for the shuffled series which implies that origin of multifractality is due to both long range correlations and broad probability distribution function. Since the sample size is relatively short we have not excluded the origin of multifractality due to broad probability distribution function. We further observe all the values of auto-correlation exponent for the shuffled series is close to 1, indicating all correlations are destroyed in the shuffling procedure. Figures 5-7 respectively depicts plots of h(q) vs. q, τ (q) vs. q, and f (α ) vs. α for the original series and randomly shuffled series for a particular set.
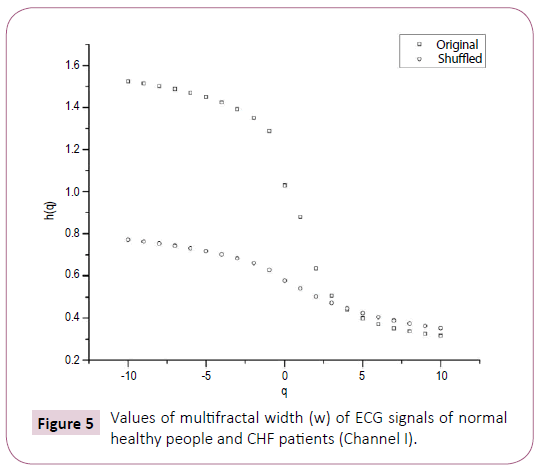
Figure 5: Values of multifractal width (w) of ECG signals of normal healthy people and CHF patients (Channel I).
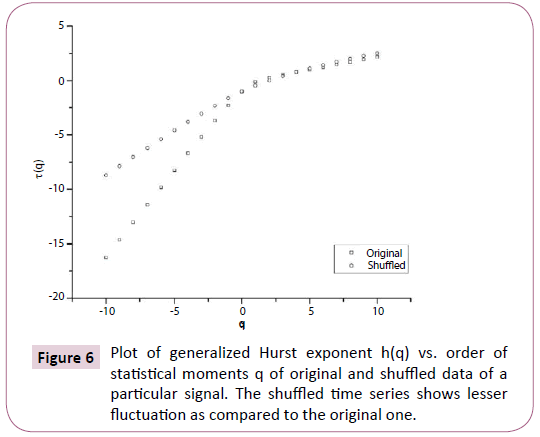
Figure 6: Plot of generalized Hurst exponent h(q) vs. order of statistical moments q of original and shuffled data of a particular signal. The shuffled time series shows lesser fluctuation as compared to the original one.
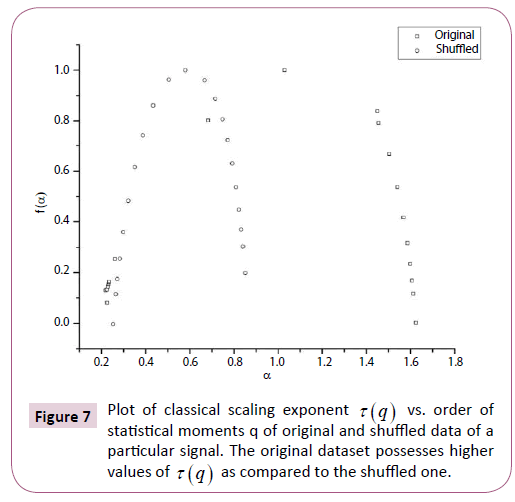
Figure 7: Plot of classical scaling exponent t (q) vs. order of statistical moments q of original and shuffled data of a particular signal. The original dataset possesses higher values of t (q) as compared to the shuffled one.
This analysis clearly indicates that except sz02 the multifractal width of epileptic patients indicates loss of multifractality which is outcome of abnormality in the functioning of the heart. This point has already been reported and discussed in the works of Ivanov et al. [71] and Peng et al. [48]. The case of the patient (sz02) is an uneven one since contrary to loss of multifractality in other subjects the present analysis shows an unusual higher degree of multifractality. This observation deserves special attention so far as understanding of dynamics of electrocardiography is concerned.
Nevertheless, it can safely be inferred that this anomalous fluctuation has genesis in the epileptic seizure of the patient.
We have reasons to comment that the present analysis of ECG data for post-ictal patient with a very sensitive and rigorous nonlinear technique provides information irrespective of cardiac status of post-ictal patient quantitatively which is not at all possible with the help of all other existing techniques. Needless to say, that Table 1 further shows that in case of sz06 the multifractal width w is close to width of Sample III of Table 2, i.e. ECG data of the patient suffering from CHF.
The present investigation clearly indicates that the analysis of ECG data of post-ictal patients with the help of MFDFA technique is the proper tool for further exhaustive investigation taking large set of data which might be able eventually for supplying quantitative information about the cardiac status of the patients. The importance of this work can be expressed in one line that this quantitative approach is a step forward towards assessment and monitoring of epileptic patients with the help of quantitative information about the cardiac status.
Discussion
The application of rigorous nonlinear technique in analyzing ECG data of patients clearly supports the fact that the epileptic seizure is associated with the autonomic deregulation. The analysis further shows the degree of autonomic deregulation can be quantified with the help of two parameters i.e. the multifractal width and auto-correlation exponent.
However, along with post-ictal data, pre-ictal data for different epileptic patients can be analyzed following this technique which possess a far fetching importance for development of software where the findings can be used to develop automatic alarm before seizure as well as even a precursor of cardiac arrest. Since no attempt is reported so far, in this direction the present analysis provides new data using chaos-based latest state of the art methodology which can capture a small change of signal giving rise to a large consequence. It deserves emphasizing that the patients suffering from epilepsy experience some significant cardiac changes during seizure, causing some serious cardiac malfunctions which may lead to SUDEP. Attempts can be made through continuous monitoring of the multifractal parameters to provide the information about the degree of serious cardiac malfunction for which proper medication can be administered to avoid SUDEP.
Conclusion
The study reveals that the degree of autonomic deregulation can be quantified with the help of two parameters, the multifractal width and the autocorrelation exponent.
Acknowledgement
We would like to acknowledge “PhysioNet”, from where we have obtained the data (https://www.physionet.org/physiobank/ database/szdb/).
18755
References
- Vanage AM, Khade RH, Shinde DB (2012) Classifying five different arrhythmias by analyzing the ECG signals. IJCEM 15: 2230-7893.
- Rashiq RM, Al AlfiMH (2014) Identification of cardiac diseases from (ECG) signals based on fractal analysis. IJCT 13: 4556-4565.
- Hauser A, Annegers JF, Rocca WA (1996) Descriptive epidemiology of epilepsy: Contributions of population-based studies. Rochester, Minnesota. Mayo Clinic Proceedings 71: 576-586.
- Morales-Matamoros O, Contreras-Troya TI, Mota-Hernndez CI, Trueba-Rios B (2009) Fractal analysis of epilepsy. 53rd Annual Meeting of the International Society for the Systems Sciences Proceedings, University of Queensland, Brisbane, Australia.
- Ronkainen E, Ansakorpi H, Huikuri HV, My JIT, et al. (2005) Suppressed circadian heart rate dynamics in temporal lobe epilepsy. J Neurol Neurosurg Psychiatry 76: 1382-1386.
- Varon C, Jansen K, Lagae L, Huffel SV (2012) Cardiorespiratory analysis on children suffering from absence and complex partial seizures. Comput Cardiol 113-116.
- Chen W, Guo CL, Zhang PS, Liu C, Qiao H, et al. (2014) Heart rate changes in partial seizures: Analysis of influencing factors among refractory patients. BMC Neurology 14:135.
- Li LM, Roche J, Sander JWAS (1995) Ictal ECG changes in temporal lobe epilepsy. ArqNeuropsiquiatr 53: 619-624.
- Al-Aweel IC, Krishnamurthy KB, Hausdorff JM, Mietus JE, Ives JR, et al. (1999) Post-ictal heart rate oscillations in partial epilepsy. Neurology 53: 1590-1592.
- Amaranth M (2010) Diagnosis of post-ictal heart oscillations in partial epilepsy using power spectral density analysis. ICCAE 2nd Int Conf Singapore, IEEE 3:333-336.
- Zijlmans M, Flanagan D, Gotman J (2002) Heart rate changes and ECG abnormalities during epileptic seizures: Prevalence and definition of an objective clinical sign. Epilepsia 43: 847-854.
- Leutmezer F, Schernthaner C, Lurger S, Potzelberger K, Baumgartner C (2003) Electrocardiographic changes at the onset of epileptic seizures. Epilepsia 44: 348-354.
- Elmpt WJCV, Nijsen TME, Griep PAM, Arends JBAM (2006) A model of heart rate changes to detect seizures in severe epilepsy. Seizure 15:366-375.
- Wong SH, Adams P, Jackson M (2008) The electrocardiograph (ECG) in a first seizure clinic. Seizure 17:707-710.
- Surges R (2010)Enhanced QT shortening and persistent tachycardia after generalized seizures. Neurology 74: 421-426.
- Naritoku DK, Casebeer DJ, Darbin O (2003) Effects of seizure repetition on postictal and interictalneurocardiac regulation in the rat. Epilepsia 44:912-916.
- Sahin D, Ilbay G, Imal M, Bozdogan O, Ates N (2009) Vagus nerve stimulation suppresses generalized seizure activity and seizure-triggered postictal cardiac rhythm changes in rats. Physiol Res 58:345-350.
- Nilsen KB, Haram M, Tangedal S, Sand T, Brodtkorb E (2010) Is elevated pre-ictal heart rate associated with secondary generalization in partial epilepsy? Seizure 19:291-295.
- Van der Lende M, Surges R, Sander JW, Thijs RD (2015) Cardiac arrhythmias during or after epileptic seizures. J Neurol NeurosurPsychi10:1-6.
- Jansen K, Varon C, Huffel SV, Lagae L (2013) Peri-ictal ECG changes in childhood epilepsy: Implications for detection systems. Epilepsy Behav 29:72-76.
- Varon C, Jansen K, Lagae L, Huffel SV (2013) Detection of epileptic seizures by means of morphological changes in the ECG. Computing in Cardiology Conference8630-866.
- Van der Kruijs SJM, Vonck KEJ, Feijs LMG, Bodde NMG, Lazeron RHC, et al. (2014) Autonomic nervous system functioning associated with epileptic seizures: analysis of heart rate variability. J Neurol Neurophysiol 5: 215-217.
- VaronC, Jansen K, Lagae L, Huffel SV (2015) Can ECG monitoring identify seizures? J Electrocardiol48: 1069-1074.
- Kolsal E, Serdarogluilsal E, Kula S, Soysal AS, et al. (2014) Can heart rate variability in children with epilepsy be used to predict seizures? Seizure 23: 357-362.
- Coenen AJ, Rompelman O, Kitney RI (1977) Measurement of heart-rate variability: Part 2-hardware digital device for the assessment of heart-rate variability. Med Biol Eng Comput 15: 423-430.
- Fakhouri SY (1980) Identification of Volterra kernels of nonlinear discrete system. IEE Proc D Control theory Appl 127:296-304.
- Dasheiff RM, Dickinson LJ (1986) Sudden unexpected death of epileptic patient due to cardiac arrhythmia after seizure. Arch Neurol 43:194-196.
- Oppenheimer S (2001) Forebrain lateralization and the cardiovascular correlates of epilepsy. Brain 124: 2345-2346.
- Berilgen MS, Sari T, Bulut S, Mungen B (2004) Effects of epilepsy on autonomic nervous system and respiratory function tests. Epilepsy Behav 5:513-516.
- Lahrmann H, Cortelli P, Hilz M, Mathias CJ, Struhal W, et al. (2006) EFNS guidelines on the diagnosis and management of orthostatic hypotension. Eur J Neurol 13:930-936.
- Kamal A (2006) Assessment of autonomic function for healthy and diabetic patients using entrainment methods and spectral techniques. IEEE 32nd Annual Northeast Bioengineering Conference, Easton, Pennsylvania pp: 16-162.
- Kamal AK (2010) Assessment of autonomic function in epileptic patients. Neurosciences (Riyadh) 15: 244-248.
- De Ferrari GM, Sanzo A, Schwartz PJ (2009) Chronic vagal stimulation in patients with congestive heart failure. IEEE Eng Med Biol Soc 2037-2039.
- Zamponi N, Passamonti C, Cesaroni E, Trignani R, Rychlicki F (2011) Effectiveness of vagal nerve stimulation (VNS) in patients with drop-attacks and different epileptic syndromes. Seizure 20: 468-474.
- Meregnani J, ClarenÃon D, Vivier M, Peinnequin A, Mouret C, et al. (2011) Anti-inflammatory effect of vagus nerve stimulation in a rat model of inflammatory bowel disease. Auton Neurosci 160: 82-89.
- Schaefer NF, Unnwongse K (2011) Localizing and lateralizing features of auras and seizures. Epilepsy Behav 20: 160-166.
- Previnaire JG, Soler JM, Leclercq V, Denys P (2012) Severity of autonomic dysfunction in patients with complete spinal cord injury. Clin Auton Res 22:9-15.
- Moseley B, Bateman L, Millichap JJ, Wirrell E, Panayiotopoulos CP (2013) Autonomic epileptic seizures, autonomic effects of seizures, and SUDEP. Epilepsy Behav 26: 375-385.
- M¤kikallio TH, Seppänen T, NiemelÃM, Airaksinen KE, Tulppo M, et al. (1996) Abnormalities in beat to beat complexity of heart rate dynamics in patients with a previous myocardial infarction. J Am Coll Cardiol 28: 1005-1011.
- Brouwer J, van Veldhuisen DJ, Man inÃt Veld AJ (1996) Prognostic value of heart rate variability during long-term follow-up in patients with mild to moderate heart failure. J Am Coll Cardiol 28:1183-1189.
- Huikuri HV, Seppnen T, Koistinen MJ, Airaksinen KEJ, Ikheimo MJ, et al. (1996) Abnormalities in beat-to-beat dynamics of heart rate before the spontaneous onset of life-threatening ventricular tachyarrhythmias in patients with prior myocardial infarction. Circulation 93:1836-1844.
- Ho KKL, Moody GB, Peng CK, Mietus JE, Larson MG, et al. (1997) Predicting survival in heart failure cases and controls using fully automated methods for deriving nonlinear and conventional indices of heart rate dynamics. Circulation 96: 842-848.
- Mkikallionen T, Airaksinen KEJ, Koistinen J, Tulppo MP, et al. (1997) Dynamic analysis of heart rate may predict subsequent ventricular tachycardia after myocardial infarction. J Am Cardiol 80:779-783.
- Woo MA, Stevenson WG, Moser DK, Middlekauff HR (1994) Complex heart rate variability and serum norepinephrine levels in patients with advanced heart failure. J Am Coll Cardiol 23: 565-569.
- Stiedl O, Jansen RF, Pieneman AW, Ãœgren SO, Meyer M (2009) Assessing aversive emotional states through the heart in mice: Implications for cardiovascular dysregulation in affective disorders. Neurosci Biobehav Rev 33: 181-190.
- Peng CK, Mietus J, Hausdorff JM, Havlin S, Stanley HE, et al. (1993) Long-range anticorrelations and non-gaussian behavior of the heartbeat. Phys Rev Lett 70: 1343-1346.
- Peng CK, Havlin S, Stanley HE, Goldberger AL (1995) Quantification of scaling exponents and crossover phenomena in nonstationary heartbeat time series. Chaos 5:82-87.
- Meyer M, Marconi C, Ferretti G, Fiocchi R, Skinner JE, et al. (1998) Is the heart preadapted to hypoxia? Evidence from fractal dynamics of heartbeat interval fluctuations at high altitude (5050 m). Integr Physiol Behav Sci 33: 9-40.
- Meyer M, Rahmel A, Marconi C, Grassi B, Cerretelli P, et al. (1998) Stability of heartbeat interval distributions in chronic high altitude hypoxia. Integr Physiol Behav Sci 33:344-362.
- Meyer M (2002) Fractal scaling of heart rate dynamics in health and disease. Fract Biol Med 3: 181-193.
- Meyer M, Stiedl O, Kerman B (2003) Discrimination by multifractal spectrum estimation of human heartbeat interval dynamics. Fractals 11:195-204.
- Meyer M, Stiedl O (2003) Self-affine fractal variability of human heartbeat interval dynamics in health and disease. Euro J Appl Physiol 90: 305-316.
- Stiedl O, Meyer M (2003) Fractal dynamics in circadian time series of cortico-tropin-releasing factor subtype 2-deficient mice. J Math Biol 47: 169-197.
- Ivanov PC, Chen Z, Hu K, Stanley HE (2004) Multiscale aspects of cardiac control. Physica A344:685-704.
- Goldberger AL, Amaral LAN, Haussdorff JM, Ivanov PC, Peng CK, et al. (2002) Fractal dynamics in physiology: Alterations with disease and aging. Proc Nat Acad Sci USA 99: 2466-2472.
- Meyer M, Stiedl O (2006) Fractal rigidity by enhanced sympatho-vagal antagonism in heartbeat interval dynamics elicited by central application of cortico-tropin-releasing factor in mice. J Math Biol 52: 830-874.
- Stiedl O, Tovote P‚¬âgren SO, Meyer M (2004) Behavioral and autonomic dynamics during contextual fear conditioning in mice. Auton Neurosci 115: 15-27.
- Das A, Das P, Roy AB (2002) Applicability of lyapunov exponent in EEG data analysis. Complexity International 9: 1-10.
- Mormann F, Kreuz T, Andrzejak RG, David P, Lehnertz K, et al. (2003) Epileptic seizures are preceded by a decrease in synchronization. Epilepsy Res 53:173.
- Maiwald T, Winterhalder M, Aschenbrenner-Scheibe R, Voss HU, Schulze-Bonhage A, et al. (2004) Comparison of three nonlinear seizure prediction methods by means of the seizure prediction characteristic. Physica D 194:357-368.
- Dikanev T, Smirnov D, Wennberg R, Perez Velazquez LJ, Bezruchko BB (2005) EEG non-stationarity during intracranially recorded seizures: Statistical and dynamical analysis. Clin Neurophysiol 116: 1796-1807.
- Fortrat JO, Yamamoto Y, Hughson RL (1997) Respiratory influences on non-linear dynamics of heart rate variability in humans. Biol Cybern 77: 1-10.
- Thurner S, Feurstein MC, Teich MC (1998) Multiresolution wavelet analysis of heartbeat intervals discriminates healthy patients from those with cardiac pathology. Phys Rev Lett 80: 1544-1547.
- Pomfrett CJ (1999) Heart rate variability, BIS and depth of anaesthesia. Br J Anaesth 82:559-661.
- Sleight JW, Donovan J (1999) Comparison of bispectral index, 95% spectral edge frequency and approximate entropy of the EEG, with changes in heart rate variability during induction of general anaesthesia. Br J Anaesth 82:666-671.
- Lin DC, Hughson RL (2001) Modeling heart rate variability in healthy humans: A turbulence analogy. Phys Rev Lettn 86: 1650-1653.
- Bernaola GP, Ivanov PC, Amaral LA, Stanley HE (2001) Scale invariance in the non-stationarity of human heart rate. Phys Rev Lett 87: 168105-168109.
- Lass J (2002)Biosignal interpretation: study of cardiac arrhythmias and electromagnetic field effects on human nervous system (PhD thesis). TTU press, Tallin.
- Yoshikawa Y, Yasuda Y (2003) Non-linear dynamics in heart rate variability in different generations. Bull Toyohashi Sozo Coll 7:63-78.
- Ivanov PC, Amaral LAN, Goldberger AL, Havlin S, Rosenblum MG, et al. (1999) Multifractality in human heartbeat dynamics. Nature 399:461-465.
- Amaral LAN, Ivanov PC, Aoyagi N, Hidaca I, Tomono S, et al. (2001) Behavioral-independent features of complex heartbeat dynamics. Phys Rev Lett 86:6026.
- Wang J, Ning X, Chen Y (2003) Multifractal analysis of electronic cardiogram taken from healthy and unhealthy adult subjects. Physica A 323: 561-568.
- Rodriguez-Bermudez G, Garcia-Laencina PJ (2015) Analysis of EEG signals using nonlinear dynamics and chaos: A review. App Math Info Sci 9:2309-2321.
- Ahmadlou M, Adeli H, Adeli A (2010) New diagnostic EEG markers of the Alzheimers disease using visibility graph. J Neural Transm (Vienna) 117:1099-1109.
- Acharya RU, Faust O, Kannathal N, Chua TL, Laxminarayan S (2005) Nonlinear analysis of EEG signals at various sleep stages. Comput Methods Programs Biomed 80:37-45.
- Ansakorpi H, Korpelainen JT, Suominen K, Tolonen U, Bloigu R, et al. (2011) Evaluation of heart rate variation analysis during rest and tilting in patients with temporal lobe epilepsy. Neurol Res Int 829365.
- Jiang S, Bian C, Ning X, Ma QDY (2013) Visibility graph analysis on heartbeat dynamics of meditation training. Appl Phys Lett 102: 253-702.
- Dutta S, Ghosh D, Samanta S, Dey S (2014) Multifractal parameters as an indication of different physiological and pathological states of the human brain. Physica A 396:155-163.
- Ghosh D, Dutta S, Chakraborty S (2014) Multifractal detrended cross-correlation analysis for epileptic patient in seizure and seizure free status. Chaos Soli Fract 67: 1-10.
- Makowiec D, Galaska R, Dudkowska A, Rynkiewicz A, Zwierz M (2006) Long-range dependencies in heart rate signals-revisited. Physica A 369:632-644.
- Makowiec D, Dudkowska A (2007) Multifractal analysis of normal RR heart-interbeat signal s in power spectra ranges.
- Galaska R, Makowiec D, Dudkowska A, Koprowski A, Chlebus K, et al. (2008) Comparison of wavelet transform modulus maxima and multifractal detrended fluctuation analysis of heart rate in patients with systolic dysfunction of left ventricle. Ann NoninvasiveElectrocardiol13:155-164.
- Kantelhardt JW, Zschiegner SA, Bunde EK, Havlin S, Bunde A, et al. (2002) Multifractal detrended fluctuation analysis of nonstationary time series. Physica A 316: 87-114.
- Telesca L, Lapenna V, Macchiato M (2004) Mono- and multi-fractal investigation of scaling properties in temporal patterns of seismic sequences. Chaos Soli Fract 19:1-15.
- Telesca L, Lapenna V, Macchiato M (2005) Multifractal fluctuations in earthquake-related geoelectrical signals. New J Phys 7: 214-215.
- Movahed MS, Jafari GR, Ghasemi F, Rahvar S, Rahimi TMR (2006) Multifractal detrended fluctuation analysis of sunspot time series. J Stat Mech P02003.
- Shang P, Lu Y, Kamae S (2008) Detecting long-range correlations of traffic time series with multifractal detrended fluctuation analysis. Chaos Soli Fract 36:82-90.
- Lan TH, Gao ZY, Ahmed NA, Cheng B, Wang S (2008) Detrended fluctuation analysis as a statistical method to study ion single channel signal. Cell Biol Int 32:247-252.
- Yuan Y, Zhuang XT, Jin X (2009) Measuring multifractality of stock price fluctuation using multifractal detrended fluctuation analysis. Physica A 388:2189-2197.
- Ives JR, Mainwaring NR, Krishnamurthy KB, Blum AS, Drislane FW, et al. (1996) Technical implementation and clinical findings/results of monitoring oxygen saturation in patients referred for long-term EEG monitoring. Electroencephalogr Clin Neurophysio 99: 432-439.
- Kantelhardt JW, Rybski D, Zschiegner SA, Braun P, Bunde EK, et al. (2003) Multifractality of river runoff and precipitation: Comparison of fluctuation analysis and wavelet methods. Physica A 330: 240-245.
- Ashkenazy Y, Havlin S, Ivanov PC, Peng CK, Frohlinde VS, et al. (2003) Magnitude and sign scaling in power-law correlated time-series, Physica A 323:19-41.
- Parisi G, Frisch U (1985) Turbulence and predictability in geophysical fluid dynamics and climate dynamics. Elsevier Science Ltd.
- Ashkenazy Y, Hausdroff JM, Ivanov PC, Stanley HE (2002) Stochastic model of humain gait dynamics. Physica A 316: 662-670.
- Shimizu Y, Thurner S, Ehrenberger K (2002) Multifractal spectra as a measure of complexity in human posture. Fractals 10: 103-116.
- Ashkenazy Y, Baker DR, Gildor H, Havlin S (2003) Nonlinearity and multifractality of climate change in the past 420,000 years. Geophys Res Lett 30:2146-2149.
- Kantelhardt JW, Koscielny-Bunde E, Rego HHA, Havlin S, Bunde A (2001) Detecting long-range correlations with detrended fluctuation analysis. Physica A 295:441-454.
- Movahed S, Hermanis E (2008) Fractal analysis of river flow fluctuations (with Erratum). Physica A 387:915-932.
- Serrano E, Figliola A (2009) Wavelet leaders: A new method to estimate the multifractal singularity spectra. Physica A 388:2793-2805.
- Huang XY, Schmitt FG, Hermand JP, Gagne Y, Lu ZM, et al. (2011) Arbitrary-order Hilbert spectral analysis for time series possessing scaling statistics: Comparison study with detrended fluctuation analysis and wavelet leaders. Phys Rev E Stat Nonlinear Soft Matter Phys 84: 016208-016213.
- Oswiecimka P, Kwapien J, Drozdz S (2006) Wavelet versus detrended fluctuation analysis of multifractal structures. Phys Rev E 74: 06103-06137.
- Ma QDY, Bartsch RP, Bernaola-Galvn P, Yoneyama M, Ivanov PC (2010)Effect of extreme data loss on long-range correlated and anticorrelated signals quantified by detrended fluctuation analysis. Phys Rev E 81:031101.
- Dutta S (2010) Multifractal properties of ECG patterns of patients suffering from congestive heart failure. J Stat Mech P12021.