Keywords
Laryngeal disorders; Phonovibrograms; Phonetograms laryngo-stroboscopy
Introduction
Methods of advances in diagnoses of laryngeal disorders include 1) high speed films with kymography, 2) overtone analysis up to 20000 Hz prospects of calculation of stiffness, phonovibrograms, phonetograms and 3) overtone software. Stroboscopy does not give a correct picture of the vocal folds’ movements because it gives an average picture of 25 frames pr. Second. The vocal folds move 110-220 Hz during intonation in males and females on average. Therefore newer methods are necessary.
High Speed Films
High speed films are superior to clinical laryngo-stroboscopy in many areas of voice diagnostics. This explains why the diagnosis of nodules have been far too frequently used. An average picture of 25 frames per second seems not to be sufficient to diagnose nodules [1-3]. High speed films are able to capture 4000 or more images pr. second of the vocal area. Data are acquired with a high-speed camera recording in realtime during phonation of the vowel/a/. A rigid endoscope (90 optic, 9 mm diameter) is placed into the oropharynx coupled to a high-speed camera [4-6].
With the High Speed Endocam system there has been developed a software reproduction of the stiffness of single vocal fold movements with the Glottis Analysis programme (Wolf Ltd. HRES Endocam 5562 analytic system Richard Wolf GmbH, Pforzheimer Strasse 32, 75438 Knittlingen, Germany) [1,2] (Figures 1 and 2).
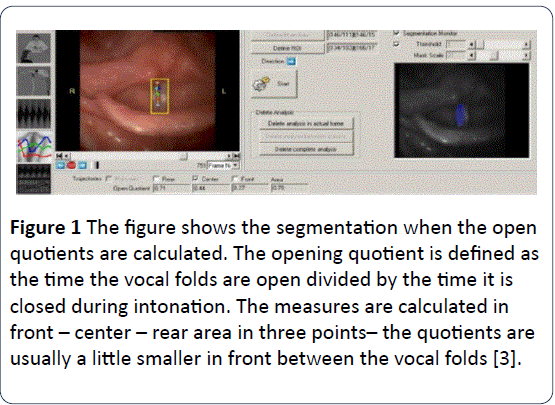
Figure 1: The figure shows the segmentation when the open quotients are calculated. The opening quotient is defined as the time the vocal folds are open divided by the time it is closed during intonation. The measures are calculated in front – center – rear area in three points– the quotients are usually a little smaller in front between the vocal folds [3].
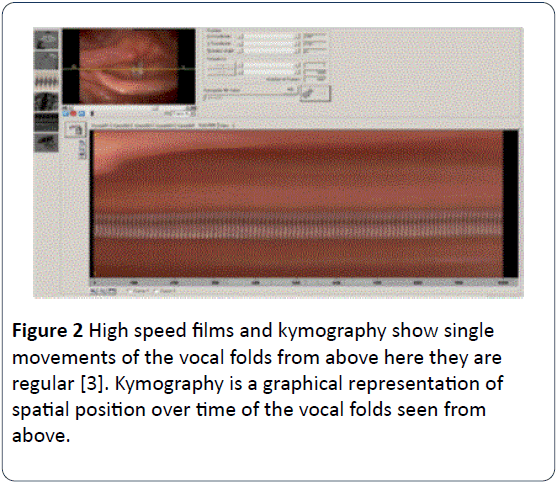
Figure 2: High speed films and kymography show single movements of the vocal folds from above here they are regular [3]. Kymography is a graphical representation of spatial position over time of the vocal folds seen from above.
High speed films and mean stiffness
Segmentation as seen in Figure 3 the set-up for calculation of measurements of mean stiffness of the Glottal Area Wave form (GAW). The GAW is derived from high speed films and describes the vocal fold movements during intonation. GAW curves show how the area between the vocal folds increase and decrease. Stiffness is one of many measures that can be calculated from the data from the GAW curves.
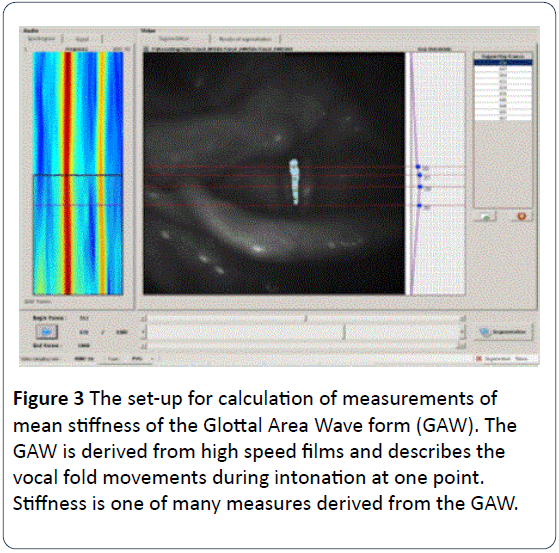
Figure 3: The set-up for calculation of measurements of mean stiffness of the Glottal Area Wave form (GAW). The GAW is derived from high speed films and describes the vocal fold movements during intonation at one point. Stiffness is one of many measures derived from the GAW.
The formula for stiffness
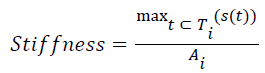
Where Ti is the duration of ith cycle in miliseconds (ms), Ai is the dynamic range (max-min) for ith cycle and s(t) is the magnitude of the 1st derivative of considered signal for ith cycle (t C (Ti) [2]. This formula has been used to compare normality with pathology of vocal folds [3].
Difference in stiffness
A difference in stiffness of the vocal folds single movements is measured comparing trained and non-trained voice users. The objective in a study was to evaluate the method based on software reproduction of the vocal fold movements, that is included in Glottis Analysis Tools used together with high speed films [4].
Trajectories
Trajectories are like kymograms. The diagram in Figure 4 shows the vocal cords in a 50% distance from the posterior border (therefore called [Traj-50%]). The trajectorie curves uses data derived from high speed films and shows the distance between the vocal folds at the 50% distance from the posterior border.
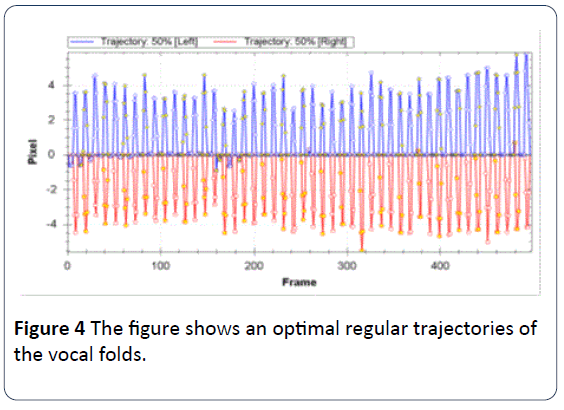
Figure 4: The figure shows an optimal regular trajectories of the vocal folds.
Trajectories of a 59 years old male is presented with acute laryngitis in Figure 5.
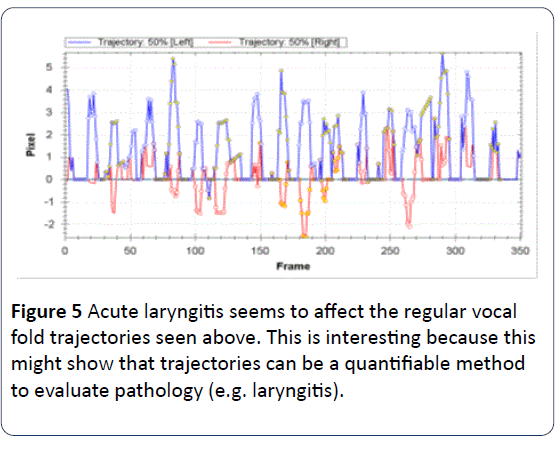
Figure 5: Acute laryngitis seems to affect the regular vocal fold trajectories seen above. This is interesting because this might show that trajectories can be a quantifiable method to evaluate pathology (e.g. laryngitis).
High speed films and phonovibrograms
The results of the segmentation of single vocal folds movement are shown in Figures 6 and 7. The Glottal Area Wave form (GAW) are shown with frames on the horizontal axis and pixel on the vertical axis [5].

Figure 6: Analysis functions of the glottis analysis program.
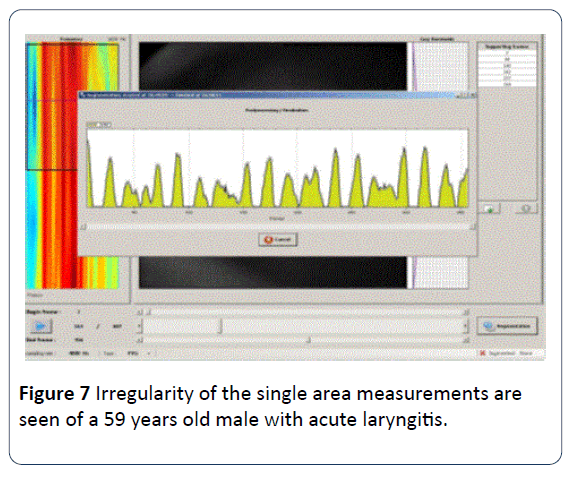
Figure 7: Irregularity of the single area measurements are seen of a 59 years old male with acute laryngitis.
Figures 6 and 7 shows the analysis functions of the Glottis Analysis Program [2]. The single movements presenting the area between the vocal Folds of the phonovibrogram of a optimal functioning female voice as defined in the software [2].
Irregularity of the single area measurements are seen of a 59 years old male with acute laryngitis in Figure 7.
There is a big difference to Figure 8. Single movements are irregular. This calculation is used statistically in the following tables.
Phonovibrogram of an optimally functioning female voice, showing the regularity of single movements of the right and left vocal folds (Figure 9).
Phonovibrogram with single movements of the right and left vocal cord of a 59 years old male with dysphonia due to a heavy acute laryngitis (Figure 10 and 11).
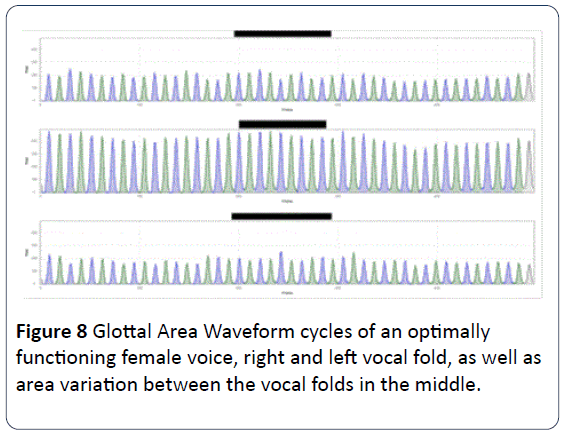
Figure 8: Glottal Area Waveform cycles of an optimally functioning female voice, right and left vocal fold, as well as area variation between the vocal folds in the middle.
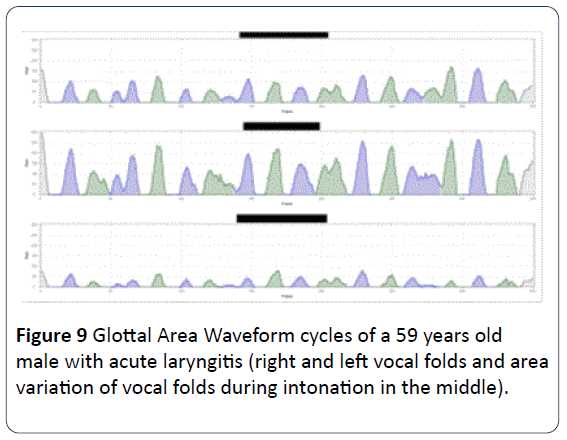
Figure 9: Glottal Area Waveform cycles of a 59 years old male with acute laryngitis (right and left vocal folds and area variation of vocal folds during intonation in the middle).
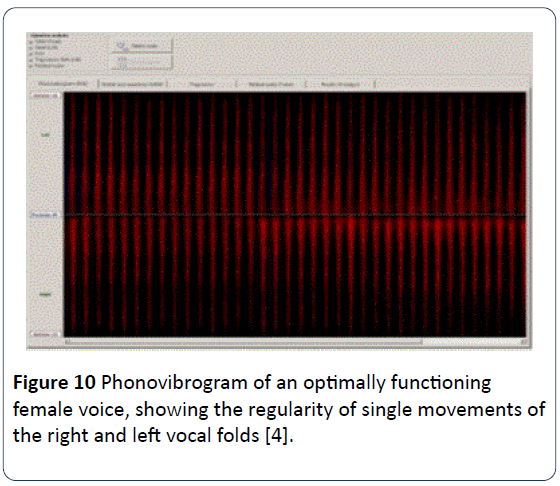
Figure 10: Phonovibrogram of an optimally functioning female voice, showing the regularity of single movements of the right and left vocal folds [4].
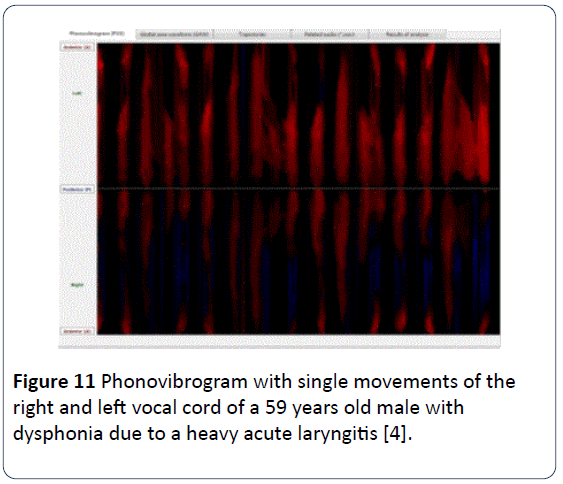
Figure 11: Phonovibrogram with single movements of the right and left vocal cord of a 59 years old male with dysphonia due to a heavy acute laryngitis [4].
Calculated measures for the signals of glottal area waveform and glottal trajectories
Figure 12 shows the huge variation of the stiffness of the 16 movements of the vocal folds in the patients with laryngitis (red dotted line) compared with the small variations of the 48 movements of the optimally functioning female voice (Tables 1 and 2).
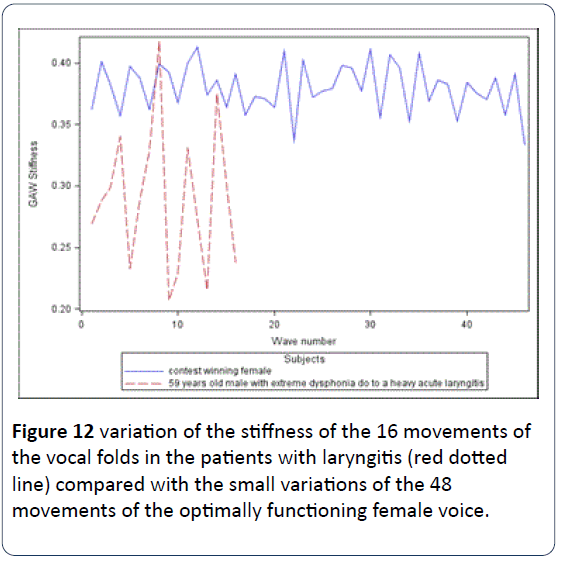
Figure 12: variation of the stiffness of the 16 movements of the vocal folds in the patients with laryngitis (red dotted line) compared with the small variations of the 48 movements of the optimally functioning female voice.
| |
|
|
(Mean) |
(Std) |
(Min) |
(Max) |
| Stiffness |
(GAW) |
|
0,38 |
0,02 |
0,333 |
0,413 |
| Stiffness |
(GAW) |
(Left) |
0,391 |
0,024 |
0,338 |
0,432 |
| Stiffness |
(GAW) |
(Right) |
0,395 |
0,024 |
0,352 |
0,451 |
| Stiffness |
(Traj-50%) |
(Left) |
0,483 |
0,043 |
0,371 |
0,625 |
| Stiffness |
(Traj-50%) |
(Right) |
0,486 |
0,029 |
0,392 |
0,513 |
Table 1: 48 movements of the vocal folds of an optimally functioning female voice. Statistical calculations are presented for the stiffness based on Glottal Area Waveform (GAW) – Mean, standard deviation, minimum and maximum stiffness, we also present the stiffness for the left and the right vocal fold as well as the stiffness based on trajectories.
| |
|
|
(Mean) |
(Std) |
(Min) |
(Max) |
| Stiffness |
(GAW) |
|
0,29 |
0,059 |
0,207 |
0,418 |
| Stiffness |
(GAW) |
(Left) |
0,313 |
0,056 |
0,232 |
0,444 |
| Stiffness |
(GAW) |
(Right) |
0,298 |
0,04 |
0,215 |
0,376 |
| Stiffness |
(Traj-50%) |
(Left) |
0,356 |
0,069 |
0,251 |
0,479 |
| Stiffness |
(Traj-50%) |
(Right) |
0,288 |
0,037 |
0,248 |
0,323 |
Table 2: 16 movements of the vocal folds from a 59 years male with extreme dysphonia due to a heavy acute laryngitis: Statistical calculations are presented for the stiffness based on Glottal Area Waveform (GAW) – Mean, standard deviation, minimum and maximum stiffness, we also present the stiffness for the left and the right vocal fold as well as the stiffness based on trajectories.
Statistical analysis of stiffness
In Table 3 a statistical comparison of stiffness measurements of the two subjects can be done under the assumption that all the measurements on the same subject follow the same Normal distribution. The hypothesis that the variation is the same for the two subjects can be tested in the likelihood ratio test, where the -2log likelihood difference is chi-square distributed with 1 degree of freedom, when it is assumed that the measurements have different means for the two subjects.
| Statistical model |
-2 log
likelihood |
Likelihood
ratio test
statistic |
P-value (chi-aquare
distribution with 1
degree of freedom) |
Subjects have
different mean
and variance |
-261.2 |
|
|
Subjects have
different mean
and same variance |
-228.6 |
33.3 |
< 0.00001 |
Table 3: A statistical comparison of stiffness measurements of the two subjects can be done under the assumption that all the measurements on the same subject follow the same Normal distribution.
Statistical conclusions of tables 1, 2 and 3
The statistical model shows that there is a statistical significant difference in the variation of the Glottal Area Waveform stiffness between the two subjects.
Table 4 shows Amplitude Symmetry is a formula used for quantifying how much the amplitude in a signal (in this case Trajectory curves) vary during intonation. The data analysis shows the female singer listed as "Singer observation", as well as an average of 12 hoarse patients from a voice data material listed as "Group average", hold up against the man with acute laryngitis (_A001(SegFr_7-356)) listed as "Observation".
| Parameter |
Source |
Person |
Laryngitis observation |
Group average |
Singer observation |
| Amplitude-Symmetry |
[Traj-50%] |
_A001(SegFr_7-356) |
15796.53 |
1317.43 |
0.95 |
| Amplitude-Symmetry-Index |
[Traj-50%] |
_A001(SegFr_7-356) |
0.3 |
0.71 |
0.86 |
Table 4: Amplitude Symmetry is a formula used for quantifying how much the amplitude in a signal (in this case Trajectory curves) vary during intonation.
The table shows an Amplitude-Symmetry deviation between the singer and the male with acute laryngitis. A significant difference in Amplitude – Symmetry- Index is also seen (p<0.0001).
Segmentation curves for high speed film of dystonia patients
Calculations of open quotients in the front, center and rear parts of the vocal cords (Figure 13).
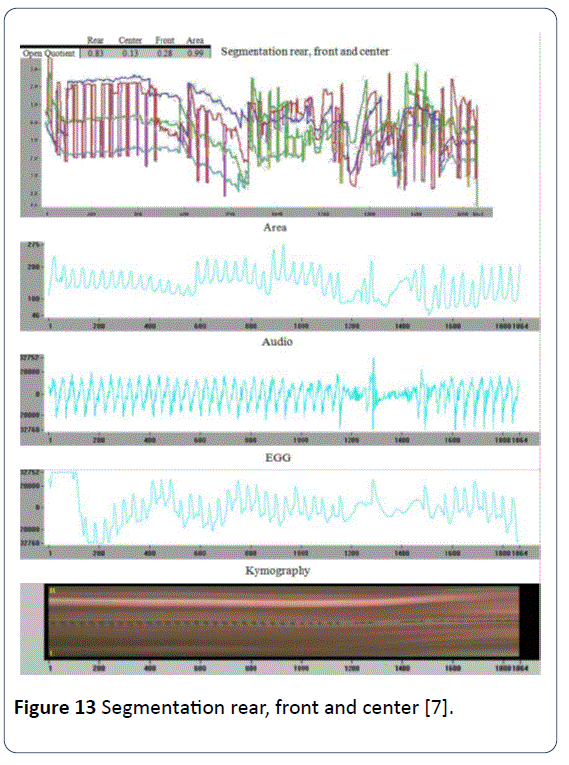
Figure 13: Segmentation rear, front and center [7].
Visual irregularities illustrated due to a dystonia spasm – on movement curves of the vocal cords in front, center and rear, as well as area-, acoustical-, electroglottographical-, and kymographical curves [7].
Our first dystonia patient where high speed images were used to document changes, had total elimination of universal dystonia symptoms with local cortison inhaler in the larynx and the antihistamin fexofenadine referring to the research by Ludlow [8] (Figure 14). In addition high speed films showed regularity of laryngeal actions after the referred treatment. The elimination of dystonia in the larynx and in other parts of the body in some of these patients suggested a relationship between immunological deficiencies of the upper airways and the nature of dystonia, with relapses when the medication was terminated [7].
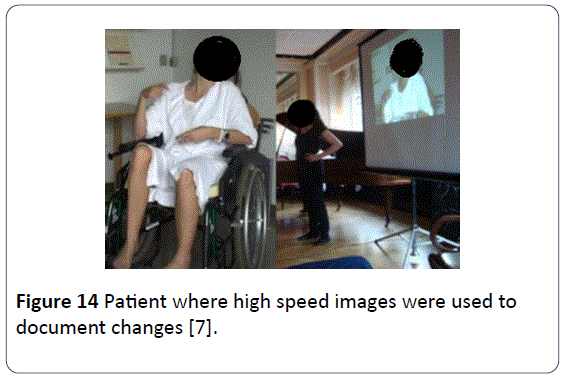
Figure 14: Patient where high speed images were used to document changes [7].
Overtone Analysis is Another Promising Software
High speed films were carried out combined with acoustical measures analyzed with” Sygyt Ltd.” of a prospective cohort study of 12 normal persons, formants between 1000 – 5000 Hz and the variation in procent (Figure 15). It was shown that the normal variation of the formants found in the area was between 18% and 25% (Table 5). In pathology the formant variation but also the dispersion of harmonics is much bigger.
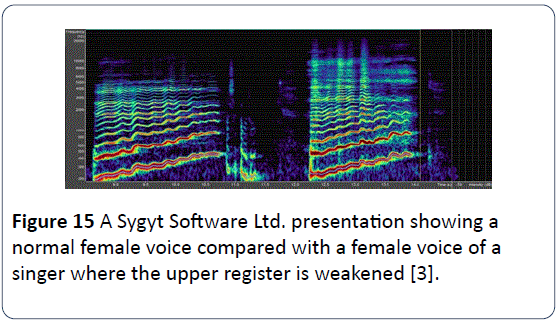
Figure 15: A Sygyt Software Ltd. presentation showing a normal female voice compared with a female voice of a singer where the upper register is weakened [3].
| Nr. |
Name |
Gender |
Age |
ms |
F0 (Hz) |
F0 (dB) |
(Fa) (Hz) |
(Fa) (dB) |
Fx (Hz) |
Fx (dB) |
Fy (Hz) |
Fy (dB) |
Fz (Hz) |
Fz (dB) |
| 1 |
MP-A |
K |
75 |
520 |
327 |
64 |
|
|
1320 |
35 |
2312 |
34 |
3271 |
18 |
| 2 |
ACA-A |
K |
25 |
70 |
251 |
48 |
|
|
1261 |
33 |
2241 |
30 |
4025 |
28 |
| 3 |
LTC-A |
K |
40 |
1130 |
329 |
45 |
|
|
1401 |
28 |
2295 |
20 |
3357 |
9 |
| 4 |
KJH-A |
K |
47 |
850 |
142 |
15 |
|
|
1293 |
39 |
2328 |
24 |
3028 |
27 |
| 5 |
SM-A |
K |
24 |
900 |
307 |
38 |
|
|
1606 |
38 |
3206 |
25 |
4004 |
26 |
| 6 |
NBL-A |
K |
25 |
640 |
377 |
64 |
|
|
1131 |
23 |
2258 |
22 |
3411 |
14 |
| 7 |
AJ-A |
M |
24 |
120 |
216 |
56 |
|
|
1293 |
48 |
2371 |
40 |
3449 |
40 |
| 8 |
MSM-A |
M |
23 |
1060 |
158 |
38 |
|
|
1115 |
38 |
2549 |
29 |
3341 |
21 |
| 9 |
BHA-A |
M |
22 |
1210 |
266 |
47 |
|
|
1320 |
51 |
2904 |
30 |
4230 |
20 |
| 10 |
MO-A |
M |
28 |
440 |
211 |
49 |
|
|
1077 |
42 |
2373 |
28 |
4694 |
19 |
| 11 |
AH-A |
M |
16 |
430 |
139 |
42 |
|
|
1385 |
23 |
2500 |
28 |
3336 |
16 |
| 12 |
JJ-B |
M |
33 |
160 |
196 |
20 |
|
|
1040 |
12 |
1697 |
12 |
2204 |
19 |
| Difference to sygyt sound analysis of 12 normal persons |
| Coefficient of variation (cv) |
| |
|
|
|
mean |
|
|
1513.5 |
|
2548.4 |
|
3834.8 |
|
| |
|
|
|
change mean |
|
|
243.3 |
|
128.9 |
|
305.7 |
|
| |
|
|
|
std |
|
|
270 |
|
632.7 |
|
923.4 |
|
| |
|
|
|
cv |
|
|
18% |
|
25% |
|
24% |
|
Table 5: Variation of 3 formants 1000-5000Hz [9].
Phonetograms of Boys and Girls
Average phonetograms with standard deviation for a cohort of 4 sopranos and of 4 pubertal change groups (mutants) from the Leipzig Thomaner choir is shown in Figure 16. (The hormonal parameters were similar to those of the Copenhagen boys).
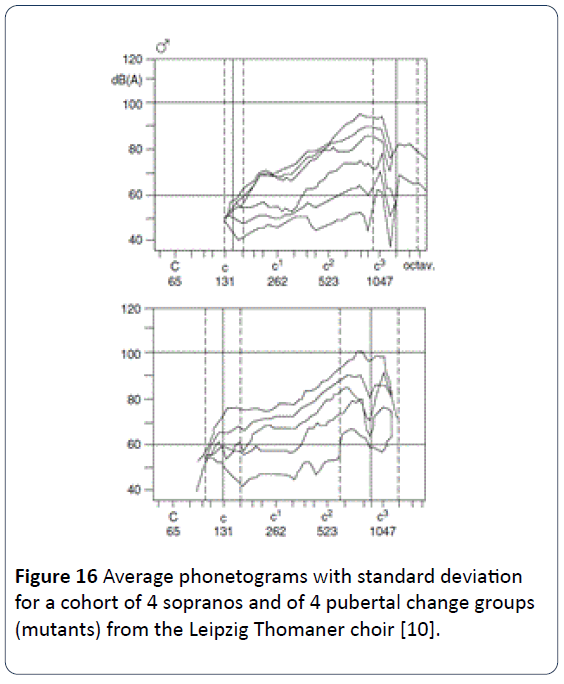
Figure 16: Average phonetograms with standard deviation for a cohort of 4 sopranos and of 4 pubertal change groups (mutants) from the Leipzig Thomaner choir [10].
Average phonetograms and standard deviations for three choirboys (I–III) involved in a prospective longitudinal study in the 8th grade in a singing school are shown in Figure 17. The phonetograms before and after the mutational change of voice were compared. For test person I and II, only one phonetogram was made in mutation and before mutation respectively. For test person III, three phonetograms were measured before and three during the change of voice.
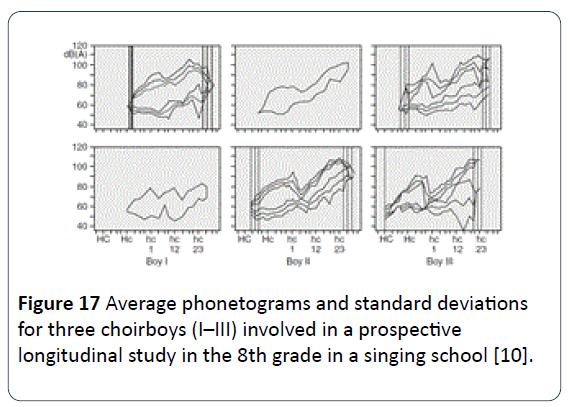
Figure 17: Average phonetograms and standard deviations for three choirboys (I–III) involved in a prospective longitudinal study in the 8th grade in a singing school [10].
Average phonetograms with standard deviation for boys and young men from a boys’ choir at a Danish choir school, as a function of voice type are presented in Figure 18. (The voice type was determined by the singing teacher.) The abcissa is divided up into semitones, and the frequency in Hertz of each octave is indicated. The scale of the ordinate is dB(A).
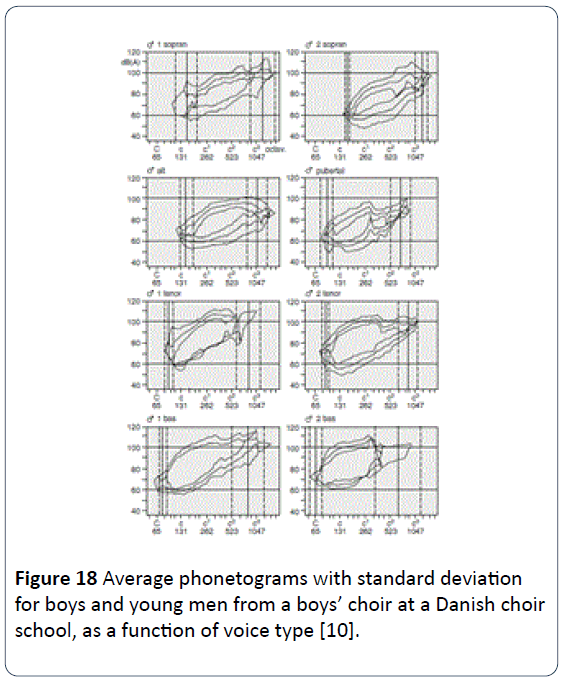
Figure 18: Average phonetograms with standard deviation for boys and young men from a boys’ choir at a Danish choir school, as a function of voice type [10].
Average phonetograms with standard deviation for girls and young women from a girls’ choir at a Danish choir school, as a function of voice type are presented in Figure 19. (The voice type was determined by the singing teacher). The abcissa is divided up into semitones, and the frequency in Hertz of each octave is indicated. The scale of the ordinate is dB(A). One group could not be securely defined during puberty.
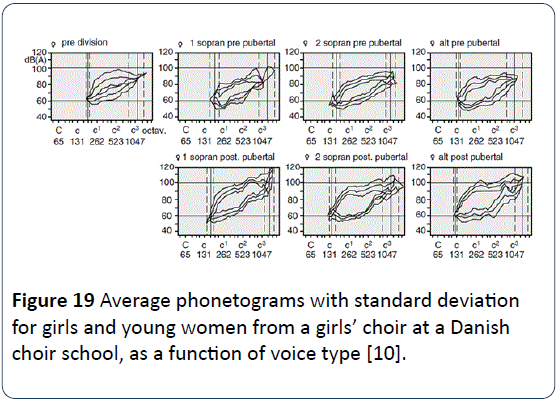
Figure 19: Average phonetograms with standard deviation for girls and young women from a girls’ choir at a Danish choir school, as a function of voice type [10].
Dys-functional voices showing reduced phonetograms in brain damaged young people
A1-A2. 5 severely disturbed male voices (Phonetogram surface improves 70-115 half tones x dB). B1-B2. 5 moderate impaired male voices (Phonetogram surface improves 207-246 half tones x dB) [11] (Figure 20 and Table 6).

Figure 20: Brain-damaged patients before and after treatment. Phonetogram averages and standard deviation.
Flow Measurements have also been Tried
| |
Average |
SD |
Correlation |
Of interest |
| Age |
35 years |
|
14(-48) |
15(-44) |
| Peakflow |
7739ml/s |
1802 |
4(.43) |
5(.47) |
| vital capacity |
4052 ml |
947 |
4(.88) |
10(.70) |
| Maximal phonation time |
3170 ml |
989 |
5(.48) |
10(.57) |
| Phonation |
17 s |
9 |
6(-.47) |
8(-.69) |
| stability of the fundamental frequency |
13.00% |
9.9 |
11(-.43) |
|
| Stability of SPL |
0.4dB |
0.2 |
12(-.42) |
|
| Average air flow velocity |
|
|
9(.96) |
11(-.15) |
| Phonation quotient |
275.8 ml/s |
33 |
|
11(-15) |
| Quotient of air consumption (average wind velocity / phonation quotient) |
77.50% |
10.10% |
11(.31) |
|
| Phonetogram areal in half tones x dB |
224 |
177 |
1(.67) |
12(.49) |
| Maximal dynamics |
19.5dB |
5.4 |
15(.60) |
14(.51) |
| lowest tone of phonegram (geometric average) |
106Hz |
18 |
14(-.45) |
|
| Half tones of phonetogrammes |
24 |
8 |
15(.95) |
|
| highest ton of phonetogrammes |
438 Hz |
166 |
|
|
| (p < 0.05 über .51; P <0.01 über 0.60 |
|
|
|
|
Table 6: Multivariate statistical analysis in 16 male brain injury (SAS Statistics).
Discussion and Conclusion
Till now we have seen a difference between high quality voices and other voices with advanced measures and based on high speed film and overtone analysis as well as phonograms and air flow. We presented a quantified measure of the vocal fold stiffness calculated from individual vocal cycles and average measures during voice development related to hormones and in pathology of brain damaged patients and dystonia.
It is our impression that the system Glottis Analysis Tools stiffness calculations can be used clinically to differentiate between high and low quality voices as well as pathology.
In the future, high speed films including stiffness of phonovibrograms together with overtones might be used to determine the treatment effect in voice pathology. It is easier to use than air flow and phonetograms. Still there might be different options dependent on development in equipment for clinical use.
11111
References
- Deliyski DD, Hillman RE (2010) State of the art laryngeal imaging: research and clinical implications. CurrOpinOtolaryngol Head Neck Surg 18: 147-152.
- Döllinger M, Hoppe U, Hettlich F, Lohscheller J, Schuberth S, et al. (2002) Vibration parameter extraction from endoscopic image series of the vocal folds. IEEE Trans Biomed Eng 49: 773-781.
- Pedersen M, Akram BH, AgerstedAA (2015) Technology advances in diagnostics of vocal folds function. Otolaryngology 5: 1-5.
- Pedersen M, Eeg M, Akram B, Agersted ABA, Jønsson A (2015) Can phonovibrograms be used in clinical voice pathology? J JOtolaryn 1: 1-4.
- Lohscheller J, Eysholdt U, Toy H, Dollinger M (2008) Phonovibrography: mapping high-speed movies of vocal fold vibrations into 2-D diagrams for visualizing and analyzing the underlying laryngeal dynamics. IEEE Trans Med Imaging 27: 300-309.
- Pedersen M, Eeg M, Jønsson A, Mahmood S (2015) Chapter 8. Working with Wolf Ltd. HRES Endocam 5562 analytic system for high-speed recordings 1: 57-65.
- Pedersen M, Eeg M (2012) Does treatment of the laryngeal mucosa reduce dystonic symptoms? A prospective clinical cohort study of mannose binding lectin and other immunological parameters with diagnostic use of phonatory function studies. Eur Arch Otorhinolaryngol 269: 1477-1482.
- Simonyan K, Ludlow CL (2012) Abnormal structure-function relationship in spasmodic dysphonia. Cereb Cortex 22: 417-425.
- Pedersen M (2015) Aspects of resonance: C omparison of high speed films and overtone measurements.J Health Edu Res Dev 3: 145.
- Pedersen M (2008) Normal development of voice in children – Advances in evidence-based standards. Springer 54-57.
- Pedersen M (1995) Stimmfunktionvor und nachBehandlung von Hirngeschädigten. MitStroboskopie, Phonetographie und Luftstromanalysedurchgefürht. Sprache,Stimme,Gehöhr 19: 84-89.

