William R Mills*, Kendall Law, Ronald Boyd, Wes Conkrite, Shauen Howard, Sheryl Zerbe, Robert Barnes, Susan Sender and Laurie Babin
BrightSpring Health Services, USA
- *Corresponding Author:
- William R. Mills
Senior Vice President
Medical Affairs BrightSpring Health Services
805 N. Whittington Parkway, Louisville, KY 40222, USA
E-Mail: William.Mills@brightspringhealth.com
Received Date: May 09, 2020; Accepted Date: May 18, 2020; Published Date: May 27, 2020
Citation: Mills WR, Law K, Boyd R, Conkrite W, Howard S, et al. (2020) Hospitalization Rate and Days Spent at Home as Value-Based Outcome Measures for People with Intellectual and Developmental Disability. Health Sci J. 14 No. 3: 717.
DOI: 10.36648/1791-809X.14.2.717
Keywords
Days spent at home; IDD; Hospitalization rate
Introduction
Although there has been increased usage of quality measures and standards in many population health initiatives in the U.S. in the past decade, there is little research about which standards should be used for long term services and supports (LTSS) for people with intellectual and developmental disabilities (IDD) [1]. Hospitalization rate is an outcome measure that is being used as a reportable measure in many value-based payment models, including patient-centered medical homes, accountable care organizations and by Medicare Advantage and Managed Medicaid plans. Days spent at home is a person-centered outcome measure that can measure the time people with chronic and serious conditions spend in the community, and outside of hospitals and nursing homes [2-4]. New models for population management, including the Centers for Medicare and Medicaid Innovation (CMMI)’s Primary Care First and Seriously Ill Population Models, have included hospitalization rate and days spent at home as outcome measures to align patient, provider and payer goals of producing quality care at a lower cost [5]. We sought to build an algorithm to determine the annual hospitalization rate and mean days spent at home by the population of people intellectually and developmentally disabled who are enrolled in community-based residential waiver programs, as value-based outcome measures for people with IDD.
Methods
Between October 1, 2018 and September 30, 2019, our IDD residential waiver programs provided continuous personcentered support and medically-necessary services to a cohort of individuals living in community-based settings. Services were provided to individuals who were living in an apartment or home with others, at home with parents or other family, or in their own home, and were billed on a per diem basis. Each individual’s whereabouts each day was entered into a database (HCS Interactant®, Wall Township, NJ), recording whether the individual was at home, in the community receiving supportive services from our organization, or in other settings (hospital, nursing home, on leave or incarcerated) that day. We performed a retrospective review of this internal census tracking and length of stay database. Total managed days was calculated as the days an individual we served was utilizing our services minus days that the individual was on therapeutic leave, or incarcerated. Inpatient days per 1,000 per person served (the number of inpatient days that are used in a year for each thousand people served) was calculated as: inpatient days /managed client months) x 1000 clients x 12 months [6]. Days spent at home was calculated as total managed days minus days spent in hospitals or nursing homes. Hospitalization rate per 1,000 was calculated as (Admissions/(Managed Months/1,000) x 12) [7].
Results
We provided supportive services for 2,388 individuals with IDD in residential waiver programs during the study period. The population was spread among 12 states and were managed for a total of 745,957 days (Table 1). The mean age of this population was 46.6 (range 13-96). 80% of individuals were not hospitalized during the year. There were a total of 498 hospitalizations (240 hospitalizations per 1,000 managed months per year). Individuals we supported spent a total of 10,865 inpatient days in in hospitals or nursing homes (1.46%) and a total of 735,092 days at home (98.54%) during the study period. The residential waiver IDD cohort experienced 5,243 inpatient days per 1,000. Among the 20% of individuals with IDD who were hospitalized during the year, there was a large variance in inpatient length of stay (range 1-229 days). On an annual basis, this group of individuals with IDD in residential waiver services spent a mean of 360 days at home in the community, outside of hospitals and nursing homes. There was geographic variation in the number of days spent at home (Figure 1).
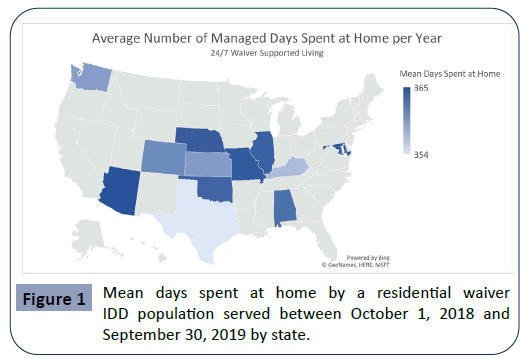
Figure 1: Mean days spent at home by a residential waiver IDD population served between October 1, 2018 and September 30, 2019 by state.
Table 1 Characteristics of people with IDD with population served by residential waiver programs between October 1, 2018 and September 30, 2019.
| Individuals supported (n) |
2,388 |
| Age (y) |
46.6 |
| Total Managed Days (n) |
745,957 |
| Hospitalizations (n) |
498 |
| Hospitalization Rate per 1,000 per year |
240 |
| Inpatient Days (n) (%) |
10,865 (1.5%) |
| Days Spent at Home (n) (%) |
735,092 (98.5%) |
| Inpatient Days per 1,000 (n) |
5,243 |
| Mean Days Spent at Home Per Year (n) |
360 |
Discussion
As demonstration of value-based outcomes becomes increasingly important, establishing evidence-based quality standards and guidelines for people with IDD is essential. Hospitalization rate is increasingly being used as a means of measuring acute care utilization in managed populations by value-based care initiatives. There is limited hospitalization rate data currently available for people with IDD. However, tracking hospitalizations and building programs to help reduce ambulatory-sensitive hospitalizations can be a worthy goal for provider organizations, states and payer sources. In this study, people with IDD in our residential waiver program were hospitalized at a rate of 240 hospitalizations per 1,000 per year. This rate is similar to the average U.S. hospitalization rate reported in the Medicare population. While younger (average age 46.6), our study population of people with IDD was complex, with most individuals having concomitant IDD, medical and behavioral diagnoses. Compared to an internal intermediate care facility (ICF) population of people with IDD studied over the same time period, we found that the residential waiver individuals had a higher number of inpatient days per 1,000 than the ICF population (5,242 days per 1,000 vs. 3,653 days per 1,000). While 80% of our residential waiver IDD clients were not hospitalized at all during the year-long study period, a subset of those had long inpatient length of stays (range 1-229 days). In fact, 29 clients in our residential waver IDD program had a total inpatient length of stay of greater than 100 days due to severe behavioral and other conditions, refractory to routine outpatient treatment. Although the type of inpatient hospital was not tracked in the current study, a significant proportion of long length of stays were likely in behavioral health hospitals. Studies of new models of support and care for people with IDD in which augmented outpatient behavioral health supports are available are needed. Such studies should evaluate whether providing more intensive communitybased medical and behavioral health resources may decrease hospitalization rate and inpatient days per 1,000. Factors that may be contributing to the difference observed in inpatient days per 1,000 between the residential waiver population and the ICF population may include programmatic factors such as clinical staff and service provisioning, which are typically more structured in ICFs. We found that of the people with IDD that we support in our residential waiver programs, individuals spent an average of 360 days at home per year. Days spent at home is a simple, newer outcome measure that may help to align individuals receiving services, families, provider organizations and payers around the goal of enabling people with IDD to spend more time in the community and less time in institutional settings. We observed geographic variation in the days spent at home by state (Figure 1). Whether differences in the way that IDD residential waiver programs are resourced and paid in states led to this variation needs to be further studied. As a goal of organizations who provide support to people with IDD is enabling meaningful days, days spent at home in the community may be a simple metric to follow to promote provisioning of appropriate resources for IDD waiver programs, as well as for managed care payers [8-11].
Conclusion
In conclusion, hospitalization rate and days spent at home are emerging value-based outcome measures that could help organizations and policymakers develop programmatic enablers to help resource people with IDD to stay in community settings for as many days each year as possible.
Acknowledgements
A related abstract of this manuscript has been presented at The American Association on Intellectual and Developmental Disabilities 2020 Annual Meeting. The authors wish to express our most sincere gratitude to direct support personnel and caregivers who impact the lives of people with IDD every day.
26937
References
- Friedman C (2018) Building the Framework for IDD Quality Measures. Towson, Chicago, and Omaha: The Council on Quality and Leadership, the Institute for Public Policy for People with Disabilities, and Mosaic.
- Sayer C (2016) Time Spent at Home – A Patient-Defined Outcome. New England Journal of Medicine Catalyst.
- Groff AC, Colla CH, Lee TH (2016) Days Spent at Home – A Patient-Centered Goal and Outcome. N Engl J Med 375: 1610-1612.
- Mills WR, Law K, Boyd R (2020) Days Spent at Home as an Outcome Measure for People with Intellectual and Developmental Disability. American Association for Developmental and Developmental Disability Annual Meeting, 2020.
- (2020) Primary Care First Model Options. Centers for Medicare and Medicaid Services.
- McCall N, Geonnotti K (2015) Utilization Measures Worksheet. Mathematica Policy Research.
- Freeman WJ, Weiss AJ, Heslin KC (2018) Overview of U.S. Hospital Stays in 2016: Variation by Geographic Region. HCUP Statistical Brief #246. December 2018. Agency for Healthcare Research and Quality, Rockville, MD.
- McCall N, Geonnotti K (2015) Utilization Measures Worksheet. Mathematica Policy Research 2015.
- Davies S, Schmidt E, Schultz E, McDonald K (2010) Home and Community-Based Services Quality indicators. A Review of Literature Related to HCBS Populations.
- (2016) Quality Improvement for Individuals with Intellectual and Developmental Disabilities.

