Keywords
Unconditional cash transfer Programs; Beneficiary families; Egypt; Community based study
Introduction
Despite the major political changes that Egypt has experienced in the past few years, Egypt is now progressing with a new reform plan to achieve health equity and tackle social inclusion priorities [1]. In March 2015, the Egyptian government launched the Sustainable Development Strategy, Egypt vision 2030, where health and social justice were key pillars of the strategy [2]. One of the cornerstone policies that was endorsed in the social policy agenda is to expand the social protection nets through Cash Transfer (CT) Programs which is expected to improve all aspects of citizens’ lives including their health status [1]. The government together with the international funding agencies will increase allocations to CT programs through the expansion of the longestablished schemes and introduction of new ones [1,3,4].
CT is direct payment of money to eligible people on a monthly basis [5]. There are two types of CT programs; conditional cash transfer (CCT) which is conditional upon the receivers' actions as, for example, compliance to growth monitoring for children or using a family planning method or attending health education seminars at primary health care facilities. The other type is unconditional cash transfer (UCT) which is not linked to adherence to any actions other than fulfilling the eligibility criteria [6]. In Egypt, UCT is the traditional form of cash transfer under the auspices of the ministry of social solidarity covering 1.5 million families with a total annual allocation of about USD 9 billion in 2014. This scheme targets poor, marginalized segments of the community [1,3,4]. Meanwhile, CCT programs were undertaken only as small pilot trials [7].
Based on the fact that social determinants of health play a vital role in the cycle of “Health and Disease” [8], CT is expected to affect families’ health in several ways; income can improve the health outcomes through better nutrition and sanitation [9]. Moreover, money can help to cover costs directly associated with health services utilization, especially in a developing country like Egypt where most of the patients prefer the Out-Of-Pocket payment seeking a better quality of health care services [10,11].
However, there is very limited evidence, if any, documenting the impact of UCT on the health status of poor families in Egypt. Therefore, this study was conducted to analyze the impact of UCT programs on the health of the recipient families through a community based study. The objective of this study was to estimate morbidity, mortality, and total disease burdens as measures reflecting the health status, health service utilization and household expenditure on health care for two groups of families; those who are receiving UCT (Beneficiary families) and those who are not receiving CT (Non Beneficiary families) but sharing the same ecological conditions.
Methods
Study design, setting, and population
This is a community-based, cross sectional comparative study. A randomly-selected urban area (Shiakha) in the Old Cairo district in Cairo governorate - Egypt was selected. The total population was about 9000 (1800 families) [12]. The study included two groups of homogeneous families living under the same conditions; geographical location, nutritional values and social environment. The first group - Beneficiary Families – are those registered for and receiving the UCT at the Social Affairs Office (SAO), Egyptian Ministry of Social Solidarity (EMOSS). Eligibility criteria are mainly families with no male provider and families in which the husband is unable to work or incapable of earning a labor income [1,3,4]. The second group - Non Beneficiary Families – are those not receiving CT and are the neighbors of the first group. All families should have wives in the age group 20- 49 years. This age range was decided to ensure that the female got married (legal age of 1st marriage in Egyptian law is 18 years), had the chance of having at least one child if any, having more understanding of and still experiencing the family financial, social, and health,(especially reproductive health), responsibilities, and can express the family situation relatively more clearly than females outside this range.
Sample size and sampling technique
According to Saleh et al., and SAO-EMOSS, a total of 950 families had wives aged 20-49 years in the study area [13].
The sample size was estimated to be 400 families, all Beneficiary Families (n=200) registered at the SAO - EMOSS as receiving UCT and 200 Non Beneficiary Families (comparison group) living in the same buildings/streets. For each Beneficiary Family, the closest residence and wife’s age-matched. Non Beneficiary family was selected as a comparison family.
Data collection and management
Data collection: Home visits and structured interviews were conducted with the wives in the Beneficiary and Non Beneficiary Families. A pretested questionnaire form was used to collect data. This questionnaire form used by Egypt Household Health Service Utilization and Expenditure Survey had been used as a resource material during preparation of the study questionnaire form [14]. Household socio-demographic, morbidity, mortality data were collected together with data about health service utilization and expenditure on health during the three month period prior to the study.
Data management: Computer software program SPSS version 17.0 was used for data analysis. The chi squared test was used to examine the association between qualitative variables. T test was used to detect differences between means in quantitative variables. P value was considered significant if ≤ 0.05.
Definition of variables and indicators:
Crowding index: number of individuals living in the household / number of bedrooms.
Reported diseases: These are the chronic diseases reported by the wife as diagnosed by different medical consultations for each individual (currently alive or dead) of the family (no medical records were available to obtain data about different diseases of the family members). The list of diseases included 19 categories: 1-Hypertension 2-Joint diseases 3-Liver diseases 4-Gastro-intestinal tract (GIT) diseases 5-Diabetes 6- Eye diseases 7-Blood diseases 8-Heart diseases 9-Chest diseases 10-Genital diseases 11-Renal diseases 12-Neorological Diseases 13-Skin diseases 14-Psychological Diseases 15-Cancer 16-Bone diseases 17-Congenital Disability 18-Acquired Disability 19-Others.
Morbidity burden: Expressed in two ways 1) percent of family members who had reported chronic disease(s) 2) sum of years of disability as the duration of reported; disease(s) for those still alive or sum of years of disability as the duration of disease(s) for those who had reported disease(s) before death, irrespective to the cause of death .
Mortality burden: Expressed in two ways 1) percent of deaths among family members 2) years of life lost due to premature death for males and females based on the average life expectancy in Egypt 2008 at 69.9 years for males and 74.4 years for females [12].
Total disease burden (DB) at the family level: According to the Data for Decision Making (DDM) project , the estimated disease burden was calculated as the sum of three types of data [15]: (1) Years of disability as the duration of disease(s) for those who had reported disease(s) before death irrespective to the cause of death; (2) Years of life lost due to premature death for males and females based on the average life expectancy in Egypt 2008 at 69.9 years for males and 74.4 years for females [12] and (3) Years of disability as the duration of current disease(s) among alive individuals.
Extent of health service utilization: Those receiving health services for reported current diseases/illnesses in the three months preceding the study.
Expenditure on health: This includes the out of pocket money paid by the family to get health services or medications and the currency was transformed from the Egyptian Pounds to the United States Dollars (USD) .
Ethical consideration
Ethical approvals were obtained from Faculty of Medicine, Cairo University Ethical Review Committee and from the district SAO. Free informed consent from the head of the household was obtained during conduction of the home visits.
Results
The total number of families included in the study was 400 families: 200 Beneficiary Families and 200 Non Beneficiary Families. The informants were the married women aged 20-49 years in the study families. The total family members (before any mortality) included in the study were 1971 members (1014 related to Beneficiary Families and 957 related to Non Beneficiary Families). The currently alive family members were 1860 (927 related to Beneficiary Families and 933 related to Non Beneficiary Families) (Tables 1 and 2).
Table 1: Socio-demographic characteristics of Beneficiary and Non Beneficiary Families.
| Socio-demographic Characteristics |
Beneficiary Families (200 Families) |
Non Beneficiary Families (200Families) |
P* value |
| No. |
% |
No. |
% |
| Women’s Age |
| < 35 years old |
66 |
33 |
89 |
44.5 |
0.001 |
| 35 and above |
134 |
67 |
111 |
55.5 |
| Family Size (currently alive family members) |
| Mean Number Family Members |
4.6 |
4.7 |
0.13 |
| Education of Husbands |
| Non-educated |
109 |
54.5 |
57 |
28.5 |
0.001 |
| Primary- Secondary |
70 |
35 |
101 |
50.5 |
| High Education |
21 |
10.5 |
42 |
21 |
| Education of Wives |
| Non-educated |
115 |
57.5 |
70 |
36 |
0.001 |
| Primary- Secondary |
67 |
33.5 |
94 |
46.5 |
| High Education |
18 |
9 |
36 |
17.5 |
| Occupation of Husband (dead husbands are excluded n=28) |
| Not working |
80 |
46.5 |
9 |
4.5 |
0.001 |
| Working (Unstable job) |
45 |
26.2 |
62 |
31 |
| Working (stable job) |
47 |
27.3 |
129 |
64.5 |
| Occupation of Wives |
| Not working |
69 |
34.5 |
149 |
74.5 |
0.001 |
| Working (Unstable job) |
91 |
45.5 |
25 |
12.5 |
| Working (stable job) |
35 |
20 |
26 |
13 |
| Crowdedness Index |
| ≤ 2 persons /bed room |
79 |
39.5 |
94 |
47 |
0.13 |
| More than 2 persons /bed room |
121 |
60.5 |
106 |
53 |
| Family Income |
| Mean Monthly Income/family member |
USD19±13 |
USD30±22 |
0.001 |
*P is significant if <0.05
Table 2: Mortality, morbidity and disease burden among Beneficiary and Non Beneficiary Families.
| Number of Years lost due to: |
Beneficiary Families (Total family members1014) |
Non Beneficiary Families (Total family members 957) |
| Mortality burden |
| Premature mortality for all families |
3668.5 |
1695.1 |
| Mean number/ family member |
42.0 |
70.6 |
| Morbidity burden |
| Morbidity before death for all families |
526.7 |
2.5 |
| Mean duration of illness before death/dead family member |
6.1 |
0.13 |
| Current Morbidity for all families |
3799.4 |
3302.3 |
| Mean duration of illness/family member |
7.2 |
7.1 |
| Total disease burden |
| Total years lost for all families |
7994.6 |
4999.9 |
| Mean years lost / family member |
7.9 years/family member |
5.2 years/family member |
Socio-demographic characteristics
Table 1 illustrates the percent distribution of the study families, according to the socio-demographic background. There was a tendency for wives of Beneficiary Families to be in age group ≥ 35years (67%) compared to Non Beneficiary Families as the counterpart figure for women of age group ≥ 35was (55%; p=0.001).
Overall, 54.5% of husbands and 57.5% of wives in the Beneficiary Families were not educated compared with 28.5% of husbands and 36% of wives in the Non Beneficiary Families (p=0.001) (Table 1).
Regarding the working status, Table 1 shows a significant difference (p=0.001) in the proportion of unemployed husbands (46.5%) in the Beneficiary Families compared with unemployed husband (4.5%) in the Non Beneficiary Families. This significance was also apparent among wives in the two groups.
The living environment measured by crowdedness index pointed out that 60.5% of Beneficiary Families suffered from unfavorable housing conditions due to a high crowding index (more than two persons /bedroom), versus 53% of Non Beneficiary Families. However, this difference was not statistically significant (p=0.13). The mean (±SD) per capita monthly income for Beneficiary Families was USD 19± (13) versus USD 30 (± 22) for Non Beneficiary Families (p<0.001) (Table 1).
Figure 1 illustrates the types of socioeconomic crises that made Beneficiary Families eligible for the CT Program. Divorce/ separation ranked the first cause (31%) followed by husbands’ death (23%) and non- working (23%).
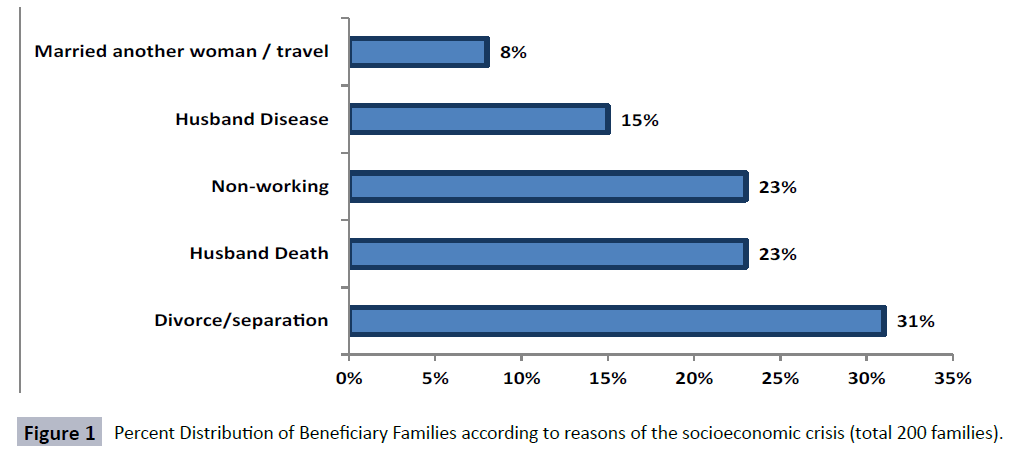
Figure 1: Percent Distribution of Beneficiary Families according to reasons of the socioeconomic crisis (total 200 families).
Morbidity, mortality, total disease burden and extent of health service utilization:
Figure 2 demonstrates the morbidity and mortality burden at family level expressed as the percent of family members with premature death, current chronic diseases and receiving health services. Beneficiary Family members (92 member, 9%) were over 3.5 times more likely to be more vulnerable to premature mortality than Non Beneficiary Families (29 member, 3%) (p=0. 00, OR=3.6, CI=2.3 -5.8). Despite that, about one third of members in both groups of families had reported chronic morbidity (p=0.6, OR 1.04, CI=0.9-1.3), 31% of Beneficiary Family members reported receiving health services in the last three months versus 35% of Non Beneficiary Family members (p=0.03, OR = 0.8, CI=0.7; 0.98).
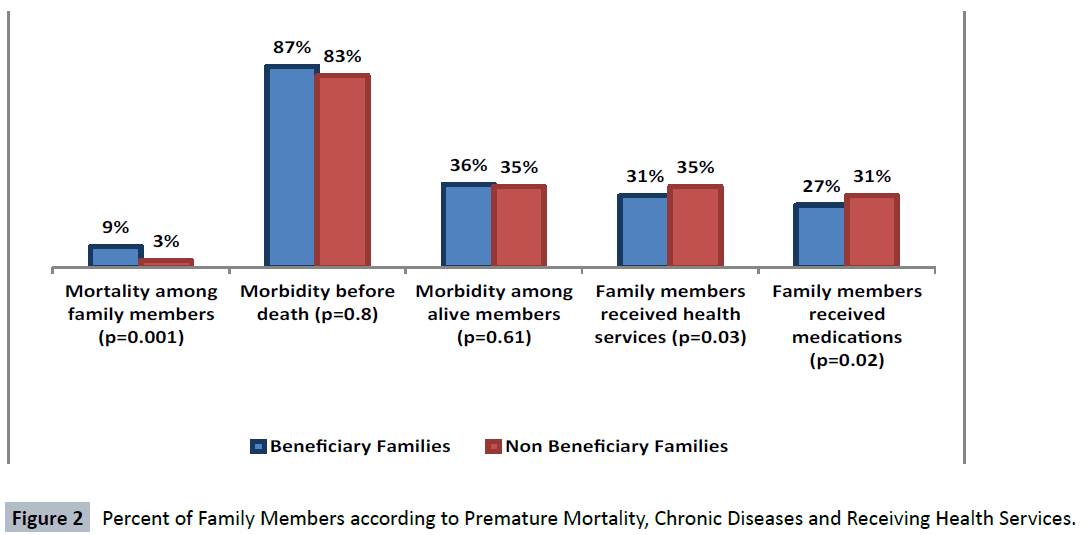
Figure 2: Percent of Family Members according to Premature Mortality, Chronic Diseases and Receiving Health Services.
In Table 2, the disease burden had been estimated for each family. The relatively high total years lost due to premature death among Beneficiary Families (3668.5 years) is attributed to high mortality rates. However, for the mean years lost per family member due to premature death, Non Beneficiary Families had higher value (70.6 years) than Beneficiary Families (42 years), because all Non Beneficiary Families deaths were under-five mortalities. Such situation is further confirmed by information on the duration of illness before death. For Non Beneficiary Families, under-five deaths usually suffer acute, rapidly fatal diseases, while those who pass the childhood period had suffered from chronic diseases with a mean duration of 6 years before death. The estimated morbidity duration of the currently alive family members was slightly higher among Beneficiary Families. However, the mean duration of illness for Beneficiary and Non Beneficiary Families was about 7 years/ family member. The total disease burden was higher among Beneficiary Families (7994.6 years, mean =7.9 years per family member) than Non Beneficiary Families (4999.9 years, mean 5.2 years /family member).
Household expenditure on health care
Table 3 illustrates the economic status of the studied families related to income and expenditure. Non Beneficiary Families far exceeded the Beneficiary Families regarding the income and expenditure on daily life and health. The gap is obvious for expenditure on health. The average monthly expenditure on the health / member in Non Beneficiary Families was 248%, more than for members in Beneficiary Families as estimated by the gap percent difference. Additionally, Non Beneficiary Families expenditure on health could reach to two thirds of the total monthly expenditure compared to Beneficiary Families who assign only one fifth of the total expenditure for health care.
Table 3: Income and Expenditure on Health of Beneficiary and Non Beneficiary Families.
| Income and Expenditure Items |
Beneficiary Families (n=927 Member) |
Non Beneficiary Families (n=933 Member) |
Gap % |
| Mean Income/Family Member/Month (USD) |
19 |
30 |
58% |
| Mean Expenditure/Family /Month (USD) |
111 |
160 |
44% |
| Mean Expenditure /Family Member/Month (USD) |
26 |
36 |
41% |
| Mean Expenditure on Health/Family /Month(USD) |
24 |
107 |
340% |
| Mean Expenditure on Health /Family Member/Month (USD) |
6 |
20 |
248% |
| % Proportion of expenditure on health to total family expenditure per month |
22% |
67% |
45% |
Discussion
Egypt is undergoing rapid socioeconomic changes that affect health of and social distribution to its citizens. One of the most increasingly worldwide popular poverty alleviation strategies is CT programs [1]. Searching the literature didn't reveal any evidence related to the impact of UCT programs on health of targeted families in Egypt. This study verbalized socioeconomic markers and disease burden at the family level to study the effect of UCT programs on the health status of poor families through comparing Beneficiary Families who receive the UCT and Non Beneficiary Families who don't receive UCT. In addition, the current study went beyond testing the existence of an association between socioeconomic markers and morbidity and mortality to simple quantitative measurement of this association as disease burden at family level. Disease burden is expressed as years lost due to morbidity and premature mortality. Understanding the pathways by which UCT programs could be operating can guide policy makers to tailor the most appropriate and cost-effective interventions [16].
In Egypt, most of the social protection programs had a long history of targeting inefficiencies, with the unfair distribution of benefits among the population and tendency to benefit the better-off more than the poor [1]. However, the CT programs under the administration of the ministry of social solidarity are well targeted and efficient but with the small scale and scope. The program primarily targets poor, marginalized sectors of the community as widows, orphans, divorced women, abandoned wives, other women with no male provider, and the elderly. In addition, the program targets families in which the husband is unable to work and families with no male provider capable of earning a labor income [1,3,4]. In the present study, the socioeconomic background of the Beneficiary Families goes in accordance with the eligibility criteria of the targeted families as the most important reasons for their registration in the CT program were divorce/separation, followed by husbands’ death and non- working status. Also, Beneficiary Families had significantly less educated husbands and wives than Non Beneficiary Families. The percents of the non working husband and working wives were significantly higher among Beneficiary Families. Regarding the per capita income after receiving the CT, the study results revealed that current mean per capita monthly income of Beneficiary Families is significantly less than that of the Non Beneficiary Families as well as the household expenditure on health. In other words, despite that the eligibility criteria of the transfer program are considered to be very efficient and assessed by means testing through household visits, but still per capita transfers are low to have any substantial effects on poverty levels and health status [3]. According to the world bank poverty lines in 2007, the average cash transfer value is equal to 7.8% of the ‘very poor’ poverty line and 5.5% of the ‘poor’ poverty line [4].
Ideally, CT programs are applied in Egypt as a short term social protection intervention to alleviate economic hardships on the poor sectors of the population [1,3,4]. Drawing on the successful international experience with CT, the outcomes were expected to be crosscutting to affect all aspects of lives of beneficiaries, including their health status as the Mchinji Social Cash Transfer in Malawi and the Oportunidades Program in Mexico [16,17]. However, our study findings revealed that families receiving the UCT had significantly higher estimated disease burden (expressed as years lost due to premature death and morbidity duration for deaths and currently alive family members) than their neighbors who didn't receive the UCT. Moreover, in spite of the high disease burden, Beneficiary Families had significantly less access to health service utilization and less expenditure on health care. One of the well known factors contributing to the failure of UCT to significantly influence the health status of the targeted families is the low per capita cash payment. In 2012/2013, Egypt cash transfers targeting the poor had hardly reached 0.2% of Gross Domestic Product (GDP). This was because of the increase in the number of beneficiary households with around 300 thousand, to cover a total of 1.4 million households. Despite the declared increase in the cash payments for USD 31/month, the calculated average based on the budget figures is about USD 22/month [4].
In addition, the under utilization of health services among Beneficiary Families in our study in the presence of high disease burden may be due to the absence of direct investment in human capital among recipients of UCT [18]. Human capital investments and sustainable human development could be achieved by CCT programs which provide direct cash transfers to families based on their fulfillment of certain requirements. These requirements are usually linked to receiving certain types of health services, nutritional assessment and compliance of children to education [9,18]. In Egypt, the current running CCT pilot program in Ain el Sira revealed positive results such as increasing the number of patients at the local health center in Ain el Sira [4]. Furthermore, in a relatively short time, the pilot program had a positive effect on women empowerment and their access to health and nutritional information [7]. Therefore, CCT deals with the problem of underinvestment in human capital not only by compensating individuals in the short-term poverty relief that has indirect effects on health, nutrition, and education through paying for the real costs, but also by obligating families to use services that have long-term payoffs in such areas [19]. In this context, the Egyptian Government in collaboration with the World Bank, is preparing the implementation of different forms of CCT programs as the Takaful and Karama Cash Transfer Schemes. These programs cover direct income support and their outcomes are anticipated to be crosscutting to comprise both short-term poverty relief and human capital investments by requiring investments in health and education especially for children. The first stage of implementation will cover 0.5 million eligible households in the poorest six governorates, gradually reaching 1.5 million poor households. The design of the program will incorporate both conditional and unconditional components, graduation strategy as well as conditionality tracking [1].
Finally, the current study set off the alarms regarding the health inequity that exists between families living in the same community and sharing the same ecological background. Moreover, it pushes to the forefront the concept that the: “unequal distribution of health-damaging experiences is not in any sense a ‘natural’ phenomenon, but is the result of a toxic combination of poor social policies and programs” [8]. Policy makers and program planners should adopt more empowering and effective strategies of reducing poverty over the long run through requiring investments in both health and education which will represent a new deal between the government and the citizen in terms of rights and responsibilities. Additionally, different types of cash payments should be considered as, for example, cash vouchers, cash for work and microfinance.
Conclusion
Families that were receiving UCT by Ministry of Social Solidarity have socioeconomic risks, higher disease burden and less opportunity to access health care services. UCT is not enough to ensure better health status of Beneficiary Families. Policy makers should encourage moving towards conditional forms of CT programs to include both short term poverty relief and investing in the human capital of poor families in the long run. In addition, the cash payments should be in line with costs of living to influence all aspects of beneficiaries' lives including their health.
7594
References
- Economic Ministerial Committee (2015) Egypt’s Five Year Macroeconomic Framework And Strategy, FY14/15 – FY18/19. Proceedings of the 2015 Egypt Economic Development Conference, Egypt.
- Government of Egypt (2015) Sustainable Development Strategy, Egypt vision 2030. Proceedings of the 2015 Egypt Economic Development Conference, Egypt.
- Loewe M (2000) Social Security In Egypt, An Analysis And Agenda For Policy Reform. Working paper 2024.
- Sieverding M, Selwaness I (2012) Social Protection in Egypt: A Policy Overview. Gender And Work In The Mena Region Working Paper Series, Number 23, Egypt.
- Marshall C, Hill PS (2015) Ten best resources on conditional cash transfers. Health Policy Plan 30: 742-746.
- Baird S, McIntosh C, Özler B (2011) Cash or Condition? Evidence from a Cash Transfer Experiment. Q J Econ 126: 1709-1753.
- Zaky HM (2014) Does the conditional cash transfer program empower women? Evidence from Ain El-Sira, Egypt. Social Sciences 3: 132-136.
- Commission of Social Determinants of Health (2008) Closing the gap in a generation: health equity through action on the social determinants of health. Final Report of the Commission on Social Determinants of Health, Geneva, World Health Organization, Geneva, Switzerland.
- Adato M, Bassett L (2008) What is the Potential Of Cash Transfers to Strengthen Families Affected by HIV and AIDs? A Review Of The Evidence on Impacts and Key Policy Debates. Joint Learning Initiative on Children and HIV/AIDS JLICA. Food Consumption and Nutrition Division, International Food Policy Research Institute, Washington, DC, United States.
- Lagarde M, Haines A, Palmer N (2009) The impact of conditional cash transfers on health outcomes and use of health services in low and middle income countries. Cochrane Database of Systematic Reviews, London, United Kingdom.
- Abou-Ali H (2007) Out-of Pocket Payments for Health care: the Case of Egypt, 1999-2005. Proceedings of the 2007 Institutions and Economic Development 14th Annual Conference, Cairo, Egypt.
- Central Agency for Public Mobilization and Statistics (CAPMAS) (2008) Egypt Statistical Year Book, 2008.
- Saleh DA, Yassin S, Sabry HA, Abde-Razic MS (2010) Priority families for health care according to family socio-demographic risks. J. Public Health Epidemiol 2: 138-146.
- Rafeh N, Williams J, Hassan N (2011) Egypt Household Health Expenditure and Utilization Survey 2010. Health Systems 20/20 project, Abt Associates Inc.
- Berman P (1996) National Health Accounts in Developing Countries: Appropriate Methods and Recent Applications. Harvard School of Public Health. Data for Decision Making Project. Ministry of Health and Population, Egypt.
- Fernald LC, Gertler PJ, Neufeld LM (2008) Role of cash in conditional cash transfer programmes for child health, growth, and development: an analysis of Mexico's Oportunidades. Lancet 371: 828-837.
- United Nations Children’s Fund (UNICEF) (2012) Integrated Social Protection Systems: Enhancing equity for children.
- Bassett L (2008) Can Conditional Cash Transfer Programs Play a Greater Role in Reducing Child Under nutrition? Social Protection Discussion Paper, no 0835. The World Bank.
- Medlin C, De Walque D (2008) Potential Applications of Conditional Cash Transfers for Prevention of Sexually Transmitted Infections and HIV in Sub-Saharan Africa. World Bank, Washington, DC, United States.

