Keywords
Service quality; Healthcare insurance; Gap analysis; SERVQUAL
Introduction
Healthcare system in Saudi Arabia is well established both in public and private sectors comprising two tiers i.e. primary and secondary care. Primary care has a network of health centers and clinics that provide preventive, prenatal, emergency, and basic services including mobile clinics for remote rural areas. The secondary care comprises hospitals and specialized treatment facilities located in urban areas [1]. In order to cater for healthcare needs in the Kingdom there are three key players i.e. Ministry of Health (MOH), other governmental organizations and the private sector organizations [2]. This system caters for a population of 30 million including 9.7 million expatriates [3]. Saudi Arabia has a largest and fastest growing population in the Gulf Cooperation Countries (GCC) which according to an overview by Colliers International Health (CIH) will reach 38.6 million, including 14.6 million non-Saudis, by 2020 [4].
Saudi Arabian government allocates huge annual budget for healthcare with substantial annual growth rate. Between 2006 and 2008 Saudi Arabia allocated approximately Saudi Arabian Riyals (SAR) 25.3 billion per annum with a cumulative amount of SAR 94 billion investment in the healthcare sector [4]. Table 1 provides statistics of extraordinary increase in health budget in 2009 which continued increasing steadily from 2009 to 2013.
Table 1: Annual allocation for health budget (SAR in billions).
| |
2008 |
2009 |
2010 |
2011 |
2012 |
2013 |
| Annual health budget |
30 |
52 |
61.2 |
68.7 |
86.5 |
100.00 |
| % of the total KSA budget |
6.3% |
11% |
12.2% |
11.8% |
11% |
11% |
Source: CIH, 2013
Figures in Table 1 are exclusive of cumulative allocation of SAR 368 billion between 2009 through 2013 - SAR 73.7 billion per annum compared to SAR 23.5 billion between 2005 through 2008 [4]. Saudi Government continues to invest in healthcare sector. Statistics show that it spending as % of Gross Domestic Product (GDP) was 3.7% in 2013, making it the second highest in the Gulf region [4]. However comparing to the western countries, Saudi’s spending as % of GDP stands substantially lower than the United States of America (USA) which is 17.9%, Germany 11.1% and United Kingdom (UK) 9.3% [4]. Despite high % of GDP spending in Gulf region Saudi Arabia has lowest number of beds, nurses and doctors per population within the GCC that needs further investment [4]. This has opened up doors for healthcare insurance following the footsteps of the GCC. Consequently demand for healthcare has shifted towards private sector [4] and we believe its success depends upon the quality of service.
Development of healthcare insurance in saudi arabia
Organized insurance industry in Saudi Arabia is almost a decade old. In 2004 Saudi Arabian Monetary Agency (SAMA) was assigned the responsibility to develop and organize insurance industry according to international standards. SAMA accordingly developed Cooperative Insurance Companies Control Law, Article one which made healthcare insurance mandatory through Cooperative Health Insurance Act dated 12 August 1999 [5]. However actual work on the Act started from 15 July 2006 and implemented in stages. In the first stage healthcare insurance scheme became mandatory for expatriate workforce employed by organizations having over 500 employees. This scheme has now been extended nationwide to all Saudi and non-Saudi employees working in the private sector and there are plans to expand it further by taking all citizens into the fold of healthcare insurance. History of insurance industry in Saudi Arabia is well documented in [6], our major focus in this research is to develop methods that measure service quality and provide guidelines for service managers to make informed decision and set priorities for continuous development of the care system. In this regard our first step is to understand the healthcare insurance in Saudi Arabia and its potential as presented in Table 2.
Table 2: GWP of total insurance.
| SAR in Million |
2010 |
2011 |
2012 |
2013 |
2.14 |
| SAR |
% Total |
SAR |
% Total |
SAR |
% Total |
SAR |
% Total |
SAR |
% Total |
| Protection and Savings |
972 |
6% |
905 |
5% |
889 |
4% |
845 |
3% |
904 |
3% |
| Health |
8,690 |
53% |
9,708 |
52% |
11,285 |
53% |
12,895 |
51% |
15,720 |
52% |
| General |
6,725 |
41% |
7,890 |
43% |
9,000 |
43% |
11,500 |
46% |
13,857 |
45% |
| Total |
16,387 |
100% |
18,504 |
100% |
21,174 |
100% |
25,239 |
100% |
30,482 |
100% |
Source: Saudi Insurance Market Report (SAMA, 2014 p.6)
Table 2 highlights the scale at which insurance industry in general and healthcare insurance in particular have increased tremendously over the past five years. Scope for healthcare is substantially wide as Gross Written Premiums (GWP) for healthcare insurance increased by 82% in 2014 over the base year of 2010. Compared to general insurance industry, share of healthcare insurance stood 50% of the total GWP from 2010 through 2014. According to the Council of Cooperative Health Insurance (CCHI) there are currently 27 health insurance companies (both national and multi-national) operating in Saudi Arabia [7]. This suggests a great potential for healthcare insurance industry in the Kingdom. This is why measuring service quality is imperative to assist managers and regulators to ensure service is according to the consumers’ expectations.
By looking at the history of healthcare insurance we can say that healthcare insurance in Saudi Arabia has firmly taken its roots and now the system has to be nurtured to reach its potential. In this respect our aim is to identify gaps in service delivery by highlighting specific areas of weaknesses and strengths so service managers can prioritize factors that are crucial in healthcare service delivery.
Literature Survey
Service quality can simply be defined as the extent to which service meets consumers’ expectations [8]. If expectations exceed the performance then perceived quality is less than satisfactory hence causing consumers’ dissatisfaction [8-10]. Accordingly quality has been defined as the degree of fit between consumers’ expectations and consumers’ perception of the service or product. Another view of quality is to enhance competitiveness, effectiveness and flexibility within the entire organization [11].
With reference to healthcare insurance this concept of quality becomes a pre-requisite to ensure consumers’ satisfaction both in terms of design of the service and conformity with the service delivery. Concentrating upon quality in terms of medical services a popular view is that “quality is a property that medical service can have in varying degrees” [12]. How this property is assessed is generally a matter of matching expectation with perception [9]. Another popular view about measuring healthcare insurance quality is identifying quantifiable factors or attributes to be measured such as behavior of medical staff [13]. We consider this is one of the several important factors while assessing or measuring the quality of healthcare service. Hence measuring the quality of healthcare insurance becomes vital while Saudi healthcare system is transforming from public to private sector.
In essence service quality measurement requires quantifiable factors or attributes and literature in this respect provides a list of general elements necessary for the quality of any product or service [14]. These elements include availability, guarantee, communication, expertise standard, behavior, flaw, duration, engagement, humanity, effects, reliability, responsibility and safety. Difficulty in service quality measurement stems from its nature of heterogeneity as oppose to the product which is homogeneous in nature and follows a pre-determined standard and design. Quality assurance process is generally based on two approaches; a) product / service oriented and b) consumer oriented [11]. Our focus here is consumer oriented to find methods that determine consumer’s satisfaction.
Another view from the literature emphasizes that quality has importance both for the deliverers and the recipients of the service and requires careful consideration in measuring quality [15]. The work presented in [15] provides robust analysis of quality measurement by comparing four methods i.e. SERVQUAL, Weighted SERVQUAL, SERVPERF and Weighted SERVPERF. Findings of this research suggest that SERVPERF method is superior to SERVQUAL. At the same time we acknowledge the concerns in the literature over the applicability of SERVQUAL across a wide variety of services [16-18]. Discussion on this criticism is beyond the scope of this study, we therefore refer to the work that presents findings from a follow-up study in which researchers refined SERVQUAL and replicated it in five different customer samples [19]. In this case researchers compared their findings with those of other researchers who had recently employed and evaluated SERVQUAL [19]. On the basis of insights from this comparative discussion the future directions for SERVQUAL research and applications was determined [19]. Accordingly the use of SERVQUAL became wide spread since the model developed in 1985 [9] and then further studies carried out in 1988 [20], 1991 [19], 1993 [21], 1994 [22] and (1990) [23] to establish its importance. Based on this we are convinced that SERVQUAL is appropriate for measuring quality of healthcare service and would be useful in case of Saudi Arabia.
Taking our discussion further we argue that there is consensus in the literature that quality management is basically to reduce gap between consumers’ expectations and perception of the service. In the literature there are seven major gaps in service quality concepts [9,24,25]. Of these seven gaps, two gaps are in consumer’s domain and 5 are in operation’s domain. In another study we find five gaps, of which one falls in customer’s domain and the rest fall in operation’s domain [11]. In this study we follow the gap model provided in [10]. Their model provides four possible gaps, of which two gaps are in operation’s domain and two gaps are in consumer’s domain. We have slightly modifies this model and incorporate fifth gap in consumer’s domain as shown in the following (Figure 1).
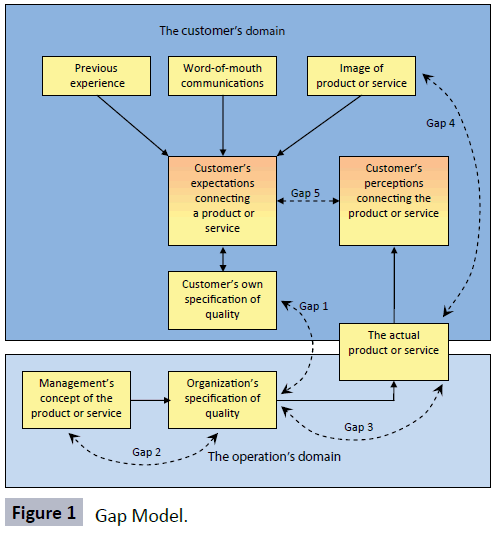
Figure 1: Gap Model.
Gap analysis model in Figure 1 is self explanatory and it is worth mentioning that all four gaps lead to the fifth gap that is the difference between consumer’s expectation of the service and the actual performance of the service. In this respect literature suggests that “the fifth gap is indeed the result of existence of gaps 1-4 such that the fifth gap decreases or eliminated with decreasing or eliminating each of the four gaps” [26]. Therefore it implies that the management of an organization can reduce the fifth gap by improving the quality of service or product. We have therefore concentrated upon the fifth gap in this study in order to determine gaps in five dimensions of the quality of healthcare service. In this respect we get further strength from another study which considers gap analysis model the most valuable contribution to services literature that helps identifying difference between consumers’ expectations and perception and paves way for SERVQUAL [27].
SERVQUAL
SERVQUAL model has been widely used in measuring service quality, the most prominent are measuring quality in hotels industry [11,28], in public services [29], in psychometric and diagnostic criteria [30] and in life insurance [31]. Further evidence of appropriateness of SERVQUAL application across the services industries is from [32-35]. In all studies the common approach has been to identify differences between consumers’ perception of quality and their expectation generally around five dimensions i.e. reliability, responsiveness, assurance, empathy, and tangibles. Within the five dimensions literature suggests around 22 statements to measure consumers’ expectations and the perception using seven point likert scale [36]. We have slightly modified the set of statement and reduced it into 20 statements for collecting primary data through questionnaires (Appendix I and II).
Statement of the problem
Success of transforming Saudi healthcare insurance system from public to independent private sector depends upon the quality of service acceptable to the public at large. Healthcare insurance is not a new concept. In the US, according to Northern California Neurosurgery Medical Group, accident related insurance history dates back to 1861 [37] which started transforming into employer-sponsored health insurance from the first half of the 20th century [38]. The history of developments in healthcare insurance industry of US is spread over centuries in reaching the present state. Compared to that healthcare insurance in Saudi Arabia, starting with limited coverage to expatriate workers in 2005, was extended to cover all Saudis working for private sector by 2008. The Saudi government is now planning to extend service nationwide. In our opinion this is a huge shift in service provision and it would not be without problems specifically in terms of quality of service for consumers. In this respect the purpose of this research is to examine the strength of the service quality being offered by the present insurance system and find answer whether industry is in a position to maintain the quality in view of huge demand it is going to experience.
Research Objectives
Our objective in this respect is to use SERVQUAL model and identify gaps in the quality of healthcare insurance in Saudi Arabia. Our plan is to conduct factor analysis and provide solution to resolve quality issues faced by the consumers of healthcare insurance.
Hypothesis
In line with above objectives this study is designed to determine gaps between expectation and perception of the service. According to [39] a comparison between expectation and actual realization is imperative to make survey meaningful. In this respect we propose the following five hypotheses in line with each dimension of the service.
H1: μ1 ≥ 0. There is no negative gap between perceived and expected reliability of the service.
H2: μ2 ≥ 0. There is no negative gap between perceived and expected responsiveness of the service
H3: μ3 ≥ 0. There is no negative gap between perceived and expected assurance of the service.
H4: μ4 ≥ 0. There is no negative gap between perceived and expected empathy of the service.
H5: μ5 ≥ 0. There is no negative gap between perceived and expected tangibility of the service.
Research Methodology
We examined literature concerning SERVQUAL framework and the healthcare environment of Saudi Arabia. The main idea was to establish; a) the quantum of health insurance sector of the Kingdom, and b) the relevance of applying gap analysis in measuring the quality of healthcare insurance in Saudi Arabia. After establishing research problem and determining the requirements of SERVQUAL framework we developed a questionnaire to collect primary data on consumers’ expectation and perception of the service across all the five dimensions. Data has been collected using reliable sources which ensured all respondents provide their responses.
The responses were taken on likert scale of 1 to 5 where 5 means highly agreed with the statement and 1 means highly disagreed with the statement [40] cited in [11]. In order to facilitate respondents the questionnaire was translated into Arabic. Data collected through questionnaire was compiled using SPSS software in order to interpret the quality and reliability of the data. We then carried out factor analysis and determined gaps in the service being provided and reached the conclusion related to our hypotheses.
Results
Demographic profile
Table 3 provides demographic profile of the respondents who by default are the users of the healthcare insurance in our study. The profile is based on six parameters as given in Table 3.
Table 3: Sample Profile.
| |
Nationality(1) |
Gender(2) |
Marital Status(3) |
Children(4) |
Qualification(5) |
Working(6) |
| |
Saudi |
Non-Saudi |
Male |
Female |
Married |
Un-Married |
With Children |
Without-Children |
Graduate+ |
Non-Degree |
Executive |
Non-Executive |
| Total |
138 |
262 |
294 |
105 |
344 |
56 |
325 |
74 |
191 |
208 |
197 |
202 |
| Percentage (%) |
34.5 |
65.5 |
73.7 |
26.3 |
86 |
14 |
81.3 |
18.5 |
47.8 |
52 |
49.3 |
50.5 |
Table 3 presents fairly mixed population of Saudis (34.5%) and non-Saudis (65.5%) working in the Kingdom. On the gender parameter our sample comprises 26.3% female which is quite encouraging given the Islamic culture of Saudi Arabia. Sample also depicts that 86% respondents were married and 81% of the respondents have children who truly reflect healthcare need. On qualification parameter 47.8% of the respondents are holding bachelor or higher degrees and likewise 49.3% of the respondents hold executive positions. In brief our sample is an excellent mix of ethnicity, gender, marital status, level of qualification and employment structure and we can say confidently that our sample is true representative of the users of healthcare insurance.
Reliability test
In order to ascertain reliability of the data we carried out KMO’s test and its result is shown in Table 4.
Table 4: KMO and Bartlett’s Test.
| Kaiser-Meyer-Olkin Measure of Sampling Adequacy. |
.957 |
| Bartlett's Test of Sphericity |
Approx. Chi-Square |
1.035E4 |
| df |
1035 |
| Sig. |
.000 |
The KMO’s test varies between 0 and 1. Higher values suggest that the factor analysis is relevant for the study. The reliability scale for all variables of this research is 0.957 which is marvelous and close to that of 0.92 reported by [20]. According to [41] cited in [31] “the high shared variance and relatively low uniqueness in variance are indicated by the KMO’s measure for sampling adequacy”. The KMO’s result in our case suggests that there is no error in 95.7% of the sample and in the remaining 4.3% there may be some sort of error [20]. Bartlett’s test on the other hand confirms that there are correlations in the data set and that factor analysis is appropriate for this data. The value of Chi- Square (1.035E4 with significance level 0.000) means there is no uniqueness in the data and factors affecting the service quality are significantly different.
With reference to gap analysis between expectation and perception we further narrowed down our analysis and worked out Cronbach’s alpha for each dimension of the perception and expectation to judge the appropriateness of factor analysis. Table 5 therefore presents Cronbach’s alpha for perception of the service and explained thereafter.
Table 5: Reliability test for perception.
| Dimension |
Cronbach’ alpha for dimension |
Cronbach’ alpha if item deleted |
Item |
| Reliability |
0.753 |
0.751 |
P1 |
| |
|
0.672 |
P2 |
| |
|
0.685 |
P3 |
| |
|
0.720 |
P4 |
| |
|
0.710 |
P5 |
| Responsiveness |
0.743 |
0.721 |
P6 |
| |
|
0.656 |
P7 |
| |
|
0.691 |
P8 |
| |
|
0.672 |
P9 |
| Assurance |
0.803 |
0.716 |
P10 |
| |
|
0.723 |
P11 |
| |
|
0.768 |
P12 |
| |
|
0.788 |
P13 |
| Empathy |
0.722 |
0.599 |
P14 |
| |
|
0.472 |
P15 |
| |
|
0.557 |
P16 |
| Tangibles |
0.759 |
0.749 |
P17 |
| |
|
0.672 |
P18 |
| |
|
0.672 |
P19 |
| |
|
0.719 |
P20 |
Table 5 presents reliability scale for all five dimensions and also the reliability scale for each dimension if each item in the dimension is deleted. This analysis as per [33] helps establishing whether deleted item is genuine or not. Accordingly if Cronbach’s alpha increases if the item is deleted it means the item is not genuine. Table 5 shows that Cronbach’s alpha for each dimension decreases when any of its items is deleted. This establishes that all items are genuine and true measure of that dimension. In line with above analysis the following Table 6 presents reliability analysis for consumers’ expectation of the service.
Table 6: Reliability test for expectation.
| Dimension |
Cronbach’s alpha for dimension |
Cronbach’s alpha if item deleted |
Item |
| Reliability |
0.782 |
0.696 |
E1 |
| |
|
0.752 |
E2 |
| |
|
0.722 |
E3 |
| |
|
0.767 |
E4 |
| |
|
0.755 |
E5 |
| Responsiveness |
0.695 |
0.640 |
E6 |
| |
|
0.650 |
E7 |
| |
|
0.606 |
E8 |
| |
|
0.625 |
E9 |
| Assurance |
0.481 |
0.381 |
E10 |
| |
|
0.388 |
E11 |
| |
|
0.368 |
E12 |
| |
|
0.647 |
E13 |
| Empathy |
0.644 |
0.512 |
E14 |
| |
|
0.634 |
E15 |
| |
|
0.490 |
E16 |
| Tangibles |
0.661 |
0.655 |
E17 |
| |
|
0.574 |
E18 |
| |
|
0.570 |
E19 |
| |
|
0.570 |
E20 |
We can see from Table 6 that each dimension’s Cronbach’s alpha decreases when any of its items is deleted, except E13 where Cronbach’s alpha increases substantially from 0.481 to 0.647 if E13 is deleted. This means E13 is not a genuine item and can therefore be eliminate from the factor analysis. From Tables 5 and 6 we see all dimensions have shown reasonably high reliability coefficients meaning that these dimensions are true measure of service quality and suitable for factor analysis.
Factor analysis
Factor Analysis technique is generally used for data reduction where underlying factors explain the inter-relationship or correlation among observed variables [42]. Why we have used factor analysis in this research is best answered in [34] which describe that “SERVQUAL generally using likert scale is a methodology of ranking where statistical tools such as mean or SD (Standard Deviation) do not express any meaningful results”. This critic on statistical tools is quite valid and strongly recommends the use of factor analysis that converts expectation and perception scores into newly weighted scores.
Substantial discussion is available in the literature on the forms of factor analysis to be applied according to research objectives [32,34,35,43]. We have followed [43] recommendations to apply Principal Component Analysis (PCA) with Varimax rotation as it has the potential of revealing the underlying structure of the latent variables through appropriate rotation method [32,44]. Factor loading for each dimension’s expectation is given in Tables 7.
Table 7: Item wise factor loading for each dimension of expectation.
| Dimensions and factor components |
Component 1 |
Component2 |
Component 3 |
Component 4 |
Component 5 |
| E1 |
.832 |
|
|
|
|
| E3 |
.776 |
|
|
|
|
| E2 |
.701 |
|
|
|
|
| E5 |
.686 |
|
|
|
|
| E4 |
.650 |
|
|
|
|
| E8 |
|
.750 |
|
|
|
| E9 |
|
.737 |
|
|
|
| E6 |
|
.562 |
|
|
|
| E7 |
|
.542 |
|
|
|
| E12 |
|
|
.759 |
|
|
| E10 |
|
|
.728 |
|
|
| E11 |
|
|
.725 |
|
|
| E13 |
|
|
.553 |
|
|
| E16 |
|
|
|
.802 |
|
| E15 |
|
|
|
.791 |
|
| E14 |
|
|
|
.701 |
|
| E20 |
|
|
|
|
.745 |
| E18 |
|
|
|
|
.741 |
| E19 |
|
|
|
|
.731 |
| E17 |
|
|
|
|
.592 |
| Eigenvalues |
2.680 |
2.092 |
1.936 |
1.761 |
1.990 |
| % of variance |
53.603 |
52.291 |
48.401 |
58.701 |
49.761 |
The KMO’s test for each dimension is given in Table 8.
Table 8: KMO’s Test for each expectation dimension.
| Reliability |
.807 |
| Responsiveness |
.660 |
| Assurance |
.710 |
| Empathy |
.630 |
| Tangibles |
.679 |
According to Table 8 substantially high values of KMO’s test justifies the relevance of using factor analysis. Likewise factors have been extracted for each dimension of perception and given in Table 9.
Table 9: Item wise factor loading for each dimension of perception.
| Dimensions and factor components |
Component 1 |
Component2 |
Component 3 |
Component 4 |
Component 5 |
| P2 |
.800 |
|
|
|
|
| P3 |
.770 |
|
|
|
|
| P5 |
.702 |
|
|
|
|
| P4 |
.690 |
|
|
|
|
| P1 |
.575 |
|
|
|
|
| P7 |
|
.802 |
|
|
|
| P9 |
|
.782 |
|
|
|
| P8 |
|
.739 |
|
|
|
| P6 |
|
.693 |
|
|
|
| P10 |
|
|
.877 |
|
|
| P11 |
|
|
.829 |
|
|
| P12 |
|
|
.777 |
|
|
| P13 |
|
|
.727 |
|
|
| P16 |
|
|
|
.852 |
|
| P14 |
|
|
|
.836 |
|
| P15 |
|
|
|
.727 |
|
| P20 |
|
|
|
|
.823 |
| P18 |
|
|
|
|
.814 |
| P19 |
|
|
|
|
.732 |
| P17 |
|
|
|
|
.677 |
| Eigenvalues |
2.532 |
2.279 |
2.589 |
1.953 |
2.335 |
| % of variance |
50.49 |
56.982 |
64.735 |
65.107 |
58.636 |
KMO’s test for perception, as shown in Table 10, is substantially high and justifies the relevance of factor analysis for this study.
Table 10: IKMO’s Test for each dimension of perception.
| Reliability |
.778 |
| Responsiveness |
.740 |
| Assurance |
.778 |
| Empathy |
.652 |
| Tangibles |
.720 |
Factor loading of all items in Tables 7 and 9 are greater than 0.5 meaning all items of the questionnaire are properly loaded. Eigen values of all components are higher than 1 proving the significance of the factors extracted. Factor analysis further leads us towards investigation whether any negative gap exists between perception and expectation of the service delivered through healthcare insurance in Saudi Arabia.
Gap analysis
Gap analysis (Perception - Expectation) has been carried out based on weighting from the factor analysis to determine satisfaction level of the consumers for all five dimensions and presented in Table 11.
Table 11: Summary of perception and expectations gap scores.
| Descriptive Statistics |
| |
N |
Minimum |
Maximum |
Mean |
Std. Deviation |
Variance |
Skewness |
Kurtosis |
| Statistic |
Statistic |
Statistic |
Statistic |
Statistic |
Statistic |
Statistic |
Std. Error |
Statistic |
Std. Error |
| Gap1 |
400 |
-1.80 |
3.80 |
-.0335 |
.63937 |
.409 |
1.149 |
.122 |
6.252 |
.243 |
| Gap2 |
400 |
-2.25 |
2.75 |
.0362 |
.57729 |
.333 |
.286 |
.122 |
2.140 |
.243 |
| Gap3 |
400 |
-1.75 |
3.75 |
.0204 |
.59513 |
.354 |
.619 |
.122 |
4.546 |
.243 |
| Gap4 |
400 |
-2.33 |
2.33 |
.0250 |
.63275 |
.400 |
.011 |
.122 |
1.227 |
.243 |
| Gap5 |
400 |
-1.50 |
2.50 |
.0794 |
.60240 |
.363 |
.633 |
.122 |
1.141 |
.243 |
| Valid N (listwise) |
400 |
|
|
|
|
|
|
|
|
|
Table 11 shows that generally there is a significant level of satisfaction among consumers of healthcare insurance except in case of Reliability (G1) dimension where respondents have expressed their dissatisfaction quite moderately (-0.0335). Gaps on all other dimensions i.e. Responsiveness (G2), Assurance (G3), Empathy (G4), and Tangibles (G5) show a moderate level of satisfaction. We further explain gaps in each dimension with reference to the proposed hypotheses.
Statistical description of gaps in dimensions and
explanation of results
Reliability (G1)
Our analysis shows that regarding reliability dimension consumers have expressed their dissatisfaction with a mean score of G1 = -0.0335 (Table 11). SD is 0.63937 which suggests that gap is not significantly scattered away from the mean however this matter of dissatisfaction needs to be addressed. With reference to Reliability dimension skewness of 1.149 suggests that the tail is positively long along right indicating majority data is concentrated towards left.
Kurtosis score of 6.252 suggests gap is clustered around the mean. It is to remind that for a normal distribution higher score of Kurtosis means tall shape of the distribution and gap is normally spread around the mean. Having observed that negative gap exists in reliability dimension we therefore reject the hypothesis H1: μ1 ≥ 0 and accept the alternate hypothesis that consumers are dissatisfied with the service reliability.
Responsiveness (G2)
It appears from the mean score of G2 = 0.0362 that respondents are generally satisfied with the responsiveness level of service. The SD of 0.57729 indicates gap is closely spread around the mean. Positive skewness of 0.286 suggests the tail is slightly long towards right however the spread is very close to mean. Kurtosis of 2.14 indicates relatively flat shape of the distribution however the gap is spread around the mean with moderate level of satisfaction. Accordingly we accept the hypothesis H2: μ2 ≥ 0 that there is no negative gap in service responsiveness thus resulting consumers’ satisfaction.
Assurance (G3)
The mean value of G3 = 0.204 which confirms that respondents are satisfied with the assurance level of service being provided. SD of 0.59513 indicates gap is closely spread around the mean. Likewise positive skewness of 0.619 suggests tail is long towards right and Kurtosis of 4.545 suggests that distribution is very close to that of normal distribution and gap is spread around the mean. We therefore accept the hypothesis H3: μ3 ≥ 0 and conclude that negative gap does not exist and consumers are satisfied with assurance dimension of the service.
Empathy (G4)
The mean value of G4 = 0.0250 is confirmation that consumers are satisfied with the empathy level of service. SD of 0.63275 indicates gap is closely spread around the mean. Skewness of 0.011 suggests quite normal distribution however Kurtosis of 1.227 suggests slightly flatter distribution compared to G1, G2, and G3 nevertheless gap does not scatter very much away from the mean. In this case we accept the hypothesis H4: μ4 ≥ 0 and agree that there is no negative gap with reference to the service empathy.
Tangibles (G5)
We can say that the positive mean value of G5 = 0.0794 suggests consumers’ satisfaction with the tangibility of the service being provided. Positive value of skewness (0.633) suggests that tail is long towards right and Kurtosis value of 1.141 indicates relatively flatter distribution. In line with G2, G3, G4 we conclude that there is no negative gap in service tangibility therefore hypothesis H5: μ5 ≥ 0 is accepted.
Overall perceived service quality
Our statistical analysis confirms the relevance and robustness of factor analysis for this study in order to determine the level of satisfaction with the healthcare insurance service. Healthcare service is multi-dimensional and in this study we concentrated upon five dimensions of service which proved to be satisfactory except that of Reliability (G1). Statistics regarding overall quality of the service is provided in Table 12.
Table 12: Descriptive statistics for overall service quality.
| |
N |
Minimum |
Maximum |
Mean |
Std. Deviation |
Variance |
Skewness |
Kurtosis |
| Statistic |
Statistic |
Statistic |
Statistic |
Statistic |
Statistic |
Statistic |
Std. Error |
Statistic |
Std. Error |
| Overall SQ |
400 |
-1.926 |
3.026 |
0.026 |
0.609 |
0.371 |
0.287 |
0.122 |
3.061 |
0.243 |
| Valid N (listwise) |
400 |
|
|
|
|
|
|
|
|
|
Descriptive statistics of overall service quality from Table 12 show positive mean value of 0.026 of all gaps, suggesting significant level of satisfaction with the overall perceived service quality. Standard Deviation of 0.609 is quite moderate and similarly skewness of 0.287 shows distribution is slightly long towards right nevertheless Kurtosis of 3.061 indicates that the distribution is close to that of normal distribution and gaps are spread around the mean. Hence we conclude that overall service quality is promising. Nevertheless we argue that healthcare service quality is dynamic and requires continuous monitoring for all dimensions on the lines those of TQM (Total Quality Management) for continuous improvements.
Discussion
SERVQUAL framework has been applied which is widely used across the globe to measure various services’ qualities. In global context SERVQUAL has been applied in number of different situations for example in India quality of life insurance was studied and it concluded that across all six dimensions there exists quality gap [31]. A study of hotel industry in Croatia showed that managers were not aware of consumers’ expectation hence SERVQUAL helped identifying gaps and focusing quality issues [11]. In Bangladesh SERVQUAL application suggested that the quality of five star hotels is moderate [28]. Turkey example of Airline services provides conclusion that none of the passengers’ perception responded to their expectations in any of the dimensions [34]. USA example of measuring service quality in private banking compares two quality measures i.e. SERVQUAL and Technical/Functional Quality and concludes that both the models may be unequally or asymmetrically applicable across different setting and situations [45]. Another interesting study looking into application of SERVQUAL scale over the past 20-years provides a summary of 30 applications that establishes usefulness of the approach across the globe in various industries whether it is related to service or product quality [46].
Compared to above studies results our research provides similar findings and proves that out of five dimensions of the service quality four dimensions have shown consumers’ satisfaction while ‘reliability’ dimension of the service registered negative gap - meaning consumers are dissatisfied with the reliability of the service. Within the quality context reliability of the service acts as linchpin for the entire service structure and negative gap in this respect is quite detrimental to the service set up. One way of improving the service quality is to analyze factor loading in order to identify areas responsible for variance in the data. For example from Table 9 we see E1 (expectation) has the highest factor loading of 0.832 means variance in the data is due to the service to be ‘provided as promised’. Similarly factor loading of 0.802 for E16 (consumers’ best interest at heart) places high value on service providers behavior. Hence by looking at factor to factor loadings services managers can keep all those factors under scrutiny where variance is significantly high.
Further analysis of gap statistics at dimensional level also indicates room for improvements and setting priorities. For example negative gap in ‘reliability’ requires immediate attention, then comes ‘assurance’ with lowest positive gap of 0.0204, then ‘empathy’ with positive gap of 0.0250 and finally ‘tangibles’ with positive gap of 0.0794, all showing moderate satisfaction enabling managers to set targets for further improvements. By looking at factors loading and gap statistics we can say this study provides a robust mechanism of setting priorities to make service quality acceptable, responsive and customized. In brief SERVQUAL has ability to resolve quality issues rationally nevertheless there are certain areas of limitations of this study.
A major limitation is that the study has been performed only in Jeddah and Rabigh region where sample was drawn from a limited number of companies (employers) providing healthcare insurance. Although the sample size of 400 provides a good ground for analysis nevertheless there is scope for extending this research further encompassing larger geographical areas throughout the country.
Conclusion and Recommendations
We have tested the quality of healthcare across five dimensions of the service. Our results show quite moderate level of satisfaction in four dimensions of the service quality, except reliability which is vital element of the entire service structure. Without recipients’ confidence in reliability it would be difficult to say that Saudi healthcare insurance industry is in a position to maintain the quality especially while it is going to experience huge demand due to shift in the government’s policy. To resolve such issues this study indicates several areas where managers of services must closely scrutinize factors influencing the quality. By looking at health facilities in the area of study we can say results are true reflection of the situation. We have shown there are huge capital investments involved in healthcare infrastructure in the Kingdom nevertheless output from the services falls short of the required results. Similar situation is reflected in another study [13] with reference to quality of care in Saudi government’s health facilities. Our approach is unique as we have concentrated on SERVQUAL that has revealed specific weakness in the system. We can therefore say confidently that SERVQUAL is an appropriate tool for assessing the service quality and identifying weaknesses.
As we mentioned already that this research concentrates on one region therefore care may be taken in interpreting the results. For more comprehensive results we recommend this research to be extended countrywide so that the quality of healthcare service through insurance is determined on regional basis in order to ensure there are no geographical, ethnic or demographic disparities in the service provision.
We also recommend that CCHI to put in place a plan to educate service providers according to changing requirements of various consumers groups so that the service delivered is as acceptable, effective, customized and responsive as Saudi public and Saudi government desires.
Acknowledgement
We are grateful to King Abdulaziz University, Deanship of Scientific Research for their continuous support and guidance in conducting this research. Without their help this enormous task would not have been accomplished.
We are grateful to Dr. Ahmad Jamal, Senior Lecturer in Marketing of Cardiff Business School, Cardiff University, UK for his invaluable guidance completing this research and contribution in conducting factor analysis. Finally we are grateful to Dr. Khalid Alshuaibi, Dean of College of Business, Rabigh for his continued support in this research.
8266
References
- Helen Ziegler and Associates (2014) “The healthcare system of Saudi Arabia”.
- Almalki M1, Fitzgerald G, Clark M (2011) Health care system in Saudi Arabia: an overview. East Mediterr Health J 17: 784- 793.
- MOH (2013) “Health Statistical Year Book. Ministry of Health”. Riyadh, Government of Saudi Arabia.
- SAMA (2005) “Cooperative Insurance Companies Control Law, Article one”.
- Saaty AS, Ansari ZA (2012) “Insurance Principles and Practices with Reference to Saudi Arabia”. Lambert Academic Publishing, Norderstedt, Germany: 143-172.
- Lewis BR, Mitchell VW (1990). “Defining and measuring the quality of customer service”. MIP 8: 11-17.
- Parasuraman A, Zeithaml VA, Berry LL (1985) “A conceptual model of service quality and its implication”. J Mark, 49: 41-50.
- Slack N, Chambers S, Johnston R. (2010) “Operations Management”. 6eds Prentice Hall, England, United Kingdom.
- GrÃ
¾ini? J (2007) “CONCEPTS OF SERVICE QUALITY MEASUREMENT IN HOTEL INDUSTRY”. EKON MISAO PRAKASA DBK, GOD XVI, 1: 81-98.
- Donabedian A (1988) Quality assessment and assurance: unity of purpose, diversity of means. Inquiry 25: 173-192.
- Saaty AS, Ansari ZA (2014) “Measuring satisfaction of patients from service quality of government hospitals in Saudi Arabia”. KAU Research Project No. 1433/849/91.
- Avelini HI (2002) “Upravljanjekvalitetom, Fakultet za turisti?ki I hotelskiindustriji”(Quality management in tourism and hotel industry). Faculty of Tourism and Hospitality Management, Opatija: 12-13.
- McAlexander JH, Kaldenberg DO, Koenig HF (1994) “Service Quality Measurement: Examination of dental practice sheds more light on the relationships between service quality, satisfaction, and purchase intensions in health care setting”. J Healthc Mark 14: 34-40.
- Carman J (1990) “Consumer Perceptions of Service Quality: An Assessment of the SERVQUAL Dimensions”. J Retailing 66: 33-55.
- Cronin JJ, Taylor SA (1992) “Measuring Service Quality: A Reexamination and Extension”. J Marketing 56: 55-68.
- Babakus E, Boller G (1992) “An Empirical Assessment of the SERVQUAL Scale”. J Bus Res 24: 253-268.
- Parasuraman A, Berry LL, Zeithaml VA (1991) “Refinement and Reassessment of the SERVQUAL Scale”. J Retailing, 67: 420-450.
- Parasuraman A, Zeithaml VA, Berry LL (1988) “SERVQUAL: A Multiple-Item Scale for Measuring Consumer Perceptions of Service Quality”. J Retailing 64: 12-40.
- Parasuraman A, Zeithaml VA, Berry LL (1993) “Research Note: more on improving service quality measurement”, J Retailing 69: 140-147.
- Parasuraman A, Zeithaml VA, Berry LL (1994) “Reassessment of expectations as a comparison standard in measuring service quality: implication for future research”. J Marketing 58: 111-124.
- Zeithaml VA, Parasuraman A, Berry LL (1990) “Delivering quality service: Balancing customer perceptions and expectations”. The Free Press, New York, United States.
- Curry A (1999) “Innovation in public service management”. Managing Service Quality 9: 180-190.
- Luke ShTK, Layton R (2002) “Perception Gaps in customer expectations: Managers versus services providers and customers”. ServInd J 22: 109-128.
- Sadeghi T, Bemani A (2011) “Assessing the Quality of Bank Services by Using the Gap Analysis Model”. Asian J Bus Manage Stud 2: 14-23.
- Brown SW, Bond EUIII (1995) “The internal/external framework and service quality: Towards theory in services marketing”. J Marketing Manag: 25-39.
- Siddique MN, Akhtar M, Masum A (2013) “Service Quality of Five Star Hotels in Bangladesh: An Empirical Assessment”. Asian Bus Rev. 2: 67-72.
- Brysland A, Curry A (2001) “Service improvements in public services using SERVQUAL”. Managing Services Quality 11: 389-401.
- Parasuraman A, Zeithaml VA, Berry LL (1994) “Alternative Scales for Measuring Quality: A Comparative Assessment Based on Psychometric and Diagnostic Criteria”. J Retailing 7: 201-230.
- Choudhuri PS (2014) “Service quality gap between expectation and perception of the customers of Life Insurance Corporation of India in Burdwan”. Herald Journal of Marketing and Business Management 3: 001-009.
- Nimako S, Azumah FK, Donkor F, Abu-Barobbey V (2012) “Confirmatory factor analysis for service quality dimensions within mobile telephony industry in Ghana”. EJISE 15: 197-215.
- Daniel CN, Berinyuy LP (2010) “Using SERVQUAL Model to Assess Service Quality and Customer Satisfaction: An Empirical study of grocery stores in Umeå”. Master Thesis, Umeå School of Business, Sweden.
- Pakdil F, Aydin Ö (2007) “Expectations and perceptions in Airline services: An analysis using weighted SERVQUAL scores”. J Air TranspManag13: 229-237.
- Babakus E, Mangold WG (1992) Adapting the SERVQUAL scale to hospital services: an empirical investigation. Health Serv Res 26: 767-786.
- Gabbie O, O’neill MA (1996) “SERVQUAL and the northern Ireland hotel sector: A comparative analysis – Part 1”. Managing Service Quality 6: 25-32.
- Northern California Neurosurgery Medical Group (2007), “The History of Health Insurance In The United States” California.
- Jost TS (2014) “Health Insurance in the United States, History of”. Encyclopedia of Health Economics 1: 388-395
- Shahin A (2006) “SERVQUAL and model of service quality gaps: A framework for determining and prioritizing critical factors in delivering quality services”. In: Service quality – An introduction. ParthaSarathy V. (Ed.) Andhra Pradesh: ICFAI University Press 117-131.
- Markovi? S (2005) “Kvantitativanapimjena SERVQUAL modela u hotelskojindustriji” Tourism and hospitality management11: 179-191
- Kaiser HF, Cerny BA (1979) “Factor analysis of the image correlation matrix”. EducPsycholMeas39: 711-714.
- Chatfield C, Collins, AJ (1992) “Introduction to Multi-Variate Analysis”. Chapman and Hall, London.
- Costello AB, Osborne JW (2005) “Exploratory Factor Analysis”. Practical Assessment Research & Evaluation 10: 72
- Ishfaq M (1993) “Decentralized Resource Allocation in Primary Health Care: Formal Methods and their Application in Britain and Pakistan”. PhD Thesis, LSE, University of London, United Kingdom.
- Lassar WM, Manolic C, Winsor RD (2000) “Service quality perspectives and satisfaction in private banking”. J Ser Marketing 14: 244-271.
- Ladhari R (2009) "A review of twenty years of SERVQUAL research", Int JQualServSci 1: 172-198

