Keywords
Caffeine; Camellia sinensis; Method development; Validation; RP-HPLC
Introduction
Green tea (Camellia sinensis) is a popular herbal plant having multiple beneficial health applications in humans. Owing to the emerging antibiotic resistance, nowadays researchers are searching for alternatives of antibiotics to be used for safeguarding human health, efficiently acting against the pathogenic microorganisms, enhancing immunity and as growth promoters and improving efficacy in humans. Tea is the second most-consumed beverage throughout the world [1]. Green tea (Camellia sinensis), a type of tea, is used as an antioxidant with abundant health benefits and also considered as one of the most well-known beverages in the world, mostly due to its prospective health welfares [2-4] (Figure 1).

Figure 1: Graphical abstract of HPLC chromatogram.
Tea leaf contains carbohydrates, which add to the sweetness of tea. Polyphenols referred as flavonoidal compounds such as the alkaloid caffeine and two similar compounds theobromine and theophylline, which gives the bitterness of tea. The other active constituents present are tannins which are responsible for the health claims of tea. The major flavanols in tea are catechin, epicatechin, epicatechin gallate, gallocatechin, epigallocatechin, and epigallocatechin gallate. The amino acid L-theanine found in tea [5]. Over the last 40 years, the qualitative and quantitative analyses of high volatile compounds were determined by GC and GC/MS. The main components responsible for aroma of green tea were revealed, and the low volatile compounds basically were determined by HPLC and LC/MS methods. Most studies focusing on the determination of catechins and caffeine in various teas involved HPLC analysis.
Leaves of green tea contain antioxidative catechins. Tea catechins have many health benefits such as anti-inflammatory, antiarthritic, anticarcinogenic, anti-cancerous, antimutagenic, antibacterial, antiviral, antifungal, anticoccidial, antiprotozoal, antiparasitic, anti-infective, hypocholesterolemic, resistant to capillary blood congestion and hypolipidemic effects [6-17].
Reversed-phase high-performance liquid chromatography (RPHPLC) involves the separation of molecules on the basis of hydrophobicity. Extensive literature survey revealed that few methods were reported for the estimation of caffeine by RPHPLC. Hence, an attempt has been made to rapid development and validates a new, simple, accurate, precise, and economically feasible RP-HPLC method for the quantification of caffeine in Camellia sinensis [18-26] (Figure 2).

Figure 2: Chemical structure of caffeine.
Materials and Methods
Tea leaf granules were procured from departmental stores, Tirupati, Chittoor Andhra Pradesh India. Caffeine Standard was obtained from Sigma Aldrich. Reagents and solvents were analytical grade and HPLC grade procured from S.D. Fine Chem Pvt Ltd.
Instrumentation and chromatographic conditions
Instrument: HPLC was performed on an Analytical Technology system equipped with a quaternary low-pressure gradient solvent delivery P3000A HPLC pump.
Sonicator: Model: 1.5L 50 degasser units.
Detector: A high-sensitivity UV 3000 ultraviolet (UV) detector.
Software: The system controlled and data analyzed by HPLC workstation software.
Column: A separation was carried out in C18 Chromatopak (250 mm × 4.6 × 5 micron).
Mobile phase: The mobile phase consists of isocratic elution with a low-pressure gradient using double-distilled HPLC grade Water: HPLC grade acetonitrile (A:B): (60:40)
Flow rate: Flow rate of 1.0 ml/min and the injection volume of 20 μl.
Degassing: All solutions were degassed and filtered through 0.2 μm pore size filter.
Column Temperature: The column was maintained at 40°C throughout analysis.
Detector (nm): UV detector was set at 273 nm.
Run time: The total LC run time was 30 min.
Before choosing the chromatographic condition, a number of trials were carried out with different ratios of solvents, flow rate, and temperatures to check the retention time (RT), peak shape, tailing factor (peak symmetry), and theoretical plates of the analyte. In addition, the system suitability parameters such as tailing factor (T) and theoretical plates (N) are calculated to the caffeine standard solution (25 ppm) (Table 1).
Table 1 Chromatographic trial.
| Trials |
Results |
| Trial 1 |
Was performed on LC, Chromotopak C18 (100 mm × 4.6 mm i.d; 3.5 µm particle size) column using mobile phase of water: Acetonitrile in the ratio of 60:40v/v at U.V detection at 273 nm. |
| |
A Broad peak appeared so this was not satisfactory. |
| Trial 2 |
Was performed on LC, Chromotopak C18 (100 mm × 4.6 mm i.d; 3.5 µm particle size) column using mobile phase of water: Acetonitrile: in the ratio of 60:40 v/v at U.V detection at 273 nm. |
| |
Fronting peaks and some extra peaks appeared so this was not satisfactory. |
| Trial 3 |
Mobile phase of Water : Acetonitrile 60:40 v/v at U.V detectection at 273 nm |
| |
A sharp peak with a retention time of 1.275. |
| |
The trail 3 was selected for the further work in HPLC as the result was satisfactory with a sharp peak with the retention time of 1.275 min |
Isolation of caffeine from tea
About 200 g of tea powder was weighed accurately, transferred into a 1000 ml beaker; 800 ml of water was added heated for half an hour. The hot decoction was filtered using tea filter the filtrate was transferred into a separating funnel. The decoction was extracted with 30 ml of chloroform consecutively for three times, all the extracts were mixed together. The extract was filtered (Watt Mann No 1 filter paper) with charcoal, the filtered extract was concentrated up to 20 ml on a water bath for half an hour and 10 ml chloroform was added to the extract until the caffeine crystals were formed the yield obtained was around 0.28 g.
Identification test for caffeine (Murexide test)
The (solid caffeine crystals) sample was first treated with conc. nitric acid, which was slowly evaporated to dryness with subsequent addition of ammonia solution (NH4OH) a purple color was obtained with addition of Murexide (ammonium purpurate) (Figures 3 and 4).
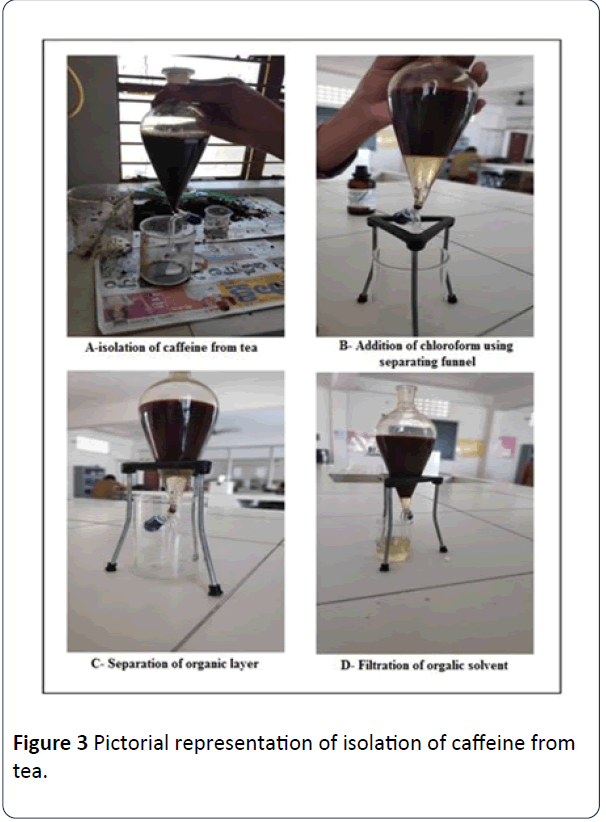
Figure 3: Pictorial representation of isolation of caffeine from tea.
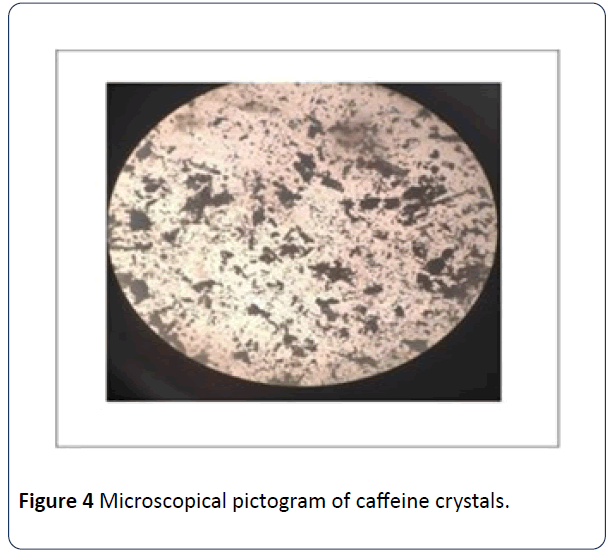
Figure 4: Microscopical pictogram of caffeine crystals.
Preparation of standard solution (25 ppm)
50 mg of caffeine was weighed accurately into a 100 ml volumetric flask dissolved and diluted to the volume with mobile phase. Further 5 ml of the above solution was diluted to 100 ml with mobile phase.
Preparation of sample solution
50 mg of caffeine (sample) was weighed accurately into a 100 ml volumetric flask dissolved and diluted to the volume with mobile phase. Further 5 ml of the above solution was diluted to 100 ml with mobile phase.
Preparation of spiked sample solution
The accuracy for the method was determined by spiking the blank samples at standard concentrations (10, 50 and 100 ppm) and analyzing their recoveries.
Validation of the method
The validation of the developed analytical method was done according to the International Conference on Harmonisation (ICH) guidelines [27,28]. The method is validated for specificity, linearity, recovery, precision, and the limits of detection (LOD) and limits of quantification (LOQ).
Linearity
Linearity was determined by different known concentrations of caffeine standard solution in triplicate by diluting the standard stock solution. For the determination of linearity, five aliquots were pipetted out from standard stock solution (i.e., 60 ppm). 2-10 ml of standard stock solution was pipetted out in to a series of 10 ml volumetric flasks and volume was made up with the solvent to obtain concentration ranging from 10 ppm to 60 ppm of caffeine. The calibration curve was constructed by plotting the peak areas against concentration, and the linear regression equations were calculated. The correlation coefficient was also computed (Table 2 and Figure 5).
Table 2 Linearity data for caffeine.
| Concentration |
Peak Area |
| 10 |
112000 |
| 20 |
233380 |
| 30 |
330677 |
| 40 |
431778 |
| 50 |
530553 |
| 60 |
650988 |
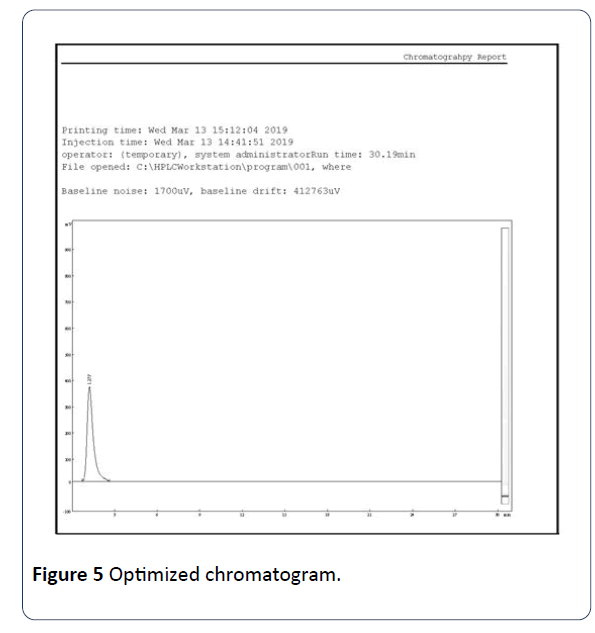
Figure 5: Optimized chromatogram.
Precision
Precision was determined by studying the repeatability (intraday) and intermediate (inter day) precision. The repeatability and intermediate precision of the method was determined by calculating the percentage relative standard deviation (% RSD). The repeatability was examined on the same day, whereas intermediate precision examined on different days by the different analyst (Table 3).
Table 3 Repeatability data for caffeine (25 ppm).
| Number |
Concentration of Sample (ppm) |
Retention time (min) |
Area |
Result % |
| 1 |
25 |
1.276 |
235470 |
99.2 |
| 2 |
25 |
1.275 |
233380 |
99.4 |
| 3 |
25 |
1.277 |
245310 |
99.3 |
| 4 |
25 |
1.27 |
240120 |
99.7 |
| 5 |
25 |
1.273 |
247110 |
99.8 |
| 6 |
25 |
1.276 |
234150 |
99.9 |
| |
Average |
1.274 |
239256 |
99.55 |
| |
Std. Dev. |
0.002588 |
5899.49 |
1.87 |
| |
% RSD |
0.20% |
2.47% |
0.19% |
Accuracy
The accuracy for the method was determined by spiking the blank samples at standard concentrations (10, 50 and 100 ppm) and analyzing their recoveries (Table 4).
Table 4 Recovery study of caffeine.
| Concentration in the blank (ppm) |
Amount of spiked caffeine (mg) |
Amount of caffeine found (mg) |
Recovery % |
| 10 |
20 mg |
19.2 |
98.6 |
| 50 |
100 mg |
99.4 |
97.8 |
| 100 |
200 mg |
199.2 |
97.4 |
The LOD and the LOQ for caffeine were found to be 2.12 ppm and 7.24 ppm, respectively. Low LOD and LOQ of caffeine enable the detection and quantitation of this alkaloid in C. sinensis at low concentrations.
Results and Discussion
Experimental trails
Before choosing the chromatographic condition, a number of trials were carried out with different ratios of solvents, flow rate, and temperatures to check the retention time (RT), peak shape, tailing factor (peak symmetry), and theoretical plates of the analyte (Figure 5).
Acceptance criteria: Correlation coefficient should not be less than 0.998.
Robustness: The Robustness of the method was determined by making slight changes in the experimental conditions such as change in the flow rate, mobile phase and wave length (Table 5).
Table 5 Summary of robustness.
| Parameters |
Condition |
Rt |
| Flow rate |
0.9 ml/min |
1.276 |
| Actual flow rate |
1 ml/min |
1.275 |
| Flow rate |
1.1 ml/min |
1.27 |
| Wavelength |
271 nm |
1.221 |
| Wavelength |
273 nm |
1.275 |
| Wavelength |
275 nm |
1.274 |
Discussion
Results obtained from method validation study can be used to judge the quality, reliability, and consistency of analytical results. An RP-HPLC method was developed and validated for the determination of caffeine in C. sinensis. Several mobile phase compositions were tried, and a satisfactory separation was obtained using the mobile phase composition water: Acetonitrile (A:B): (60:40 v/v). An optimized chromatogram of blank, standard, and sample was shown in Figures 6-8. The Rt of standard and sample peak was found to be at 1.275 and 1.278 min, respectively.
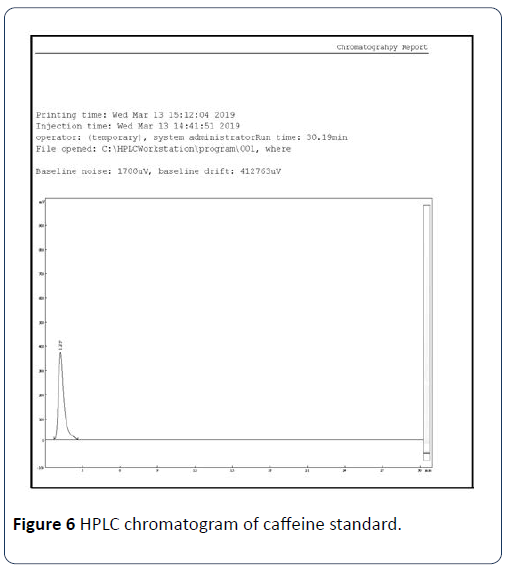
Figure 6: HPLC chromatogram of caffeine standard.
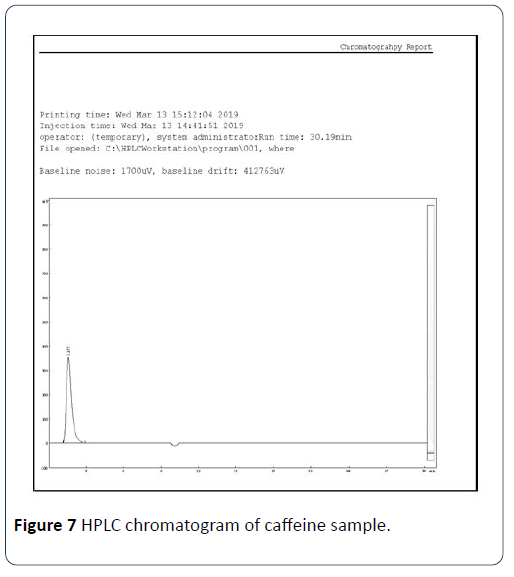
Figure 7: HPLC chromatogram of caffeine sample.
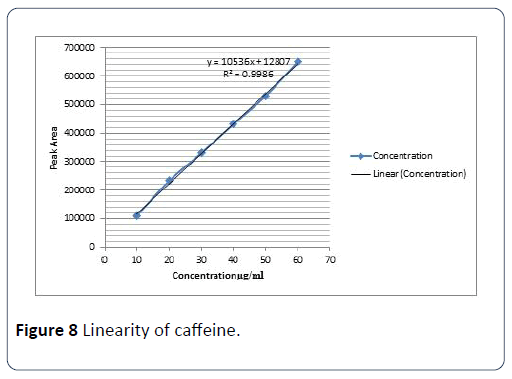
Figure 8: Linearity of caffeine.
The linearity of the analytical method, calibration curves were plotted by peak area versus concentration of caffeine standard in the range 10-60 ppm. This indicated that good fitting of the curve. The correlation coefficient (R2) of caffeine standard solution was 0.998. The acceptance criteria for linearity are that the correlation coefficient (R2) should not be less than 0.999. This indicates that the method showing good linearity.
The repeatability of the method was investigated by performing 6 repeated analysis of 1 standard solution (25 ppm) on the same day (for intra-day repeatability) and different day for inter day precision. The results showed that the % RSD for retention time and area were satisfactory for further analysis.
The accuracy for the method was determined by spiking the blank samples at standard concentrations (10, 50 and 100 ppm) and analyzing their recoveries. Sensitivity of the method was measured in terms of Limit of detection (LOD) and limit of Quantification (LOQ).
Conclusion
A simple reverse phase HPLC method was developed for the determination of Caffeine present in tea leaves. An LC Chromatopak C18 (250 mm × 4.6 × 5 micron) column with UV Detector in isocratic mode, with mobile phase water: Acetonitrile (60:40 v/v) was used. The flow rate was 1.0 ml/min and effluent was monitored at 273 nm. The retention time was 1.275 min for Caffeine. The linearity range was found to be 10-60 μg/ml. The proposed method was also validated. The proposed study describes a new RP-HPLC method for the Estimation of Caffeine. A new RP-HPLC method was developed for the estimation of Caffeine using simple mobile phase–Water: Acetonitrile: (60:40 v/v) was used. The method gave good results within a short analysis time. The developed method was validated in accordance with ICH guidelines and all of the results were within the limits. The developed HPLC method is a simple, rapid, precise, accurate and can be widely accepted and can recommended for efficient assays in routine work. Since the run time was 30 min the Rt was 1.275, the run time can be reduced to 10 min, the time and mobile phase can be saved.
Acknowledgements
The authors are thankful and grateful to the Management of Seven Hills College of Pharmacy, Tirupati for providing us with the required facilities to carry out this research work.
Conflict of Interest
The authors do not have any conflict of interest.
24367
References
- Chaturvedula VSP, Prakash I (2011) The aroma, taste, color and bioactive constituents of tea. J Med Plants Res 5: 2110-2124.
- Chaudhary N, Bhardwaj J, Seo HJ, Kim MY, Shin TS, et al. (2014) Camellia sinensis fruit peel extract inhibits angiogenesis and ameliorates obesity induced by high-fat diet in rats. J Funct Foods 7: 479-486.
- Chen IJ, Liu CY, Chiu JP, Hsu CH (2016) Therapeutic effect of high-dose green tea extract on weight reduction: A randomized, double-blind, placebo-controlled clinical trial. Clin Nutr 35: 592-599.
- Chu DC (1997) Green tea-its cultivation, processing of the leaves for drinking materials and kinds of green tea. In: Yamamoto T, Lekh JR, Chu DC, Kim M (eds.) Chemistry and applications of green tea. CRC Press, Boca Raton, pp: 1-11.
- Gonbad RA, Afzan A, Karimi E, Sinniah UR, KumaraSwamy M (2015) Phytoconstituents and antioxidant properties among commercial tea (Camellia sinensis L.) clones of Iran. Electron J Biotechnol 18: 433-438.
- Cooper R (2012) Green tea and theanine: Health benefits. Int J Food Sci Nutr 63: 90-97.
- Crespy V, Williamson G (2004) A review of the health effects of green tea catechins in in vivo animal models. J Nutr 134: 3431S-3440S.
- Culetu A, Fernandez-Gomez B, Ullate M, del Castillo MD, Andlauer W (2016) Effect of theanine and polyphenols enriched fractions from decaffeinated tea dust on the formation of Maillard reaction products and sensory attributes of breads. Food Chem 197: 14-23.
- Cunha CA, Lira FS, Neto JCR, Pimentel GD, Souza GIH, et al. (2013) Green tea extract supplementation induces the lipolytic pathway, attenuates obesity and reduces low-grade inflammation in mice fed a high-fat diet. Mediat Inflammat 2013: 1-8.
- Pinto DSM (2013) Tea: A new perspective on health benefits. Food Res Int 53: 558-567.
- Das DN (1963) Effect of tea and its tannins upon capillary resistance of guinea-pigs. Ann Biochem Exper Med 23: 219-222.
- Delwing-Dal M, Roecker DR, Junges GM, Rodrigues AF, Delwing-de Lima D, et al. (2016) Protective effect of green tea extract against proline-induced oxidative damage in the rat kidney. Biomed Pharmacother 83: 1422-1427.
- Deng WW, Ashihara H (2015) Occurrence and de novo biosynthesis of caffeine and theanine in seedlings of tea (Camellia sinensis). Natural Prod Commun 10: 703-706.
- Durrani FR, Chand N, Jan M, Sultan A, Durrani Z, et al. (2008) Immunomodulatory and growth promoting effects of neem leaves infusion in broiler chicks. Sarhad J Agric 24: 655-659.
- Ekamayake A, Li JJ (2007) Process for enriching extracts of natural theanine. US Patent No. 689910, 2007.
- Eschenauer G, Sweet BV (2006) Pharmacology and therapeutic uses of theanine. Am J Health-Syst Pharm 63: 26-30.
- Fujiki H (2005) Green tea: Health benefits as cancer preventive for humans. Chem Rec 5: 119-132.
- Naik JP, Nagalakshmi S (1997) Determination of caffeine in tea products by an improved high-performance liquid chromatography method J Agric Food Chem 45: 3973-3975.
- El-Shahawi MS, Hamza A, Bahaffi SO, Al-Sibaai AA, Abduljabbar TN (2012) Analysis of some selected catechins and caffeine in green tea by high performance liquid chromatography Food Chem 134: 2268-2275.
- Naveen P, Lingaraju HB, Deepak M, Medhini B, Prasad KS (2018) Method development and validation for the determination of caffeine: an alkaloid from coffea arabica by high-performance liquid chromatography method. Pharmacognosy Res 10: 88-91.
- Saputri FA, Muchtaridi M (2018) Analytical method development and validation for the determination of caffeine in green coffee beans (Coffea arabica l.) from three districts of west java, indonesia by high performance liquid chromatography. Int J App Pharm 10: 107-111.
- Asci B, Zor SD, Dönmez OA (2016) Development and validation of HPLC method for the simultaneous determination of five food additives and caffeine in soft drinks. Int J Anal Chem 2016: 2879406.
- Shrestha S, Rijal SK, Pokhrel P, Raia KP (2016) Simple HPLC method for determination of caffeine content in tea and coffee. J Food Sci Techol 9: 74-78.
- Bae IK, Ham HM, Jeong MH, Kim DH, Kim HJ (2015) Simultaneous determination of 15 phenolic compounds and caffeine in teas and mate using RP-HPLC/UV detection: method development and optimization of extraction process. Food Chem 172: 469-475.
- Kingori SM, Ongoma PO, Ochanda SO (2018) Development of an improved isocratic HPLC method for the determination of gallic acid, caffeine and catechins in tea. J Nutr Health Food Sci 6: 1-9.
- Fernando CD, Soysa P (2016) Simple isocratic method for simultaneous determination of caffeine and catechins in tea products by HPLC. Springer Plus 5: 970.
- ICH (Q2B) Note for guidance on validation of analytical procedures: methodology. Geneva, Switzerland: IFPMA, International Conference on Harmonization, 1996.
- ICH (Q2A) (2005) Validation of analytical procedures: text and methodology. Geneva: International Conference on Harmonization.

