Keywords
Nutrition Security; Multisector Approach; Malnutrition; Child Health
Introduction
The importance of addressing malnutrition in all its form is now well recognized. Malnutrition has long term negative and mostly irreversible effects in early life, including impaired cognitive development, reduced economic productivity, lower attained schooling and an increased risk of chronic disease in adulthood [1]. Recognizing this high importance of nutrition to the development of a nation as well as the world economy, the Sustainable Development Goals (SDGs) of the 2030 Agenda have placed nutrition as one the most central goal, with at least 12 of the 17 SDGs having indicators relevant to nutrition.
And yet, despite the strong economic growth in 2018, undernourishment increased for the third year in row [2]. It is estimated that around 821 million people in the world face chronic food starvation. While on one hand hunger is rising, malnutrition continues to be continues to remain at alarming high levels despite registering a fall over the years. Globally, around 151 million children under 5 years of age are stunted, even though the percentage declined from 32.6 to 22.2 percent. Wasting affected lives of around 7.5 percent or 50.5 million children under five, while 38.3 million children were found to be overweight [3].
India too faces a similar alarming situation and has a dismal performance in malnutrition. Though the prevalence rates declined from 48 to 39 percent between 2006 and 2014. For children five years or younger, 19.8% are waste and 42.4% are underweight according to NFHS-4, though both showed a decline from NFHS-3 figures. Still, the numbers are staggering with 46.4 million children under five being stunted, 25.5 million wasted and 97 million children being underweight. Child malnutrition rates in India continue to be highest among the world, with one in three children being either stunted or underweight. Along with under nutrition, India now also faces the increasing prevalence of over nutrition reflected in overweight, obesity and associated non-communicable diseases.
Given this grave situation of malnutrition in India, it becomes imperative to understand and analyse the nutritional situation of the country. This review draws attention to these issues. The main aims of the review are (i) discuss the concept of nutrition security (ii) highlight the potential causes and drivers of malnutrition and (iii) provide an overview of current programs and policies directed at improving malnutrition. Consequently, this paper is organized as follows. Section 2 discusses the concept of nutritional security, especially bringing out the distinction from food security and the conceptual framework for actions to achieve nutritional security. Section 3 highlights the causes and drivers of malnutrition within the context of India. The concluding section summarizes the main points presented in the paper.
Nutrition Security: Definition and Concept
The term nutrition security emerged in the mid-1990s. It focuses on food consumption by the household and on how that food is utilized by the body. In 1995, building on the UNICEF’s Conceptual Framework, IFPRI proposed the definition as “nutrition security can be defined as adequate nutritional status in terms of protein, energy, vitamins, and minerals for all household members at all times. The World Bank further elaborated on the concept, defining it as “nutrition security exists when food security is combined with a sanitary environment, adequate health services, and proper care and feeding practices to ensure a healthy life for all household members.” The Road Map for Scaling-Up Nutrition [4] elaborates on the definition as follows “nutrition security is achieved when secure access to an appropriately nutritious diet is coupled with a sanitary environment, adequate health services and care, to ensure a healthy and active life for all household members.” FAO [5] defined existence of nutrition security as “nutrition security exists when all people at all times consume food of sufficient quantity and quality in terms of variety, diversity, nutrient content and safety to meet their dietary needs and food preferences for an active and healthy life, coupled with a sanitary environment, adequate health, education and care.”
From these definitions, it is clear that a multi-sectoral approach to nutrition in a central tenant of nutrition programming. Following LANCET [6], nutrition interventions can be categorized into three main components: (i) Nutrition Specific interventions address the immediate causes of malnutrition which include support for exclusive breastfeeding up to 6 months of age and continued breastfeeding, together with appropriate and nutritious food, up to two years of age, fortification of foods, micronutrient supplementation and treatment of severe malnutrition (ii) Nutrition Sensitive interventions: these target the underlying causes household food insecurity, poor caring practices and unhealthy environments. These call for strengthening policies and programs related to agriculture, education, early childhood development, public health and health systems, water and sanitation works, and social protection and safety nets (iii) Building an enabling environment: While the concept of nutrition-specific and nutrition-sensitive interventions is now a fundamental element in nutrition planning, it is also being increasingly realized that achievement of nutrition security is also dependent on institutions and practices that create an enabling environment. These approaches include poverty reduction strategies, governance capabilities, disaster, crisis management and environmental safeguards [7,8].
Nutritional Outcomes and Determinants
As mentioned above, malnutrition in India is a serious issue for concern from national as well as global perspective. In this section, we first present the levels and trends in nutrition outcomes and the determinants.
Nutrition outcomes
Nutritional status of children: Stunting in under-five children is an indicator of household food security and chronic energy deficiency. India has registered improvement in stunting prevalence rates overtime. 38.4 percent of children under age five years were stunted as per NFHS-4, down from 48 percent in NFHS-3. This has, however, not matched with the economic growth and still has the highest number of stunted children in the world (46.8 million children), representing one-third of the global total of stunted children under the age of five [3]. Acute malnutrition continues to be an enormous challenge in India. In 2015-16, twenty one percent of children under age five years were wasted found too thin for their height. This has marginally gone up from twenty percent in 2005-06. Wasting, an indicator of current nutritional status, may be the consequence of starvation or severe disease or a combination of both. It is estimated that one in five children in India are wasted. India is home to the largest number of wasted children accounting for almost 31 percent of all the world’s wasted children [2]. Thirty six percent of children under five were underweight in 2015-16 as compared to 43 percent in 2005-06. Over-nourished children are shown to be at higher risk of becoming over nourished adults. In India, there is a two percent of pre-school children are overweight.
Nutritional Status by background characteristics: Table 1 presents the trends in nutritional status by place of residence. As can be seen, that children living in rural areas are more malnourished across all indicators. While the levels of stunting and underweight have gone down between NFHS 3 and NFHS 4, prevalence of wasting has increased. This trend holds true for both rural and urban areas.
Table 1 Trends in nutrition status of children, 2005-06 and 2015-16.
| |
NFHS-4 (2015-16) |
NFHS-3 (2005-06) |
| Stunted |
Wasted |
Underweight |
Stunted |
Wasted |
Underweight |
| Urban |
31 |
20 |
29.1 |
39.6 |
16.9 |
32.7 |
| Rural |
41.2 |
21.4 |
38.3 |
50.7 |
20.7 |
45.6 |
| Total |
38.4 |
21 |
35.7 |
48 |
19.8 |
42.5 |
Some of the important determinants of child nutrition have been outlined in literature as place of residence (as discussed above), mother’s educational levels, mother’s nutritional status and wealth of the household. Table 2 presents this data for NFHS-4. It can be clearly seen that child malnutrition is inversely related to mother ’ s educational background. Prevalence of malnutrition is highest for children born to mothers who have never attended school and then falls with more numbers of years of schooling. A similar trend is noticed for mother ’ s nutritional status where children of underweight mothers have higher prevelance of malnutrition. As much as 46 percent of children stunted are born to underweight mothers. The rates are lower for overweight mothers, which could be due to the fact that being overweight is directly related to higher levels of income of the household. This fact is verified by examining malnutrition levels by wealth index. Wealthier the household, lesser is the prevelance of malnourished children.
Table 2 Nutritional status of children by background characteristics, 2015-2016.
| |
Stunted |
Wasted |
Underweight |
Overweight |
| Residence |
| Urban |
31 |
20 |
29.1 |
0.8 |
| Rural |
41.2 |
21.4 |
38.3 |
0.4 |
| Mother's schooling |
| No Schooling |
50.7 |
22.7 |
46.8 |
0.3 |
| <5 years complete |
45.3 |
22.2 |
41.9 |
0.4 |
| 5-7 years complete |
39.8 |
21.6 |
37.6 |
0.4 |
| 8-9 years complete |
35.5 |
21 |
33.1 |
0.5 |
| 10-11 years complete |
29.7 |
19.8 |
28.5 |
0.7 |
| 12 or more years complete |
23.8 |
18.5 |
21.8 |
1 |
| Mother's nutritional status |
| Underweight (BMI<18.5kg/m2) |
45.8 |
26.7 |
48.7 |
0.2 |
| Normal |
38.2 |
20.4 |
34.3 |
0.5 |
| (BMI 18.5-24.9 kg/m2) |
| Overweight |
27.1 |
14.2 |
21.7 |
1.1 |
| (BMI>25.0 kg/m2) |
| Wealth index |
| Lowest |
51.4 |
24.2 |
48.6 |
0.3 |
| Second |
43.5 |
21.7 |
40.4 |
0.4 |
| Middle |
36.5 |
20.2 |
33.2 |
0.4 |
| Fourth |
29.2 |
19.3 |
27.4 |
0.7 |
| Highest |
22.2 |
17.9 |
20.1 |
1.1 |
Nutritional status of adults: Two major causes of concern among adult nutritional levels include overweight and obesity and anaemia. NFHS 4 indicates that around 21 percent of women are overweight or obese, up from 13 percent in NFHS 3. Overweight or obesity prevalence increased from 9.3 percent in 2005-06 to 20 percent in 2015-16. At the same time, the overall prevalence of anaemia remained high for women. Fifty-three percent of women and 23 percent of men in age group 15-49 are anaemic as per NFHS-4.
Inter-state variations: While the aggregate all India malnutrition rates signify the macro picture, it is equally important to look at the inter-state variations. India is a heterogeneous country with wide variations between the states, terms of both economic and development indicators.
Figure 1 presents the changes in childhood stunting levels between 2005-06 and 2015-2016. There is a wide variation between the states with Kerala having stunting rates at 24.5 percent and Uttar Pradesh at 56.8 percent, there are improvements in stunting levels across all the states. The data reveals that this fall in stunting is uneven across states, with some states like Chhattisgarh, Arunachal Pradesh, West Bengal and Gujarat registering much higher decline than other states.
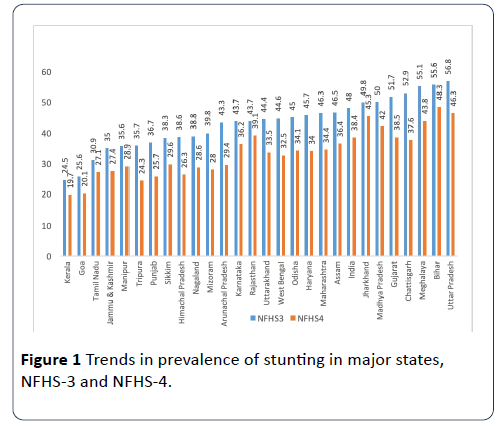
Figure 1: Trends in prevalence of stunting in major states, NFHS-3 and NFHS-4.
Similar variations across states and UTs are seen in all the indicators of nutrition. Table 3 presents nutrition status of population for Indian States and Union Territories (UTs). The red coloured cells indicate worst performers for each indicator of malnutrition and the blue coloured cells are the best performers. The following inferences are being drawn from the table.
Table 3 Nutritional status of India, by state and UTs, 2015-16.
| |
Children under-5 years (%) |
Adults (%) |
| India/States/UTs |
Stunted |
Wasted |
Under-weight |
Anaemic (6-59 months) |
Anaemic Women (15-49 years) |
Overweight or Obese Women |
Overweight or Obese Men |
| India |
38.4 |
21 |
35.7 |
58.4 |
53 |
20.7 |
18.6 |
| A and N Islands |
23.3 |
18.9 |
21.6 |
49 |
65.7 |
31.8 |
38.2 |
| Andhra Pradesh |
31.4 |
17.2 |
31.9 |
58.6 |
60 |
33.2 |
33.5 |
| Arunachal Pradesh |
29.4 |
17.3 |
19.5 |
50.7 |
40.3 |
18.8 |
20.6 |
| Assam |
36.4 |
17 |
29.8 |
35.7 |
46 |
13.2 |
12.9 |
| Bihar |
48.3 |
20.8 |
43.9 |
63.5 |
60.3 |
11.7 |
12.6 |
| Chandigarh |
28.7 |
10.9 |
24.5 |
73.1 |
75.9 |
41.5 |
32 |
| Chattisgarh |
37.6 |
23.1 |
37.7 |
41.6 |
47 |
11.9 |
10.2 |
| Dadra and Nagar Haveli |
41.7 |
27.6 |
38.9 |
84.6 |
79.5 |
19.2 |
22.9 |
| Daman and Diu |
23.4 |
24.1 |
26.7 |
73.8 |
58.9 |
31.6 |
30.7 |
| Delhi |
32.3 |
17.1 |
27 |
62.6 |
52.5 |
34.9 |
24.6 |
| Goa |
20.1 |
21.9 |
23.8 |
48.3 |
31.3 |
33.5 |
32.6 |
| Gujarat |
38.5 |
26.4 |
39.3 |
62.6 |
54.9 |
23.7 |
19.7 |
| Haryana |
34 |
21.2 |
29.4 |
71.7 |
62.7 |
21 |
20 |
| Himachal Pradesh |
26.3 |
13.7 |
21.2 |
53.7 |
53.4 |
28.6 |
22 |
| Jammu and Kashmir |
27.4 |
12.1 |
16.6 |
43.3 |
40.3 |
29.1 |
20.5 |
| Jharkhand |
45.3 |
29 |
47.8 |
69.9 |
65.2 |
10.3 |
11.1 |
| Karnataka |
36.2 |
26.1 |
35.2 |
60.9 |
44.8 |
23.3 |
22.1 |
| Kerala |
19.7 |
15.7 |
16.1 |
35.6 |
34.2 |
32.4 |
28.5 |
| Lakshadweep |
27 |
13.8 |
23.4 |
51.9 |
45.7 |
41.4 |
24.6 |
| Madhya Pradesh |
42 |
25.8 |
42.8 |
68.9 |
52.5 |
13.6 |
10.9 |
| Maharashtra |
34.4 |
25.6 |
36 |
53.8 |
48 |
23.4 |
23.8 |
| Manipur |
28.9 |
6.8 |
13.8 |
23.9 |
26.4 |
26 |
19.8 |
| Meghalaya |
43.8 |
15.3 |
29 |
48 |
56.2 |
12.2 |
10.1 |
| Mizoram |
28 |
6.1 |
11.9 |
17.7 |
22.5 |
21.1 |
21 |
| Nagaland |
28.6 |
11.2 |
16.8 |
21.6 |
23.9 |
16.2 |
14 |
| Odisha |
34.1 |
20.4 |
34.4 |
44.6 |
51 |
16.5 |
17.2 |
| Puducherry |
23.7 |
23.6 |
22 |
44.9 |
52.4 |
36.7 |
37.1 |
| Punjab |
25.7 |
15.6 |
21.6 |
56.6 |
53.5 |
31.3 |
27.8 |
| Rajasthan |
39.1 |
23 |
36.7 |
60.3 |
46.8 |
14.1 |
13.2 |
| Sikkim |
29.6 |
14.2 |
14.2 |
55.1 |
34.9 |
26.7 |
34.8 |
| Tamil Nadu |
27.1 |
19.7 |
23.8 |
50.7 |
55.1 |
30.9 |
28.2 |
| Telangana |
28.1 |
18 |
28.5 |
60.7 |
56.7 |
28.1 |
24.2 |
| Tripura |
24.3 |
16.8 |
24.1 |
48.3 |
54.5 |
16 |
15.9 |
| Uttar Pradesh |
46.3 |
17.9 |
39.5 |
63.2 |
52.4 |
16.5 |
12.5 |
| Uttarakhand |
33.5 |
19.5 |
26.6 |
59.8 |
45.2 |
20.4 |
17.7 |
| West Bengal |
32.5 |
20.3 |
31.5 |
54.2 |
62.5 |
19.9 |
14.2 |
• Bihar, Uttar Pradesh, Jharkhand and Meghalaya are the worst performers in prevalence of stunting in children less than 5 years of age. Karnataka, Jharkhand, Dadra and Nagar Haveli and Gujrat are worst performers in wasting rates. Bihar, Uttar Pradesh and Jharkhand perform worst in terms of underweight prevalence.
• Anaemia rates are high not only among the children but also for women in the reproductive age group, affecting more than half of the concerned population. States of Jharkhand and UTs of Chandigarh and Dadra and Nagar Haveli have high prevalence rates for all indicators of children malnutrition.
• The incidence of overweight or obesity among adults is highest in Chandigarh, Lakshadweep, Andaman and Nicobar Island and Delhi.
Nutrition specific interventions
Breastfeeding: Poor infant and child feeding practices are associated with poor nutrition outcomes8. Proper feeding of infants and young children can improve their chances of survival and promote optimal growth and development [9]. Breastfeeding and complementary feeding are important determinants of child malnutrition. Data indicate that exclusive breastfeeding increased from 46.4 in 2005-2006 percent to 54.9 percent in 2015-2016. NFHS-4 data indicate that about two- fifths of the children under five years of age were breastfed within one hour of the birth, up from 25 percent in NFHS-3.
Complimentary feeding: The nutritional needs for growth and development in children 6-23 months of age are greater per kilogram of body weight than at any other time in life. Frequent feeding of a variety of foods is therefore important to help ensure nutrient needs are met. The benefits of good complementary foods and feeding expand beyond their welldocumented child survival benefits [10]. NFHS-4 indicated that among the breastfed children 6-23 months, 19.8 percent children were fed with minimum dietary diversity while the 33.6 percent for non-breastfed children got the minimum dietary diversity in 2015-2016. There was a decline in timely complementary feeding rates, from 52.6 percent to 42 percent during the same period. The nutrient needs of the youngest family members are greatest. Figure 2 presents the changes in feeding practices between 2005-06 and 2015-2016.
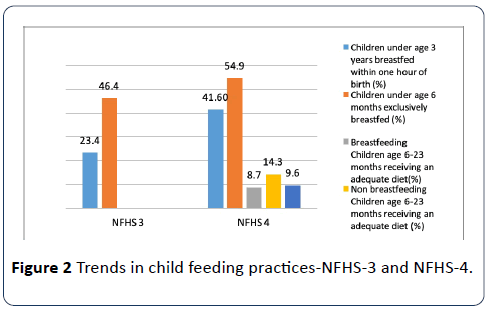
Figure 2: Trends in child feeding practices-NFHS-3 and NFHS-4.
Childhood diseases: Of all the childhood infections, diarrhoea has been strongly associated with reduced linear growth [11], also leading to dehydration and death in young children in severe cases. Globally, diarrhoeal disease is the second leading cause of death in children under five years old, and is responsible for killing around 525 000 children every year [12]. In India as per NFHS-4, 38 percent of children with diarrhoea received continued feeding and oral rehydration therapy. Evidence for prevalence and treatment of childhood illness reveals that for percentage of children less than five years with symptoms of illness, 78 percent of children with acute respiratory illness had sought medical advice or treatment. The percentage for similar children was 73 for those with fever and 68 for those with diarrhoea.
Prevention of micronutrient deficiencies: Micronutrient deficiencies can addressed through the integrationof a number of complementary strategies, such as promotion of dietary diversity, consumption of micronutrient-rich foods, improved health and hygiene, nutrition education and communication, micronutrient supplementation and food fortification. While the food based approaches ate best and sustainable in the long run, micronutrient supplementation is a proven and effective short run measure. NFHS-4 reports that around 60 percent of children under five are anaemic. Sixty percent of children under five were given vitamin A supplements in the six months preceding the survey while forty-four percent consumed foods rich in vitamin A in the day or night before the interview and 18 percent consumed iron-rich foods.
Nutrition sensitive interventions
Water, sanitation and hygiene (WASH). The WASH sector plays a crucial role in ensuring nutrition security through its impact on the utilization of food resources, ensuring a healthy environment, access to health services and adequate caring practices. Access to safe and improved drinking water and sanitation facilities greatly enhances absorption of nutrients. Safe and sufficient drinking water, adequate sanitation and hygiene have always been important development goals at national and global levels. In India, about 90 percent of household got access to improved source drinking water source during 2015-16. NFHS survey confirms that during 2015-16, 48 percent of household had an improved sanitation facility that is not shared with other households. Thirty-nine percent of the household practiced open defecation.
Agriculture: Food security is an integral part of nutrition security. FAO of the United Nations [13] has defined food security as “ensuring that all people at all times have both physical and economic access to the basic food they need”. It is not only about the food availability at the macro level but also about access and utilization at the micro or household level. This calls for food availability, food access and stability in supply and access and food use. India has witnessed a remarkable increase in production of staple crops following the Green Revolution but the agricultural policy is found to be deficient in answering the macronutrient needs through domestic production. The contribution of agriculture to GDP has steadily declined from 1951 to 2011 along with growth of the Indian economy during this period. While achieving food sufficiency in production, India still accounts for a quarter of the world’s hungry people. Given the important role agriculture plays in the Indian economy, with as much as 58% of the Indian workforce listing agriculture as their primary source of employment and almost half of total rural income being generated within agriculture, it has significant potential to address the nutritional needs of the population [14]. Yet, researchers have found a disconnect between agriculture production and nutrition requirements of India ’ s population [15]. The emphasis is now on improving dietary diversity of food consumption and improve scope of agriculture policies to influence nutrition though the many pathways.
Nutrition-related policies: India ’ s nutrition situation is a manifestation of multiple of factors, ranging from economic, social and cultural to political. It requires not one, but a multiple of inter-sectoral policies to address distinct yet interrelated aspects on nutritional security. One of the major steps taken by Government of Indian in combating malnutrition was adoption of National Nutrition Policy in 1993. It was a multi-sectoral strategy for eliminating malnutrition under the aegis of Department of Women and Child development. It made direct interventions (short term goals) like food fortification, combating micro nutrient deficiency, etc., along with long term indirect policy interventions like improvement in dietary patterns, food security, nutritional surveillance, community participation, etc. Around this time, various mechanisms were already into operation to combat malnutrition, like Integrated Child Development Services (ICDS), Special Nutrition Program, Wheat Based Nutrition Program, etc. Though the malnutrition rates did fall over the years, the levels continue to be high. While government has initiated various programs over the years to improve the nutrition status, concerns regarding malnutrition have persisted despite improvements over the years. While a detailed analysis and evaluation of these policies is outside the purview of this paper, we briefly discuss the relevant national policies here.
The National Health Mission and the ICDS are the main nutrition programs in India covering cover the recommended interventions in child and maternal health [15]. Scholarship has evaluated the impact of ICDS on nutritional status of children both at the micro and macro level, these study show a mixed impact [16-18]. However, evidence also points to the challenges of quality, problems of implementation, leakages, corruption and infrastructure bottlenecks and delays [19].
The National Food Security Act 2013 aims to ensure greater access to adequate quantity of quality food at affordable prices under the Targeted Public Distribution System launched in 1997. Some studies have shown its positive impact reflected in increase in coverage of beneficiaries and improved transportation of food grains, while others have pointed towards delays in implementation.
The Mahatma Gandhi National Rural Employment Guarantee Scheme (MNREGA) has been instrumental in benefitting a large section of targeted population. It targets deprivation and food security in rural India. Evidence suggests that participation in it has had a beneficial impact on nutritional status of children [20]. Yet, numerous studies have pointed towards problems of underutilized funds [21], delays in issuance and distribution of job cards [22], work execution and lack of commitment on the part of agents [23] and lack of staff and training [24]. The Mid Day Meal launched in 1995, with a revision in 2006 aims at improving nutritional status of children in government schools. It has been associated with better educational and nutrition status of school children [25-28]. This, however, is faced with many challenges of corruption, official bottlenecks and implementation issues [29].
Given the above perspective of nutrition situation in India, the National Nutrition Mission (NNM) [30] and called POSHAN Abhiyan was launched in 2018 covering all the 640 districts of the country. It laid the following targets for 2022 (i) to prevent and reduce under nutrition (underweight prevalence) in children (0-3 years) by 3 percentage points per annum from NFHS 4 levels (ii) to reduce the prevalence of anaemia among young children, adolescent girls and women in the reproductive age group (15-49 years) by one third of NFHS 4 levels. It also aims to progressively reduce all forms of under nutrition by 2030. The NNM aims at convergence with various programmes and mapping of various Schemes contributing towards addressing malnutrition [31].
Concluding remarks
This paper presented an overview of malnutrition situation in India. The results show that though there is an improvement in malnutrition, there is a sizeable proportion of population that is malnourished and anaemic. There are three main findings we wish to highlight from this study. First, looking at child nutrition indicators, while stunting rates are falling, they still remain high. Wasting rates among children have increased with India being only second after Sudan, a conflict laden country. India’s high rates of malnutrition are almost double of Sub Saharan Africa, while the growth rate in India is much higher. Second, India faces a large number of anaemic women in the reproductive age group. The anaemia in children is also very high. This is an urgent situation that needs to be tackled. While discussion and debates of malnutrition are around absolute hunger and poverty, hidden hunger is a growing challenge and a more complex situation. In the short run, it is possible to tackle this with food supplements, in the long run people need to be empowered enough to be able to take care of their diets, especially the women. It has been seen from data above that under-nourished mothers give birth to more malnourished children; it thus is a public health emergency to bring about reductions in anaemia. Third, the growing incidence of overweight and obesity, not only among the children but also the adults, is a major cause of concern. The long run adverse effects of childhood obesity in terms of non-communicable and lifestyle diseases are well documented. As incomes rise and dietary habits change towards more packaged food, it becomes imperative to bring out changes through way of awareness building as well as legislation to curb this tendency. Lastly, we notice that there are many nutrition related programs running in India, the ICDS being the longest running program, yet each of them is faced with challenges of quality, implementation and corruption issues. A strong political commitment is required to ensure convergence of these programs to ensure better nutritional outcomes for the Indian population.
Acknowledgements
I would like to thank Indian Council of Social Science Research (ICSSR) for award of Post-Doctorate Fellowship. I would also like to thank my supervisor at TISS, Dr Sandhya Iyer for her guidance and advice.
24500
References
- Victora CG, Adair L, Fall C, Hallal PC, Martorell R, et al. (2008) Maternal and child under nutrition: consequences for adult health and human capital. Lancet 371: 340-357.
- Development Initiatives (2018) 2018 Global nutrition report: shining a light to spur action on nutrition. Bristol, UK: Development Initiatives
- https://scalingupnutrition.org/wp-content/uploads/2013/05/SUN_Framework.pdf
- FAO, WFP and IFAD (2012) The state of food insecurity in the world 2012. Economic growth is necessary but not sufficient to accelerate reduction of hunger and malnutrition. Rome, FAO.
- LANCET (2013) Executive summary of the lancet maternal and child nutrition series. The Lancet.
- Menon P, Bamezai A, Subandoro A, Ayoya MA, Aguayo V (2013) Age-appropriate infant and young child feeding practices are associated with child nutrition in India: insights from nationally representative data. Maternal Child Nutr 11: 73-87.
- Victora GC, Bahl R, Barros AJD, Franca GVA, Horton S, et al. (2016) Breastfeeding in the 21st century: Epidemiology, mechanisms, and lifelong effect. The Lancet 387: 475-490.
- Bhutta ZA, Das JK, Rizvi A, Gaffey MF, Walker N, et al. (2013) EvidenceÃÂÃÂÃÂâÂÂÃÂâÂÂÃÂâÃÂÃÂââ¬Ã
¡ÃÂâââ¬Ã
¡ÃÂìÃÂÃÂââ¬Ã
¡ÃÂâÂÂÃÂÃÂbased interventions for improvement of maternal and child nutrition: What can be done and at what cost? Lancet 382: 452-477.
- Black RE, Victora CG, Walker SP, Bhutta ZA, Christian P, et al. (2013) Maternal and child under nutrition and overweight in low-income and middle-income countries. Lancet 382: 427-451.
- Black RE, Allen LH, Bhutta ZA, Caulfield LE, Onis M, et al. (2008) Maternal and child undernutrition study group, maternal and child under nutrition: global and regional exposures and health consequences. Lancet 371: 243-226.
- FAO (1983) World food security: a reappraisal of the concepts and approaches. Director Generals Report, Rome.
- Kadiyala S, Harris J, Headey D, Yosef S, Gillespie S (2014) Agriculture and nutrition in India: Mapping evidence to pathways. Annals of the New York Academy of Sciences. 1331.
- Avula R, Raykar N, Menon P, Laxminarayan R (2016) Reducing stunting in India: what investments are needed? Maternal Child Nutr 12: 249-252
- Deepali S (2017) Impact of child health intervention program: evidence from India. Int Educ Res J 3: 1-10.
- Dutta A, Ghosh S (2017) Impact of integrated child development scheme on child malnutrition in West Bengal, India. Matern Child Nutr 13: e12385.
- Lokshin M, Gupta MD, Gragnolati M, Ivaschenko O (2005) Improving Child Nutrition? The integrated child development services in India. Development and Change 36: 613-640.
- https://www.ifpri.org/sites/default/files/publications/ifpridp01299.pdf
- Nair M, Ariana P, Ohuma EO, Gray R, De Stavola B, et al. (2013) Effect of the Mahatma Gandhi National Rural Employment Guarantee Act (MGNREGA) on malnutrition of infants in Rajasthan, India: A Mixed Methods Study. PLoS ONE 8: e75089.
- Comptroller and Auditor General (2008) Performance audit of implementation of National Rural Employment Guarantee Act, 2005 (NREGA). Performance Audit Report No. 42. New Delhi, India: Comptroller and Auditor General.
- PACS-CSO (Poorest Area Civil Society–Civil Society Organization) (2007) Status of NREGA implementation: Grassroots learning and ways forward. 2nd monitoring report (April 2006 to March 2007). Delhi, India: Poorest Area Civil Society (PACS) Program.
- Ambasta PPS, Shankar V, Shah M (2008) Two years of NREGA: The road ahead. Economic and Political Weekly 43: 41-50.
- Katharina R, Schiffer E (2010) How to overcome the governance challenges of implementing NREGA. IFPRI Discussion Paper 963: 1-10.
- Chakraborty T, Jayaraman R (2019) School feeding and learning achievement: Evidence from India's midday meal program. J Development Economics 10: 1-50.
- Dutta A, Ghosh S (2017) Impact of integrated child development scheme on child malnutrition in West Bengal, India. Matern Child Nutr 13: e12385.
- Sinha D (2008) Social audit of midday meal scheme in AP. Economic Political Weekly 43: 1-10.
- Abhijeet S, Park A, Dercon S (2014) School meals as a safety net: an evaluation of the midday meal scheme in India. Economic development and cultural change 62: 275-306.

