Research Article - (2023) Volume 17, Issue 8
Prevalence and Severity of Digital Eye Strain (DES) during the COVID-19 Pandemic Period amongst the University-Going Students of Jorhat, Assam: A Cross-Sectional Study
Nazma Sultana Hussain* and
Moamanen Jamir
Department of Optometry, The Assam Kaziranga University, Koraikhowa, India
*Correspondence:
Nazma Sultana Hussain, Department of Optometry, The Assam Kaziranga University, Koraikhowa,
India,
Email:
Received: 17-Jul-2023, Manuscript No. IPHSJ-23-14056;
Editor assigned: 20-Jul-2023, Pre QC No. IPHSJ-23-14056 (PQ);
Reviewed: 03-Aug-2023, QC No. IPHSJ-23-14056;
Revised: 21-Aug-2023, Manuscript No. IPHSJ-23-14056 (R);
Published:
18-Sep-2023
Abstract
Aim: The purpose was to determine the prevalence, the
symptom frequency and severity and the associated risk
factors of Digital Eye Strain (DES) among the universitygoing
students attending and have attended online classes
during the COVID-19 pandemic.
Methods: A total of 300 subjects from different university
within the Jorhat region for a period of 4 months, from
January to April, 2022 were enrolled in this cross sectional
study. Questions about the habits of digital device usage, its
severity and frequency were asked in the questionnaire.
Data was collected and tabulated in MS Excel and further
analyzed using SPSS software version 26.00. Associated risk
factors of DES were analyzed by univariate and multivariate
logistic regression with age, gender, device used, viewing
distance and duration of screen use. A P value of ≤ 0.005
was considered statistically significant.
Results: Three hundred students responded to the
questionnaire. The mean age of the student was found to
be 22.10 ± 2.0. The mean duration of digital devices used
during the COVID-19 pandemic was found to be 3.22 ± 0.98
h which is more than the pre-COVID-19 pandemic (2.80 ±
1.07, P<0.001). Prevalence of DES in the cohort was 92%
(n=276). Of these 27% were mild, 37% moderate and 27.3%
of severe grade. Multivariate analysis revealed that age 21
years (P=0.05), female gender (P=0.0005), smartphone use
(P=0.004) and duration of online class >4 hr (P=0.0008) as
independent risk factors for DES in the student.
Conclusion: There is an increased prevalence of DES among
the student in the COVID pandemic compared to before the
COVID pandemic. Parents, teachers and eye care
practitioners should be considerate about the usage of
digital device to avoid DES and Optometrist should provide
guidelines for the proper usage of the gadgets for abolishing
the symptoms and sufferings due to DES.
Keywords
Digital eye strain; Students; Online classes;
COVID-19 pandemic
Introduction
Digital eye strain, a growing public health concern, is a
syndrome characterised by visual disruption and/or ocular pain
caused by a variety of pressures on the ocular environment. It
includes a variety of ocular and visual symptoms and estimates
imply that it affects up to 50% of computer users. External
symptoms associated with dry eye (grittiness, alien sensation,
redness, watering and photophobia) and those associated with
accommodative or binocular vision stress (eye discomfort,
headache and difficulty focusing from one distance to another).
The pandemic of Coronavirus illness (COVID-19) has forced
severe lifestyle changes, one of which is increasing exposure to
digital devices. On March 25, 2020, India went into a
countrywide lockdown. Lockdown was implemented early in the
disease's development in India in an attempt to limit the
infection, resulting in the shutdown of services such as schools,
colleges and most workplaces. People are being compelled to
work from home, and e-learning is the new standard for pupils.
This has led to hazardous practises such as prolonged exposure
to a digital gadget and a lack of outdoor recreational activities.
Because of the rising usage of technological devices, DES has
become more popular among young adults in the contemporary
context. DES is not a single entity, but rather a collection of
symptoms such as ocular fatigue, dryness, abnormalities in
accommodation and vergences and refractive error that, in the
current scenario, are confined to the form of DES-based issues in
a patient.
Aim
To assess the prevalence and impact of lifestyle due to digital
eye strain.
Objective
To evaluate the digital eye strain and symptoms based on its
risk factors among the population of 18-30 year’s age group
from different universities in the Jorhat region.
Materials and Methods
A cross-sectional, random sampling questionnaire-based
study is used to evaluate the prevalence and severity of DES
among the university-going students attending online classes or
have attended previously in Jorhat, Assam during the COVID-19
pandemic. During the 16 weeks of the cross-sectional study, a
total of 300 responses were collected from different universities
within Jorhat region. Individual respondent’s interview was
collected using a pre-validated questionnaire, and answers were
collected from the respondents along with signed consent form
[1]. The demographic data of the participants include age,
gender, duration of digital device used, digital device used and
distance of digital device from the eyes.
The queries were designed to assess the prevalence of DES
and also to assess the DES for different risk factors.
Place of study
• The Assam Kaziranga university, Jorhat
• Assam Women’s university, Jorhat
• Assam Agriculture university, Jorhat
Inclusion criteria
• Patient willing to participate in the study
• Age group between 18-30
• Patient scoring DES score of ≥ 6
Exclusion criteria
• Suffering from any previous eye ailments
• From any kind of systemic diseases
• Any history of ocular trauma/surgery
• Undergoing any kind of treatment of ocular or systemic
conditions
The questionnaire comprised of four sections: Demography of
the subject, digital device information, DES symptoms
questionnaire and good ocular health safety tips for subjects
during digital device use.
A pre-validated computer vision syndrome questionnaire
developed by Segui, et al. was used to measure the severity of
DES symptoms. The CVS Q assessed the severity (moderate or
severe) and frequency (never, occasionally or always/often) of
16 eye strain-related symptoms, including burning sensation,
itching in the eyes, foreign body sensation, watering, excessive
blinking, redness, eye pain, heaviness in the eyelids, dryness,
blurring of vision, double vision, difficulty in near vision,
intolerance to light, coloured halos, vision worsening and
headache [2]. The following frequency was recorded: Never=no
symptoms; occasionally=scattered symptoms or once a week;
often or always=2 or 3 times per week or virtually everyday.
Moderate or severe intensity was reported. Following formula
was applied to calculate the total.

Score: Where frequency: Never=0, occasionally=1, often or
always=2 and intensity: Moderate=1, intense=2. DES score of ≥ 6
was indicative of DES.
Statistical analysis
The data collected from the respondents was exported as
Microsoft Excel sheets via the Google drive link and the
statistical analysis was performed using IBM SPSS version 26.00
Statistics software. Qualitative factors were provided as
numbers and percentages, whereas quantitative variables were
presented as mean standard deviation.
Univariate and multivariate logistic regression were used to
examine the risk variables of DES in relation to age, gender,
device utilised (smartphone, desktop, laptop/tab), viewing
distance and length of screen use. The chi-square test was
employed in the univariate analysis to evaluate the relationships
between the qualitative variables [3]. Multiple logistic regression
analysis was used in the multivariate analysis to identify the
independent risk factors for DES by computing Odds Ratios (ORs)
and their associated 95% CI. P values less than 0.05 were
considered statistically significant.
Results
A total of 300 responses were collected through both online
and offline survey. The responses comprised of 87 (29%) males
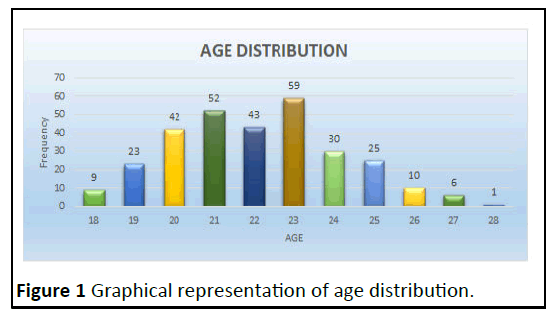
and 213 (71%) females. The age ranges from 18-28 years and the
mean age of the individual was found to be 22.10 ± 2.10 years
(Range-10) with the majority of the individuals from the age
group of 23 years (n=59) (Figure 1).

Figure 1: Graphical representation of age distribution.
Out of the total 300 subjects included, following are the age
distribution: 18 years (n=9, 3%), 19 years (n=23, 7.7%), 20 years
(n=42, 14%), 21 years (n=52, 17.3%), 22 years (n=43, 14.3%), 23
years (n=59, 19.7%), 24 years (n=30, 10%), 25 years (n=8.3%), 26
years (n=10, 3.3%), 27 years (n=6, 2%) and 28 years (n=1, 0.3%)
(Figure 1 and Table 1) [4].
| Demography |
Numbers (%) |
| Mean age (years) ± SD |
22.10 ± 2.10 (Range 10) |
| Male: Female |
87: 213 |
| Online class attended |
278 (96%) |
| Device used for online classes |
| Laptop |
44 (14.7%) |
| Desktop |
87 (29%) |
| Smartphone |
160 (53.3) |
| Tablet |
9 (3%) |
| Duration of online classes |
| <1 hour |
27 (9%) |
| 1-2 hour |
61 (20.3%) |
| 3-4 hour |
130 (43.3%) |
| >4 hour |
82 (27.3%) |
| Distance of digital device from eyes during online classes (n=300) |
| 10-18 inches |
69 (23%) |
| 18-20 inches |
104 (34.7%) |
| 21-25 inches |
89 (29.7%) |
| >25 inches |
38 (12.7%) |
| Duration of digital devise usage (pre‑COVID era) |
| 1 hour |
46 (15.3%) |
| 2 hour |
72 (24%) |
| 3 hour |
79 (26.3%) |
| >3 hour |
103 (34.3%) |
| Duration of digital devise usage (COVID era) |
| 1 hour |
15 (5%) |
| 2 hour |
58 (19.3%) |
| 3 hour |
74 (24.7%) |
| >3 hour |
153 (51%) |
Table 1. Demographic characteristics and details of digital device usage.
Frequency and severity of DES
The most common symptoms associated with DES in our
study were itching (n=241, 80.3%), watering/tearing (n=234, 78%) and difficulty focusing near (n=234, 78%). Dryness (n=161,
53.7%) and excessive blinking (n=165, 55%) were the least
common presenting symptoms.
Burning sensation in the eyes
Out of 300 respondents, the result was: Never (n=79, 26.3%),
occasionally of moderate intensity (n=150, 50%), occasionally of
severe intensity (n=53, 17.7%), always of moderate intensity
(n=17, 5.7%) and always of severe intensity (n=1, 0.3%).
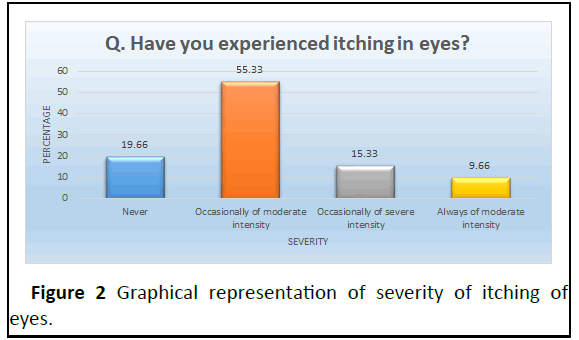
Itching in the eyes
Out of 300 respondents, the result was: Never (n=59, 19.7%),
occasionally of moderate intensity (n=166, 55.3%), occasionally
of severe intensity (n=46, 15.3%) and always of moderate
intensity (n=29, 9.7%) (Figure 2).

Figure 2: Graphical representation of severity of itching of
eyes.
Foreign body sensation in the eyes: Out of 300 respondents,
the result was: Never (n=106, 35.3%), occasionally of moderate
intensity (n=138, 46%), occasionally of severe intensity (n=40,
13.3%) and always of moderate intensity (n=15, 5%).
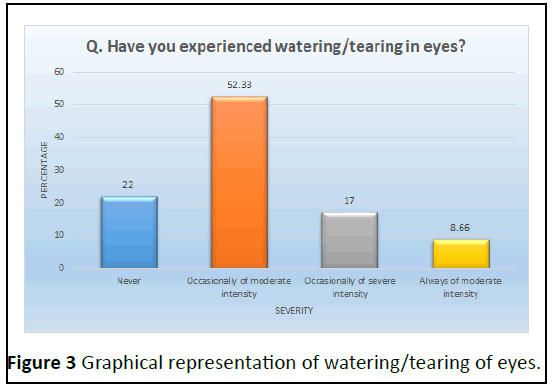
Watering/tearing in the eyes
Out of 300 respondents, the result was: Never (n=66, 22%),
occasionally of moderate intensity (n=157, 52.3%), occasionally
of severe intensity (n=51, 17%) and always of moderate intensity
(n=26, 8.7%) (Figure 3).

Figure 3: Graphical representation of watering/tearing of eyes.
Excessive blinking of eyes
Out of 300 respondents, the result was: Never (n=135,45%),
occasionally of moderate intensity (n=117, 39%), occasionally of
severe intensity (n=32, 10.7%), always of moderate intensity
(n=14, 4.7%) and always of severe intensity (n=1, 0.3%).
Redness in eyes
Out of 300 respondents, the result was: Never (n=102, 34%),
occasionally of moderate intensity (n=134, 44.7%), occasionally
of severe intensity (n=49, 16.3%), always of moderate intensity
(n=11, 3.7%) and always of severe intensity (n=2, 0.7%) [5].
Pain in eyes
Out of 300 respondents, the result was: Never (n=98, 32.7%),
occasionally of moderate intensity (n=138, 46%), occasionally of
severe intensity (n=45, 15%), always of moderate intensity
(n=18, 6%) and always of severe intensity (n=1, 0.3%).
Heaviness in eyelids
Out of 300 respondents, the result was: Never (n=112,
37.3%), occasionally of moderate intensity (n=127, 42.3%),
occasionally of severe intensity (n=45, 15%) and always of
moderate intensity (n=16, 5.3%).
Dryness in eye
Out of 300 respondents, the result was: Never (n=139,
46.3%), occasionally of moderate intensity (n=102, 34%),
occasionally of severe intensity (n=45, 15%) and always of
moderate intensity (n=14, 4.7%).
Blurring of vision
Out of 300 respondents, the result was: Never (n=77, 25.7%),
occasionally of moderate intensity (n=141, 47%), occasionally of
severe intensity (n=46, 15.3%), always of moderate intensity
(n=30, 10%) and always of moderate intensity (n=6, 2%).
Increased sensitivity to light
Out of 300 respondents, the result was: Never (n=80, 26.7%),
occasionally of moderate intensity (n=139, 46.3%), occasionally
of severe intensity (n=55, 18.3%), always of moderate intensity
(n=21, 7%) and always of severe intensity (n=5, 1.7%) [6].
Worsening of eye sight
Out of 300 respondents, the result was: Never (n=72, 24%),
occasionally of moderate intensity (n=129, 43%), occasionally of
severe intensity (n=60, 20%), always of moderate intensity
(n=25, 8.3%) and always of severe intensity (n=14, 4.7%).
Headache
Out of 300 respondents, the result was: Never (n=77, 25.7%),
occasionally of moderate intensity (n=141, 47%), occasionally of
severe intensity (n=46, 15.3%), always of moderate intensity
(n=30, 10%) and always of severe intensity (n=6, 2%).
Halos around objects
Out of 300 respondents, the result was: Never (n=102, 34%),
occasionally of moderate intensity (n=136, 45.3%), occasionally
of severe intensity (n=49, 16.3%), always of moderate intensity
(n=11, 3.7%) and always of severe intensity (n=2, 0.7%).
Difficulty focusing near
Out of 300 respondents, the result was: Never (n=66, 22%),
occasionally of moderate intensity (n=157, 52.3%), occasionally
of severe intensity (n=51, 17%) and always of moderate intensity
(n=26, 8.7%).
Double vision
Out of 300 respondents, the result was: Never (n=81, 27%),
occasionally of moderate intensity (n=140, 46.7%), occasionally
of severe intensity (n=53, 17.7%), always of moderate intensity
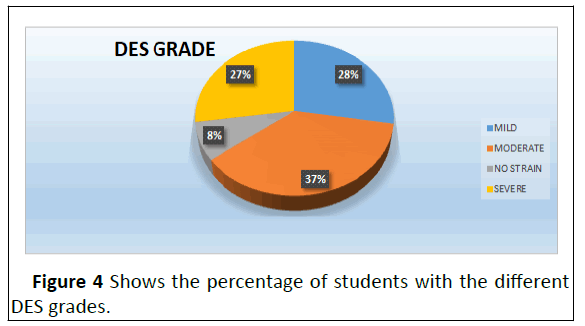
(n=21, 7%) and always of severe intensity (n=5, 1.7%). The
prevalence of DES in the cohort was 92% (276/300). Of these,
27.7% were of mild grade (n=83), 37% of moderate grade
(n=111) and 27.3% of severe grade (n=82) DES scores.
DES was significantly associated with female gender
(P<0.0001, odds ratio-1.56), smartphone use (P=0.02, odds
ratio-1.91), duration of online classes >4 hour (P<0.0003, odds
ratio-3.42) and digital device distance 18-20 inches (P=0.07,
odds ratio-1.71) in univariate analysis (Figure 4).

Figure 4: Shows the percentage of students with the different
DES grades.
As shown in Table 2 the multivariate analysis revealed that
age 21 years (P=0.05), female gender (P=0.0005), smartphone
preference over other digital devices (P=0.004), and duration of
online classes 3-4 h (P=0.008), were independent risk factors for
DES in the student.
| Risk factor |
OR |
95% CI |
P |
| Age 21 years |
2.23 |
1.0-4.7 |
0.05 |
| Female gender |
4.5 |
2.1-9.6 |
0.0005 |
| Smartphone preference |
3.6 |
1.5-7.2 |
0.004 |
| Digital device used |
3.8 |
1.8-7.5 |
0.008 |
| Distance of screen from eyes |
0.9 |
0.5-1.9 |
0.71 |
Table 2. Multivariate logistic regression analysis of risk factors associated with digital eye strain.
Discussion
Due to the widespread COVID-19 pandemic, various state/
central governments took the drastic step of closing down
various sectors of the country, including educational institutions,
office workplaces and markets, in order to halt the virus's
transmission, which has harmed the education of billions of
schoolchildren and youths worldwide.
Closure of educational facilities shields kids from COVID-19,
but it has a negative impact on their education. To avoid this,
educational institutions around the world are transitioning from
the traditional in-person class to the online teaching-e-learning
method [7-9]. During the COVID-19 epidemic, digital learning
has become a daily requirement, resulting in a significant
increase in digital device use among pupils. In our analysis, 96%
of the students took online classes. According to a European
research, 68% of children used computers on a regular basis and
54% engaged in online activities.
The average time spent in front of digital devices in our study
was 3.220.98 (range 3) h, which is comparable to a study done in
the UK, in which the participant spent approximately 4 h per day
on digital devices. According to a study conducted in rural
western India, the average time spent in front of a screen among
youngsters was roughly, 2.7 h, 1.7 h which is smaller than our cohort. In our study, 36.9% of children spent more than 5 hours
on digital devices, which is comparable to the pattern observed
by Badri, et al., who found that students spent an average of 5.2
hours per day on digital devices [10-12].
Portello, et al. classified DES symptoms into two categories:
Those associated to accommodation (blurred vision for close
objects, headache and eyestrain) and those related to dryness
(burning sensation, foreign body sensation, itching, wetness,
sensitivity to light). We also examined the DES symptoms with
the help of a validated questionnaire produced by Segu, et al.
The self-administered CVS Q asks individuals to rate the severity
and frequency of 16 symptoms they experienced while using a
digital device, with a total score of six or above deemed
diagnostic of DES. The CVS Q is a questionnaire that has been
pretested, verified and validated for the diagnosis of DES. Itching
(80.3% of instances), watering/tearing, and difficulty focusing
near (78% of cases) were the most common symptoms reported
in our study. The current study's multivariate analysis
demonstrated that age 21 years, female sex, smartphone
preference over other digital devices and duration of online
classes 3-4 h were independent risk factors for DES in students
[13-15]. In our analysis, the female sex appeared to be at higher
risk (P 0.0001, odds ratio 1.56), which is consistent with Shima, et al 11's finding that visual symptom scores in digital device
users were higher in females than males.
There were some limitations to the study. The study cannot
define the DES status of a specific region due to a smaller
sample size and the study being conducted in a tiny part of the
region. Furthermore, the study was based on a symptom-based
questionnaire, which requires respondents to describe the
frequency and intensity of symptoms experienced while using
digital devices, which is a subjective sense that differs from
person to person and may be vulnerable to recall bias].
Conclusion
The study emphasises the higher prevalence of Digital Eye
Strain (DES) among students today compared to before the
COVID-19 pandemic, as well as the effect of the e learning
teaching style on students' ocular health. The report also
emphasises a critical student ocular health issue in this era and
encourages parents, teachers, and eye care providers to pursue
evidence-based methods to avoid DES.
References
- Coles‐Brennan C, Sulley A, Young G (2019) Management of digital eye strain. Clin Exp Optom 102: 18-29.
[Crossref] [Google Scholar] [PubMed]
- del Mar Segui M, Cabrero-Garcia J, Crespo, Jose V, Elena R (2015) A reliable and valid questionnaire was developed to measure computer vision syndrome at the workplace. J Clin Epidemiol 68: 662-673.
[Crossref] [Google Scholar] [PubMed]
- Pellegrini M, Bernabei F, Scorcia V, Giuseppe G (2020) May home confinement during the COVID-19 outbreak worsen the global burden of myopia? Graefes Arch Clin Exp Ophthalmol 258: 2069-2070.
[Crossref] [Google Scholar] [PubMed]
- Wang G, Zhang Y, Zhao J, Zhang J, Jiang F (2020) Mitigate the effects of home confinement on children during the COVID-19 outbreak. The Lancet 395: 945-947.
[Crossref] [Google Scholar] [PubMed]
- Palaiologou I (2016) Children under five and digital technologies: Implications for early years pedagogy. Eur Early Child Educ Res J 24: 5-24.
[Crossref] [Google Scholar]
- Shah RR, Fahey NM, Soni AV, Phatak AG, Nimbalkar SM (2019) Screen time usage among preschoolers aged 2-6 in rural Western India: A cross-sectional study. J Fam Med Prim Care 8: 1999.
[Crossref] [Goolge Scholar] [PubMed]
- Badri M, Alnuaimi A, Al Rashedi A, Yang G, Temash K (2017) School children’s use of digital devices, social media and parental knowledge and involvement-the case of Abu Dhabi. Educ Inf Technol 22: 2645-2664.
[Google Scholar]
- Portello JK, Rosenfield M, Bababekova Y, Estrada JM, Leon A (2012) Computer‐related visual symptoms in office workers. Ophthal Physiol Opt 32: 375-382.
[Crossref] [Google Scholar] [PubMed]
- Shima M, Nitta Y, Iwasaki A, Adachi M (1993) Investigation of subjective symptoms among visual display terminal users and their affecting factors analysis using log-linear models. Jpn J Hyg 47: 1032-1040.
[Crossref] [Google Scholar] [PubMed]
- Shimai S, Iwasaki S, Takahashi M, Narita S, Suzuki H (1986) Survey on subjective symptoms in VDT workers: Complaint rate and years of service. Sangyo igaku. Jpn J Indus Health 28: 87-95.
[Crossref] [Google Scholar] [PubMed]
- Ye Z, Honda S, Abe Y, Kusano Y, Takamura N, et al (2007) Influence of work duration or physical symptoms on mental health among Japanese visual display terminal users. Ind Health 45: 328-333.
[Crossref] [Google Scholar] [PubMed]
- Yamamoto S (1987) Visual, musculoskeletal and neuropsychological health complaints of workers using videodisplay terminal and an occupational health guideline. Jpn J Ophthalmol 31: 171-183.
[Google Scholar] [PubMed]
- Ye Z, Abe Y, Kusano Y, Takamura N, Eida K (2007) The influence of visual display terminal use on the physical and mental conditions of administrative staff in Japan. J Physiol Anthropol 26: 69-73.
[Crossref] [Google Scholar] [PubMed]
- Park KY, Bak KJ, Lee JG, Lee YS, Roh JH (1997) Factors affecting the complaints of subjective symptoms in VDT operators. Korean J Occup Environ Med 9: 156-169.
[Crossref] [Google Scholar]
- Knave BG, Wibom RI, Voss M, Bergqvist UO, Hedstrom LD (1985) Work with video display terminals among office employees: I. Subjective symptoms and discomfort. Scand J Work Environ Health 11: 457-466.
[Crossref] [Google Scholar] [PubMed]
Citation: Hussain NS, Jamir M (2023) Prevalence and Severity of Digital Eye Strain (DES) During the COVID-19 Pandemic Period amongst the
University-Going Students of Jorhat, Assam: A Cross-Sectional Study. Health Sci J. Vol. 17 No. 8: 1054.


