Keywords
Service quality; SERVQUAL methodology; Profile analysis
Introduction
The World Health Organisation’s (WHO) framework for action [1,2] placed healthcare quality on the agenda of most health care systems, including those in developing countries such as Ghana. Conway and Clancy [3] explain that much of the interest in the quality of healthcare has been a result of the transformation in health care systems across the globe Quality Mosadeghrad [4] defined healthcare as “the consistent delighting of patients by providing efficacious, effective and efficient healthcare services according to clinical guidelines and standards that meet the patient’s needs and satisfies the providers”. The above definition emphasises the role of the patient in the determination of health care quality. However, due to personal preferences and ambiguity in definitions, it is difficult (if not impossible) to assess the real quality of healthcare from the patients’ point of view. This thought is confirmed by Mainz [5] when he concludes that monitoring health care quality is impossible without the use of clinical indicators, and that, indicators create the basis for quality improvement and prioritization in the health care system. Mainz [5] further explains that it is imperative to ensure that reliable and valid clinical indicators are adopted in assessing healthcare quality and these indicators ought to be designed, defined, and implemented with scientific rigour. However, the patient’s perception on the quality of healthcare received is the closest measure of the real quality of care received by the patient.
Lohr [6] defined quality of care as the degree to which health services for individuals and populations increase the likelihood of desired health outcomes and are consistent with current professional knowledge. Donabedian [7] states that the quality of care can be divided into different dimensions according to the aspects of care being assessed. Patient satisfaction is one of such dimensions. Mandan and Goel [8] explain satisfaction as the state of pleasure or contentment with an action, event, or service and it is determined considerably by the expectations of the customer and his experience. Therefore, the interaction between patients and healthcare providers is essential to patient’s satisfaction. While on one hand the patient is able to assess and evaluate service quality, it offers the healthcare provider an opportunity to manage patient’s perception of service quality on the other hand. From a focus group discussion, Jun et al [9] identified eleven dimensions as appropriate for assessing service quality in healthcare settings. The dimensions were named as "courtesy", "tangibles", "reliability", "communication", "competence", "reliability", "understanding customer", "access" "patient outcomes" "responsiveness", "caring", and "collaboration". These eleven attributes capture the five attributes of service satisfaction according to Parasuraman et al. [10] which states that regardless of the type of service, consumers basically use the same criteria to assess quality and these qualities are Reliability, Tangibility, Responsibility, Assurance and Empathy. The existing methodology only measures the client or customer’s perception and assessment of the service. It does not give an explanation or reasons for the client’s expectations or perceptions.
The SERVQUAL methodology has been applied in various research fields. Zhang et al. [11] applied the SERVQUAL methodology to evaluate service quality of the car rental industry in China. Lupo [12] applied a SERVQUAl based method for reliable measurements of education quality for higher education in Italy. Athanassopoulos [13] also explored the use of the SERVQUAL methodology in assessing service quality and operations efficiency synergies for management control in the financial services industry of Greece. A recent contribution on the use of SERVQUAL in health service quality was by Lupo [14], where he develops a framework to evaluate health service quality through an empirical study in Sicily. Refer to [15,16] for an application of the SERVQUAL methodology in the transportation and hotel services industry respectively.
This study seeks to measure service quality in the manner Parasuraman et al. [10] but with the inclusion of some demographic and socioeconomic variables on the SERVQUAL questionnaire to identify some factors that influence the gap (i.e the difference between perception and expectation) while explaining why perceptions are different for various categories of clients.
The proposed methodology is applied to data from the University of Ghana, Legon Hospital. As a university hospital, it is perceived that such a hospital has good facilities, the best of doctors and it is convenient for those who live in the catchment area of the university. Also it is expected that healthcare services provided at the Legon hospital should be above the country average which is quite abysmal [17]. With these high expectations from patients, it is necessary for service quality to be assessed based on patient satisfaction in order to improve on the best practices of the hospital and take remedial measures to meet patient expectations. The quality of service provided at the Legon Hospital is analysed to find relationships between demographic characteristics and service quality.
Materials and Methods
Sample size and sampling technique
The target population for this study is all patients (both inpatients and out patients) at the University hospital. In the absence of an existing sampling frame, and in order to reduce sampling bias, an every 7th- systematic random sampling technique is used to collect the data. Patients with terminal health conditions were excluded to avoid biases in opinions owing to their unique experiences and conditions. To determine an appropriate sample size, we adopt the margin of error formula for sample size determination by Weiss [18]. The choice of an appropriate sample size is on a number of factors. Cochran [19] explains that the selection of an appropriate sample size is dependent on the population parameters that ought to be estimated, the cost of sampling, the variability within the population and the required level of precision. In the context of this research, the various proportion of patients’ perceptions on health for the various categories under the SERVQUAl is of interest. Since data was collected from only one location, the cost of sampling is constant for each member of the sample. The variability or spread in the data is another factor to consider. Since this is a baseline study the variability is not known. However, the maximum variability possible for a proportion estimate is chosen. When the proportion is chosen as 0.5 (exactly half), then the variability can be estimated to as σ = 0.5*0.5. Lastly, the required level of precision ought to be determined before sampling. The sample size required for a (1-α) level confidence interval with a specified margin of error, is given by the formula;

Selecting the margin of error to be 0.05 for proportion estimates and hence a 95 percent confidence for our findings. The computation of the minimum required sample size is shown below;
However, we choose a sample size of 100.
The SERVQUAL questionnaire
Gronroos [20] developed the first model to measure service quality. He identified technical quality as concerned with what is delivered functional quality as the process of service delivery and image quality which is identified as corporate image of company. The technical quality component of products unlike services is easy to assess because they are concerned with tangibility such as physical features that are visible to the consumer.
Parasuraman et al. [10], developed a model of service quality based on studies in four service settings, namely; retail banking, credit card services, repair and maintenance of electrical appliances, and long-distance telephone services. The SERVQUAL model represents service quality as the discrepancy between a customer’s expectations of service offering and the customer’s perceptions of the service received Parasuraman et al. [21].
Parasuraman et al. [10] proposes a model which strives to measure the consumer perception of the service quality which depends on the size of the gap between expected service and perceived service and it is dependent on the gaps under the control of the service provider.
In the manner of Parasuraman et al. [10], this research makes use of a SERVQUAL questionnaire in data collection. The first part captures some demographic information such as the patient’s age, gender, level of education, admission status and whether or not the patient is insured. This modified section of the questionnaire aids in building profiles to differentiate perception of the respondents.
For each dimension of service quality, SERVQUAL measures both the expectation and perception of the service on a scale of 1 to 5, 22 questions in total. The score for each of the 22 Perception statements is obtained from the sampled client. Calculate the Gap Score for each of the statements where the Gap Score = Perception – Expectation.
An average Gap Score for each dimension of service quality is obtained by assessing the Gap Scores for each of the statements that constitute the dimension and dividing the sum by the number of statements making up the dimension. The sum of the averages calculated above is then divided by 5 to obtain an average SERVQUAL score. This is the unweighted measure of service quality for the area being measured. A negative Gap score indicates that the actual service (the Perceived score) was less than what was expected (the Expectation score). Where weights are attached to the dimensions of service quality, a weighted score, calculated based on the importance weights for each of the five dimensions is used.
The Gap score is a reliable indication of each of the five dimensions of service quality. Using SERVQUAL, service providers can obtain an indication of the level of quality of their service provision, and highlight areas requiring improvement. By the use profile analysis.
Profile analysis
Profile analysis is the multivariate equivalent of repeated measures or mixed ANOVA. Profile analysis is most commonly used in two cases:
a.Comparing the same dependent variables between groups over several time-points.
b. When there are several measures of the same dependent variable.
If y is a response variable of the form Np(μ,ε) measured in the same units and with approximately equal variances we may wish to compare the means in μ1, μ2, …, μp. This might be of interest when measurements are taken on the same research unit p. Such situations are often referred to as repeated measures designs. The pattern obtained by plotting μ1, μ2, …, μp as ordinates and connecting the points is called a profile; we usually draw straight lines connecting the points (1,μ1), (2,μ2), …, (p,μp). Johnson and Wichern [22] define Profile analysis as an analysis of the profile or a comparison of two or more profiles.
Profile analysis pertains to situations in which tests or questions are administered to two or more groups of subjects. All responses must be expressed in similar units. Further, it is assumed that the responses for the different groups are independent of one another.
Profile analysis asks three basic questions about the data plots:
a. Are the groups parallel between time points or observations?
b. Are the groups at equal levels across time points or observations?
c. Do the profiles exhibit flatness across time points or observations? If the answer to any of these questions is no then there is a significant effect. The type of effect depends on which of these null hypotheses is rejected.
The major assumptions
1. Multivariate normal
2. Homogeneity of variance-covariance matrix
3. Linearity
4. Profiles can be constructed for each population (group).
Let μ1=[μ11,μ12,μ13,…,μ1p] and μ2=[μ21,μ22,μ23,…,μ2p] be the mean responses to treatments for the populations under study.
Equal profiles
The test is basically asking does one group score higher on average across all measures. The grand mean of all measures is calculated for each group. Since all of the time points or scores are collapsed into a group mean, this a univariate test.
Flatness of profiles
Flatness and parallelism are both multivariate tests which compare the multiple segments of the profile. A segment in this context is simply the difference in the response between dependent variables. Therefore, the segment is equivalent to the slope of the line between two points on the x-axis.
This is evaluated independently for each group, making this a within-subjects test. If the line is not flat (any of the segments vary significantly from 0 then there is a within groups main effect of time-point, dependent variable, measure, etc. MANOVA is used to test the difference of the zero-matrix and the segmented data for each group.
Parallel profiles
Parallelism is usually the main test of interest in profile analysis. The test for parallelism asks whether each segment is the same across all groups.
If the profiles are parallel, a test for flatness is performed. If the profiles are flat, a test of equality of the profiles is performed.
Hypothesis
a. Test for Parallel Profiles H0: cμ1 = cμ1 vs Hα: cμ1≠ cμ2
b. Test for coincident/ flatness of profiles given that the profiles are parallel. H0: jμ1 = jμ2 vs Hα: jμ1 ≠ jμ2
c. Test for level/ equal profiles given that the profiles are coincident H0: cμ = 0 vs H0: cμ ≠ 0
Data analysis and results
Over a two week period, 100 questionnaires were administered to patrons of the Legon Hospital. Accounting for non-responses and missing values, responses from 92 respondents was used for the analysis. 54.3 percent of the sample was males while the other 45.7% were females. The average age of the respondents is 33.85 years with a standard deviation of 13.19 years. The minimum age is 17years and the maximum age is 61years. 71 representing about 77.2% of the sample were out-patients whilst about 21 representing 22.8% were in-patients. This is typical of hospitals in Ghana and hence the results are a true representation of hospital attendance in Ghana [17]. 49 representing about 53.3% of the respondents were insured while the other 46.7% were uninsured. Those with some tertiary education are dominant with 64 respondents, followed by 19 with some High school Education. 7 respondents had received some Basic Education with 2 unspecified. Their profession ranges from lecturers, students, business men, caterers, security men etc.
SERVQUAL
Table 1 shows the results from the SERVQUAL Methodology. Results from the table show that empathy is the most significant dimension of quality to the patient. However, empathy offered at the Legon hospital has the lowest ratings (-25). Tangibles received the highest ratings (although negative) when the five dimensions are compared.
Table 1: Results from the SERVQUAL methodology.
| Dimension |
Statement |
Expectation Score |
Perception Score |
Gap Score |
Average for Dimension |
| Tangibles |
1 |
145 |
126 |
-19 |
-10.25 |
| |
2 |
144 |
132 |
-12 |
|
| |
3 |
162 |
157 |
-5 |
|
| |
4 |
132 |
127 |
-5 |
|
| Reliability |
5 |
142 |
106 |
-36 |
-21.2 |
| |
6 |
155 |
128 |
-27 |
|
| |
7 |
141 |
129 |
-12 |
|
| |
8 |
131 |
120 |
-11 |
|
| |
9 |
147 |
127 |
-20 |
|
| Responsiveness |
10 |
145 |
124 |
-21 |
-14.75 |
| |
11 |
138 |
125 |
-13 |
|
| |
12 |
145 |
122 |
-23 |
|
| |
13 |
141 |
139 |
-2 |
|
| Assurance |
14 |
139 |
128 |
-11 |
-11 |
| |
15 |
138 |
131 |
-7 |
|
| |
16 |
139 |
125 |
-14 |
|
| |
17 |
153 |
141 |
-12 |
|
| Empathy |
18 |
146 |
123 |
-23 |
-25 |
| |
19 |
135 |
121 |
-14 |
|
| |
20 |
139 |
119 |
-20 |
|
| |
21 |
142 |
106 |
-36 |
|
| |
22 |
142 |
110 |
-32 |
|
| Unweighted Average SERVQUAL score: |
|
|
-16.44 |
Profile analysis
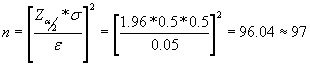
To ascertain the characteristics of the patients that influenced the gap between their perceptions and expectations, we take a look at some profiles of the patients. It was hypothesised that the gender of the patient influenced the gap and therefore service quality. Figure 1 is the profile plot of service quality (Gap) based on the gender of respondents. From the plot, the between groups test (p-value = 0.17) indicates that gender is not significant. Accordingly from the graph, the lines for the two groups (males and females) are not far apart. The within subject test (p-value = 0.62) indicates that there is not a significant effect as a result of the various dimensions of service quality. Therefore perception of both genders does not change over the dimensions of service quality. From the graph, the lines of males and females are not flat. Also, since the lines are not parallel, there seem to be an interaction. Although the dimensions of service quality are significant, there is no difference in the perceptions of males and females based on the five dimensions of service quality.
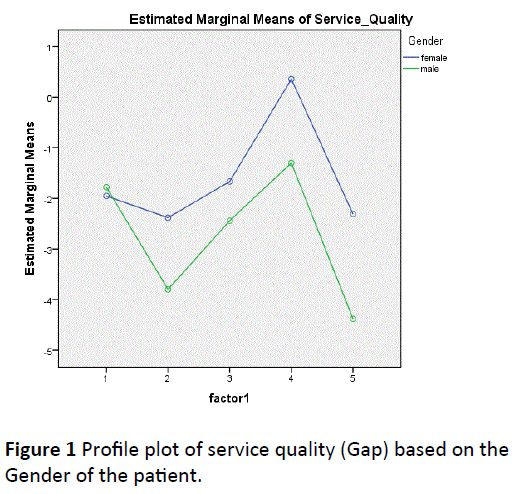
Figure 1: Profile plot of service quality (Gap) based on the Gender of the patient.
The influence of the patient’s admission status on the Gap was investigated. The profile plot of service quality (Gap) based on admission status of the patient is shown in Figure 2. The between groups test (p-value =0.596) indicates that the admission status of the patient is not significant. Accordingly from the graph, the lines for the two groups (in-patient and out-patient) are not far apart. The within subject test (pvalue= 0.201) indicates that there is not a significant effect as a result of the various dimensions of service quality. Therefore perception of both sets of patients does not change over the dimensions of service quality. From the graph, the lines of males and females are not flat. Also, since the lines are not parallel, there seem to be an interaction. Although the dimensions of service quality are significant, the perceptions of males and females not different in terms of the five dimensions of service quality.
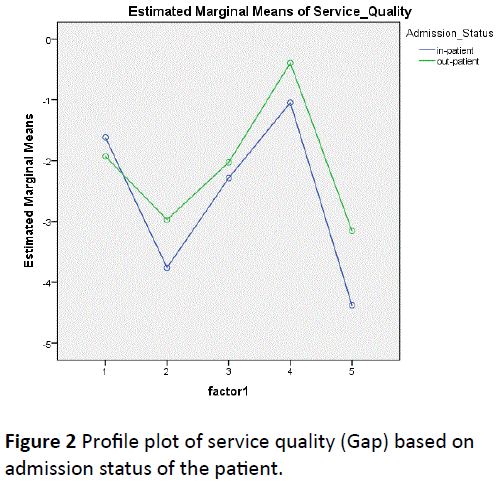
Figure 2: Profile plot of service quality (Gap) based on admission status of the patient.
It was hypothesised that, whether or not a patient has insurance influences the gap and therefore service quality. The profile plot of service quality (Gap) based on whether or not the patient is insured is displayed in Figure 3. The between groups test (p-value = 0.034) indicates that the insurance status of the patient is significant. From the plot, the lines for the two groups are far apart. The within subject test indicate that there is a significant dimension of service quality effect. In other words, the perceptions of the insured and un-insured do change over the five dimensions of service quality. Moreover, the interaction of time and group is not significant which means that the groups are not changing over the five dimensions of service quality. From the plot the lines are parallel. We conclude that the hypothesis of parallel profiles for insured and uninsured patients is tenable.
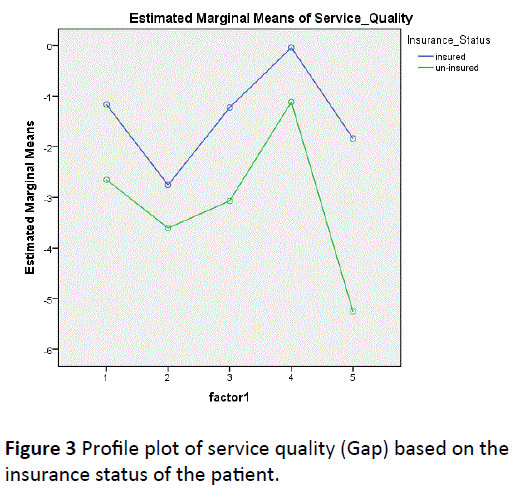
Figure 3: Profile plot of service quality (Gap) based on the insurance status of the patient.
Due to the significant difference in the service quality (gap) between the insured and un-insured, an independent t-test is performed for the two categories of patients to ascertain which dimensions of service quality were significantly different. A summary of the t-test results is shown in Table 2. From Table 2, Empathy is the only dimension of service quality that shows a significant difference between the insured and un-insured.
Table 2: Table of t-Test results to compare the GAP in service quality based on Insurance Status of Patients.
| Independent t-Test for Insured and Un-insured patients |
| Service Quality |
t |
p-value |
| Tangibility |
1.45 |
0.151 |
| Reliability |
0.63 |
0.53 |
| Assistance |
1.4 |
0.165 |
| Safety |
0.92 |
0.362 |
| Empathy |
2.43 |
0.017 |
Discussion and Conclusion
The methodology suggests another procedure that can be adopted in assessing service quality in any industry. The ability of the procedure to get the same results as that of the SERVQUAL with an added advantage of identifying some attributes that significantly influences the expectations and perceptions (Gap) of a service is worthy of note.
The application of the method to asses healthcare quality at the Legon Hospital showed that Empathy was the most significant dimension of service quality for a Ghanaian health setting and it is strongly influenced by whether or not the patient has health insurance or not. The insured also consistently report lower gaps between their expectations and perceptions than their un-insured counterparts and all five dimensions of service quality. Although gender was not significant in explaining the gap, with the exception of tangibility where the average gap of males and females were similar, females consistently reported smaller gaps for all the other four dimensions of quality. There is however no difference in the gaps based on the admission status of the patient.
The findings of this paper is similar to that of Lupo [14] in the sense that Responsiveness and Reliability were considered as the dimensions of health service quality that needed improvement. These two factors are only second to empathy from this research.
In terms of business and marketing strategy, health care administrators and providers should focus on improving empathy shown to patients while bridging the gap between the insured and uninsured on all the other five dimensions especially on reliability which was a near second to empathy. Although results may be at variance in terms of importance of the dimensions of service quality with Sachdev and Verma [23] where they conclude that all the service quality dimensions are equally important, this paper clearly demonstrates that a profile analysis is efficient in determining factors that significantly influences a patients assessment of service quality.
These results are limited in that; they are based on the assumption that the patients surveyed in the survey period are representative of the total population of patrons of the hospital. Since insurance coverage is a significant factor in determining patient’s satisfaction, it leaves room for further research in establishing the real difference in treatment that is driving this disparity in service satisfaction between the insured and un-insured.
9489
References
- Asadi-Lari M, Tamburini M, Gray D (2004) Patients' needs, satisfaction, and health related quality of life: towards a comprehensive model. Health Qual Life Outcomes 2: 32.
- World Health Organization (2007) Everybody business: strengthening health systems to improve health outcomes: WHO’s framework for action. Geneva, Switzerland.
- Conway PH, Clancy C (2009) Transformation of health care at the front line. JAMA 301: 763-765.
- Mosadeghrad AM (2013) Healthcare service quality: towards a broad definition. Int J Health Care QualAssur 26: 203-219.
- Mainz J (2003) Defining and classifying clinical indicators for quality improvement. Int J Qual Health Care 15: 523-530.
- Lohr KN (1991) A Strategy for Quality Assurance. Washington, DC : National Academy Press.
- Madan M, Goel N (2015) An Empirical study on Assessing Quality of Health care Services offered by private Hospitals Using Servqual model. XVI Annual Conference Proceedings.
- Jun M, Yang Z, Kim D (2004) Customers’ perceptions of online retailing service quality and their satisfaction. IJQRM 21: 8.
- Parasuraman A, Zeithaml VA, Berry LA (1985) Conceptual Model of Service Quality and Its Implications for Future Research. J Market 49: 41-50.
- Zhang M, Xie Y, Huang L, He Z (2014) Service Quality Evaluation of Car Rental Industry in China, IJQRM. 31: 82-102
- Lupo T (2013) A fuzzy ServQual based method for reliable measurements of education quality in Italian higher education area. Expert SystAppl 40: 7096-7110.
- Athanassopoulos AD (1997) Service quality and operating efficiency synergies for management control in the provision of financial services: Evidence from Greek bank branches. Eur J Oper Res 98: 300-313.
- Lupo T (2016) A fuzzy framework to evaluate service quality in the healthcare industry: an empirical case of public hospital service evaluation in Sicily. Appl Soft Comput 40: 468-478.
- Lupo T (2013) Handling stakeholder uncertain judgments in strategic transport service analyses. Transport Policy 29: 54-63.
- Carrasco RA, Villar P, Hornos M, Herrera-Viedma E (2012) A linguistic multi-criteria decision making model applied to hotel service quality evaluation from web data sources. Int J IntellSyst 27: 704-731.
- Ghana Statistical Service (GSS), Ghana Health Service (GHS), ICF Macro (2009) Ghana Demographic and Health Survey (GDHS) 2008 Report. Accra: GSS, GHS, ICF Macro.
- Weiss AN (2005) Elementary Statistics, 6th Edition ed. USA: Pearson Education Inc, New York, USA.
- Cochran GW (1977) Sampling Techniques, 3rd Edition. John Wiley & Sons. New York, United States.
- Gronroos C (1982) A service quality model and its marketing implications. Eur J Mark 18: 36-44.
- Parasuraman A, Zeithaml VA, Berry L (1988) SERVQUAL: A multiple-item scale for measuring consumer perceptions of service quality. J Retail 64: 12-37.
- Johnson RA, Wichern DW (2007) Applied Multivariate Statistical Analysis, 6th Edition ed. USA: Pearson Education Inc, New York, United States.
- Sachdev BS, Verma VH (2004) Relative Importance of Service Quality Dimensions: A Multi-Sectorial Study. J Serv Res 4: 93-116.

