Keywords
Boron; Obesity; Diabetes mellitus
Introduction
Obesity is a chronic disease arising from the excess amount of energy taken into the body via diet compared to the energy used by the body. Today obesity is not only an aesthetic problem, It affects all the organs and systems in the body especially the cardiovascular and endocrine system and it is now accepted as a sickness which causes various disorders and even morbidity [1]. Word Health Organization reports that today 1.6 billion people are overweight and each year at least 2.8 million people lose their lives because of overweight or obesity [2]. Since obesity has become a public health concern the struggle against obesity has become a global issue [3]. One of the most commonly used method in diagnosis of obesity is Body Mass Index (BMI) [4]. Although, frequency of obesity among women is higher than that among men due to the hormonal changes, which put extra weight during pregnancy, menopause and lactation periods [5]. Obesity causes development of Type II DM due to the effect of lypotoxicity, lypolytic response and free fatty acids.
DM is a chronic disease caused by absolute or relative disterbance in insulin level, that may be either due to defect in secretion or may be genetic or enviornemental factors. DM is a leading disorder that is characterized as hyperglycemia polyphagia, polydypsia, fatigue, weight loss and disorder in energy providing biological metabolite disorders. The number of patients with DM only in Turkey was determined to be 7 million in 2017 [6]. Ä°nsulin is secreated by β-cells of I-Lets of Lengerhens that play role in regulation of glucose metabolism. In 1985 WHO catagorized DM as Type 1, Type 2, gestational diabetes and other specific types like monogenic [7]. In case of insufficient insülin secretion or decrease in the effect of insulin results in disorders in the carbohydrate, lipid and protein metabolisms and extreme rise in the blood glucose level (hyperglycemia) and thereby caused DM to develop. According to WHO DM is diagnosed with blood glucose level ≥ 200 mg/dL independent of fasting and postprandial status [8]. However, in diagnosis of DM determining hemoglobin A1c (HbA1c) and insulin levels besides fasting glucose levels is also necessary. There is a strong relation between obesity and Type II DM (independent of insülin), and this is related with insülin resistance. Insulin bind with receptors and start a cascade of reaction inside the membrane to regulate glucose level , but in insulin resistent patient (Obese) [9] number of insulin receptor are few (cause hyperinsulinemia) as compare to healthy subject. Obese individuals have insülin resistance at varying degrees. This hinders insülin from performing its function [10]. In short the more the number of fat cells in an individual the lesser the insülin sensitivity would be and the body would need more insülin to maintain the body blood-glucose balance [11]. Obesity causes Type II DM develop due to lipotoxicity, lipolitic response and the effect of free fatty acids. Moreover, since obesity causes the body to become resistant to insülin in patients with diabetes this effect creates the necessity of more insülin intake in order for more sugar to enter the cells whereas in patients without DM the long lasting effects of insülin resistance causes them to become DM patients [12]. Lipids are organic biomolecule that play role as structural component of biological membrane, source of vitamin and energy as reserv in adipose tissue, function as hormone and anttoxicant etc. In the plasma, lipids exist as dissolved lipoprotein (lipid-protein complexes) particles which they form upon combining with special apoproteins [13]. All of these molecules are esters of long shain fatty acids. They constitute 95% of the fat tissue depots and they are the biggest part of the glycerol esters present in the plasma [14]. In plasma triglycerides are carried via VLDL mainly in the chilomicron but LDL and HDL are also present [15]. Cholesterol is the most widely found sterol in animals and they consist of 27 carbon atoms [16]. In the body most of the cholesterol is produced by the body mainly in the liver, small intestines, adrenal glands and genital organs besides in other tissues. In the body of a 70 kg person there is approximately 35 g cholesterol [17].
In the tissues and plasma lipoproteins exists as free cholesterol and in the ester cholesterol form [18]. Cholestrol is a precursor for the synthesis of bile acid necessory for fat digestion, vitamin D, various steroid hormone (aldosteron, testosteron, estrogen and progesteron) and necessory constituent for cell wall synthesis and maintaining its fluidity in wider temperature range [19,20]. Moreover, it was shown that cholesterol takes part in the synapses between nerve cells and in the functioning of immune system cells. As result of its effect on cell wall it also affects cell signal transmission and permeability of ions and protons [21]. Besides this, cholesterol is also found in the structure of lipoproteins which enable secretion of fats into the blood. According to their densities these lipoproteins are classified in 5 groups: chilomicron, very low density lipoprotein (VLDL), intermediate density lipoprotein (IDL), low density lipoprotein (LDL) and high density lipoprotein (HDL). When the LDL particles, which contains oxidized cholesterol, is high this LDL causes pile up on the periphers of veins which is called aterom. This situation is called aterosclerosis. On whichever organ vein these ateroms pile diseases related with this organ ocur. For example, if the aterom plaques pile up on the arteries feeding the heart (coronary arteries) coronoray diseases occur, if they pile up on the kidney veins hypertension and/or urinary diseases occur and if they pile up on the brain veins causes paralysis [22]. HDL particles and especially large size HDL can carry the cholesterol in the ateroms back to the liver. Therefore, high HDL values is related with recession of aterosclerosis. It was determined that the amount of cholesterol in the these lipoproteins and progression of aterosclerosis is found to be related with each other. Therefore, not the amount of total choleseterol but how much of this cholesterol is bound to what kind of lipoprotein is important [23].
Bone metabolism or restructuring or removal of old cells from the skeleton (bone resorption) formation of new bone cells (ossification or bone formation process) is a life-long process. In the adults remodelling/metabolism continues at 10% in adults. Like our other cells our bones are also alive and our bones, which consist of many different cells, proteins, veins, nerves and solid mineral matrix, control life processes and this is collectively called metabolism. Bone metabolism is regulated by some hormones and is affected by many factors. The function of bone is the development of skeleton that provide support, protection to internal organ, movement, as a source of blood cell production and storage of minerals. Bones are the places where hematopoiesis is made and that functions as a storage for Ca, Mg, P, Na and other ions which are necessary for the homeostatic functions serving body movements and protection of internal organs [24]. Living cell of bone are embeded in 25% organic compound in which 90 % is collegon, glucosamine glycoprotien, lipid, an peptides. While other 75% are inorganic molecule hydroxyapetite, Ca 36%, P 17%, Mg 0.8%, Na, K, Fe, B etc and 45% of water approximately. Vitamin D is necessary for sorption of calcium and bone formation and also use in the absorption of phosphorus in the the digestion system as well as for thyroid functions and for normal blood clotting. This vitamin is especially important for children’s growth.
Many of the studies have showed that Vitamin D is essential for healthy bone development, preventing many cancer types, autoimmune, cardiovascular and infectious dieseases [25]. Vitamin D defficiency is related with obesity and dibetes [26,27]. In case of its defiency bone mineralization is disturbed and rickets is observed in children at the ages of growth and in adults osteomalasia (softening of bones), at later ages osteoporosis is observed.
Boron is a dark Brown colored element widely found both in the hydrosphere and in the litosphere. In the environment it is mainly found as boric acid and borate salt While boron is an essential metalloid neccessary for plant functions and animals and human growth [28-30]. Boron, which affects, use of many substances related with life processes such as metabolism or energy substrates such as macrominerals, triglycerides and glucose, nitrogen containing substances such as aminoacids and proteins, reactive oxygen derivatives and estrogen when at physiological amounts, can have positive impact on many systems in the body such as brain, skeleton and immune system. Boron has an essential role in cell membrane functions or stability. Its response to hormone activity can affect transmembrane signal formation or transmembrane movement of regulatory cation and anions. Since boron is necessary or benefical for many life functions such as reproduction and embryogenesis, bone growth and protection, eye development or structure, psycomotor capabilities and cognitive functions, immune response and inflamation it is both a neutraceutical and an essential micronutrient [31,32]. Boron level is approximately the same in the soft tissues and in blood. However, since it is mainly stored in the bones it was observed that boron level in the bones is higher than that in fat and muscle as well as in the organ such as the heart, the liver and the intestines [33]. Boron affects carbohydrate metabolism. This effect is shown in the studies made with the chicken model. In this model it was shown that boron at physiological amounts taken via diet induced by Vitamin D deficiency boron increases plasma glucose concentration [30-34] and it affects insulin metabolism [34]. In case of biological disorder like insulin growth factor, boron has great importance that decreases the plasma insulin levl without affecting the gulocose concentration during boron suplimentation therapy. It indicates that boron decrease the amount of insulin required for maintance of plasma glucose level.
In studies made previously it was mentioned that in rats with Vitamin D deficiency hyperinsulinemia occur if accompanied by boron deficiency. This finding created the suspecion that in cases when nutrition with magnesium or Vitamin D is disturbed boron deficiency would require more insülin to maintain plasma glucose level. However, in a study made by N.A. Bakken et al. on rats it was shown that effect of boron taken via diet on plasma glucose level depends neither on magnesium nor on Vitamin D [34]. In other words, in this study no net relationship could be established between boron lowering plasma insülin concentration and Vitamin D and magnesium levels. Similar response of insülin in plasma to gestation with both boron and Vitamin D shows that both diet factors function independently in the same region in the insülin metabolism. However, it is thought that boron shows its effect through Vitamin D metabolite and boron increases efficiency of Vitamin D [35].
It was shown that plasma magnesium level is inversely related with insülin sensitivity. Magnesium support increases both insülin sensitivity and secretion in DM patients and decreases development of Type II diabetes [36]. However, especially at long term magnesium deficiency fasting glucose or insülin concentrations increases basal glucose without changing fasting glucose or insulin concentrations [37].
Effect of Boron against Obesity was shown in different models. It was shown that boron can change the lipid profile by acting on the lipid metabolism espacially on triglycerides and VLDL [38]. At the molecular level boron affects activity of at least 26 enzymes [39] and most of these enzymes is essential to energy substrate metabolism.
Boron in the form of borate make complexes with adenosine 5-phosphate (NAD+), pyridoxin, dehydroxyascorbic acid and pyridin nucleotides, that have biologically importance in invitro study as competetive inhibitor of some enzyme. Complexes of borate and nicotinamid prevent it for functioning as a coenzyme. While boron can cause nutrient deficiency when it is below the optimum level [40] it can be toxic both for the plants and humans when it is at extremely high concentrations [41]. Nevertheless, the range between boron deficiency and excessiveness is a very small. Boron intake can differ according to metabolism and age. For instance, for babies between 0-6 months it is 0.75 ± 0.14 mg/day, for men between the ages 51-70 it is 1.34 ± 0.02 mg/ day and for nursing women it is 1.39 ± 0.16 mg/day [28]. Upon consumption boric acid readily is cleared away in body fluids of both animals and humans [42]. The toxic level of boron for human is still not known precisely, but while the lethal dose for babies is 3000-6000 mg for adults it is 15.000-20.000 mg. The clinical symptoms of boron indicated according to age/body weight is from 100 to 55.500 mg.
Working Mechanism of Boron
Although the working mechanism of boron is not precisely known it is known that for the mammals it regulates the parathyroid function via phosphorus, magnesium and it is closely related especially with calcium. It is beneficial for bone metabolism through optimum calcium metabolism [43]. Boron has an important role in preventing osteoporosis and in use of important supplementray minerals and Vitamin D. It was observed that boron supplementation is an important support in treatment of Lupus Erythematosis, Candida Albicans, parasites, alergies, irregular sex hormones, menopause symptoms, aging, osteoporosis and arthritis.
Boron at non-toxic concentrations boron is absorbed through gastrointestinal tract and it is not stored in healthy tissues. In a few hours time it is excreted via urine. Half life of boric acid in humans is about 1 day [34]. Boron also affects energy substrate metabolism. Although the studies on what effect the trace elements have on diabetic patients have not given clear results yet in recent studies Show that boron has positive effect of obesity and Type II DM which develops due to obesity. However, it is not well understood how boron deficiency disturbs energy metabolism when other nutrients are given at suboptimal amount. It is known that when diet magnesium and Vitamin D levels are at sufficient level boron at physiological amount decreases body weight. It is emphasized that boron can change the lipid profile by playing a role especially on triglyceride and VLDL secretion in the lipid metabolism. It is shown that amine carboxy boranes are strong hypolipidemic agents in rodents.
Materials and Methods
Sampling
The blood samples were collected from the patients who had visited Çankırı Private Karatekin Hospital, Internal Disease Clinic, Cankiri, Turkey, in 2013. The patients were chosen among the volunteers, who were accepted in the study after filling out patient acceptance form, were at the age of 40 and older were diagnosed as healthy, diabetic and obese diabetic.
10 mL blood samples were taken from the patients by the blood sampling experts at the hospital according to the analysis technique at the blood sampling unit of the hospital. The samples were separated into their serum and plasma. Following this biochemical analysis were made. In this study, glucose, insulin, HbA1c, Cholesterol, Triglyceride, HDL, LDL, ALT, AST, GGT, Vitamin D, Mg, Ca and P parameters were analyzed via commercial TRIMARIS ready kits in RANDOX biochemical equipment. After sample digestion boron analysis was made by ICP-MS.
Determining BMI
BMI is calculated according to the below given formula via dividing body weight by square of height:
BMI=(weight in kilogram)/(height in meters)2
Determining Glucose Level
Blood glucose measurement relies on the principle of oxidation of glucose to glyconic acid and H2O2 in the presence of enzyme glucose oxidase via TRIMARIS commercial kit in Randox equipment. H2O2 is oxidized to a colored compound via the effect of cromogenic peroxidase enzyme. This compound attains a permanent red color via the effect of H2SO4. The colorimetric measurment is made at 540 nm.
Triglyceride Measurement Method
Triglyceride measurement is made via TRIMARIS commercial kit in Randox equipment. It is made via the reactions catalyzed by the enzymes glycerol kinaze, glycerol, phoshate oxidase and peroxidase following conversion of triglycerides to glycerol and fatty acids by lipoprotein lipase.
Hydrogen peroxide reacts with 4-aminophenazon and 4-chloropenol via the effect of peroxidase enzyme and forms a pink colored product. Intensity of the color is directly proportional to triglyceride concentration and it is determined via spectrophotometric measurement at 505 nm.
Total Cholesterol Measurement Method
Total cholesterol measurement is made in serum samples via TRIMARIS commercial kit in Randox equipment.
Total cholesterol level is determined enzymatically by using cholesterol esterase and cholesterol oxidase. Cholesterol esters are decomposed into free cholesterol and fatty acids via the effect of the enzyme cholesterol esterase. Cholesterol is converted into cholest-4-en-3-on and hydrogen peroxide by the effect of the enzyme cholesterol oxidase. Hydrogen peroxide reacts with 4-aminophenazon and phenol via the effect of the enzyme peroxidase and forms a pink colored product. The intensity of the color is directly proportional to the concentration of cholesterol and it is determined via spectrophotometric measurement at 505 nm.
Measurement Method for HDL
HDL measurement is made in serum samples via TRIMARIS commercial kit in Randox equipment. HDL level is determined enzymatically by using polyethyleneglycol (PEG) cholesterol esterase and PEG. PEG modified cholesterol esterase and cholesterol oxidase show selective activity against lipoprotein fractions. Cholesterol esters are decomposed into free cholesterol and fatty acids via the effect of the enzyme PEG cholesterol esterase. Cholesterol is converted into D4-Cholestenone and hyrogen peroxide via the effect of cholesterol oxidase. Via the effect of the enzyme peroxidase hydrogen peroxide reacts with 4-aminophenazone and N-(2-hydroxy-3-sulphopropyl)-3,5- dimethoxyanilin (HSDA) to give a blue color. Intensity of the color is directly proportional with the HDL concentration and it is spectrophotometrically determined at 600 nm.
Calculation Method for LDL Concentration
Serum LDL level is calculated according to the Friedewald formula. LDL=Total Cholesterol – [(HDL) + (Triglyceride/5)]
Determination Method for Boron
Boron was determined via Inductively Coupled Plasma-Mass Spectrophotometry (ICP-MS) (Thermo Jarrell Ash-VG Elemental, USA). Glassware was deliberately not used when preparing samples for boron determination. 100 mg blood serum samples were placed in pressurized polytetrafluoroethylene (PTFE) vessels and were reacted with 2.5 mL concentrated nitric acid and 0.5 mL hydrogen peroxide in the presence of 10 μg/L Be internal standard. The samples were digested in microwave digetsion system (Milestone 1200, Mega) at 200°C for 30 minutes. Then the samples were removed from the oven and 10 mL pure water was added onto each sample. The samples were later placed in polypropylene (PP) containers and were kept until analysis with ICP-MS. All standard solutions were also prepared in 1% HNO3 and 10 ng/g Be was added as internal standard. Blood serum samples were diluted as 1:100 ratio with 1% HNO3 and 10 ng/g Be was added. Calibration solutions were obtained by diluting the certified boron standard solution (Reageco Diagnostics). For each sample boron signal was measured by using three integrations each of which lasted 1 minute. Boron concentration was determined via V-groove nebulizer and VG Plasma Quad+2 (VG Elemental) which contained Gilson automatic sampler.
Before proceeding with the analysis of the samples power, nebulizer flow rate, observation height over plasma were carefully adjusted by using 1 ppm (1 μg/mL) B standard. Working conditions of the equipment were adjusted as indicated in Table 1 so that when analyzing 1% (v/v) HNO3 samples containing 10 ng/g Be would give the maximum sensitivity in the equipment parameters and the variation coefficient would be minimum. These optimized parameters were used in all analysis. In order to obtain stable plasma the equipment was run 1 hour before the analysis (Table 1).
Table 1: ICP-MS equipment parameters.
| R.F. gücü |
1.15 Kw |
| Argon flow rate |
|
| Nebulizer gas |
0.8 L/dk. |
| Support gas |
0.5 L/dk |
| Plasma gas |
15.0 L/dk |
| Cooling gas |
14 L/dk |
| Sampling depth |
8 mm |
| Sampling cone |
1.0 mm |
| Sweeper cone |
0.7 mm |
| Sample suction |
1.0 Ml/dk |
| Mass collecting |
Puls/analoge |
| Lens 2 |
5 V |
| Lens 3 |
6 V |
| Lens 4 |
-87 V |
| Collector |
-8.7 V |
| Range |
-60.6 V |
| Extractor |
390 V |
| Pole deviation |
3 V |
| Integration period |
2 S |
| Sweep number |
10 |
| Number/Amu |
16 |
| Scanning point |
3 |
| Investigation point |
3 |
| Analyte concentration |
10 ng/Ml |
| Sampling rate |
1 mL/dk |
| Measurement period |
10 sec. (pulse counting mode) |
| Waiting period |
0.32 ms |
| Emission wavelengths |
|
| B |
249.772 nm |
| Be |
234.861 nm |
| Ca |
317.933 nm |
1% HNO3 solution was used as washing solutions between the samples. The type and concentration of the matrix used for both as the washing solution and for sample digestion were kept the same so that the plasma maintained its stability. In order to prevent contamination from sample to sample the washing solution was kept in plastic containers which were pre-washed with HNO3 solution and were kept at a height higher than that of the sample.
100 mg blood serum samples were digested with 2.5 mL concentrated nitric acid and 0.5 mL hydrogen peroxide medium in the presence of 10 μg/L Be internal standard in pressurized PTFE containers via microwave digestion system (Milestone 1200, Mega) at 200 oC for 30 min. 10 mL pure water was added to the samples after they were taken from system. All standard boron solutions were also prepared in 1:100 HNO3 solutions as were the samples and 10 ng/g Be was added as internal standard.
As given in Table 1 when 1% (v/v) HNO3 samples containing 10 ng/g Be were analyzed the working conditions of the equipment were adjusted so as the sensitivity of the equipment would be maximum and the variation coefficient would be minimum. Sensitivity, selectivity and accuracy studies of boron determination method which was used in this study were made.
Each sample was read three times and the average values were reported. At the end of each cycle in order for to provide stability of the ICP and for to prevent the contamination, which would come from other samples, standard solution was run. The values fell into the 1% theoretical concentration. Limit of detection (LOD) was determined according to the United States Environmental Protection Agency (US-EPA). Seven measurements were made under the conditions given in Table 1 via 0.050 μg/mL B standard.
LOD, which was 0.05 μg/g, was obtained by multiplying the standard deviation of these seven measurements with three. In some of the blood serum samples boron concentration was below LOD (BLD). Blank sample was obtained diluting the serum sample, which was taken from the patient before the infusion, in the same way. All analysis was made by using B-spiked blank samples as the control value. Analysis of the 1 μg/mL B standard was made by analyzing the NIST Citrus leaves 1572, US Dept. of Commerce, National Institute of Standards and Technology, Gaithersburg, MD. For B analysis in blood serum the plasma samples were spiked with 0.5 μg/mL inorganic boron. Analyses of all blank samples were made after they were spiked with inorganic boron in the concentration range 0.5 and 0.05 μg/mL. Moreover, in order to check the accuracy between the cycles in each cycle spiked blood plasma was also analyzed. In the boron concentration 10-40 μg/g for (n=3) boron analysis the accuracy, LOD and linear measurement range were found to be % 4.1, 0.05 μg/g and 0.100-150 μg/g, respectively.
Statistical Analysis
In this study all statistical analysis was made via SPSS-13 package program and the results were given as arithmetic average ± standard deviation. For the meaning of the differences between the averages Student- t test and in multi groups One Way ANOVA test were used. Correlation tests were made via Pearson correlation test and for the test between the control group and the diabetic and obese diabetic groups paired-t test was used. p<0.05 values were considered as statistically meaningful for the tests which were used.
Results and Discussion
This study was realized in 3 groups which were namely the healthy control group, diabetic and obese diabetic groups. The healthy individuals and the patients, who attended the study, were grouped after determining their ages, heights, weights and calculating their body mass index (BMI) from their heights and weights. The results are presented in Table 2.
Table 2: Demographic data (control, diabetic and obese diabetic) of the groups which attended the study and their carbohydrate metabolism and lipid profile levels.
| Parameters |
Control group |
Diabetic group |
Obese diabetic group |
Female
( n=7) |
Male
(n=7) |
Female
( n=7) |
Male
(n=7) |
Female
(n=7) |
Male
(n=7) |
| Age (years) |
45.5 ± 5.2 |
47.1 ± 6.5 |
46.5 ± 7.2 |
49.2 ± 6.3 |
48.3 ± 7.5 |
47.8 ± 8.2 |
| Weight(kg) |
64.8 ± 10.6 |
66.6 ± 7.9 |
75.3 ± 12.5* |
75.6 ± 9.8* |
91.7 ± 12.3** |
95.8 ± 15.1** |
| Height (cm) |
166.3 ± 6.7 |
174.1 ± 10.2* |
164.3 ± 7.2 |
175.5 ± 8.1* |
163.2 ± 7.3 |
172.3 ± 9.5* |
| BMI (kg/m2) |
23.47 ± 3.3 |
22.05 ± 2.5 |
27.99 ± 3.8* |
24.07 ± 5.7* |
34.87 ± 4.1** |
32.14 ± 3.5** |
| Glucose (mg/ dL) |
90 ± 12 |
100 ± 14 |
147,1 ± 20** |
196 ± 24*** |
168,71 ± 21** |
211,42 ± 25*** |
| Insulin (µU /mL) |
11 ± 4 |
24 ± 3.4 |
11,19 ± 4.2 |
25,22 ± 4.7 |
11,36 ± 4.1 |
15,41 ± 5.2* |
| HbA1c |
5.0 ± 2 |
4.3 ± 1.5 |
8 ± 3.3** |
7,62 ± 3.5** |
7,68 ± 3.52** |
8,01 ± 4.3** |
| Cholesterol (mg/dL) |
180 ± 23 |
150 ± 20 |
204,3 ± 24.6** |
172 ± 21.8* |
184,14 ± 22.7 |
202,9 ± 24.3** |
| Triglyceride (mg/dL) |
130 ± 18 |
115 ± 21 |
152,7 ± 20.8** |
136,95 ± 19 |
134,68 ± 18.9 |
268,64 ± 29*** |
| LDL (mg/dl) |
95 ± 11 |
86 ± 10 |
114,86 ± 16.8* |
117,37 ± 17* |
132 ± 19.6** |
134,1 ± 18.8** |
| HDL (mg/dl) |
40 ± 6 |
26 ± 5* |
32,25 ± 5.7** |
23,46 ± 4.3* |
36,77 ± 5.9*** |
30,06 ± 5.2** |
*, **, *** statistically important.
While the average of the ages of the women, who attended the study, was determined to be 45.5±5.2, 46.5±7.2 and 48.3±7.5 for the control, diabetic and obese diabetic groups, respectively for men the age average was found to be 47.1±6.5; 49.2±6.3 and 47.8±8.2 for the same respective groups.
In the study no difference was observed with respect to age among the groups (control, diabetic and obese diabetic groups) and the sexes. In the study the weight and BMI of diabetic (P<0.01) and obese diabetic (P<0.001) individuals were determined to be higher than that of the control group. For obese diabetic patients BMI was found to be higher than the lower limit of obesity >30. However, no significant difference was observed in weight and BMI of different sex groups. In all study groups, the height of male individuals was observed to be higher than female individuals (P<0.05). In Figure 1 is presented the BMI distribution among male and female subjects in the control, diabetic and obese diabetic groups.
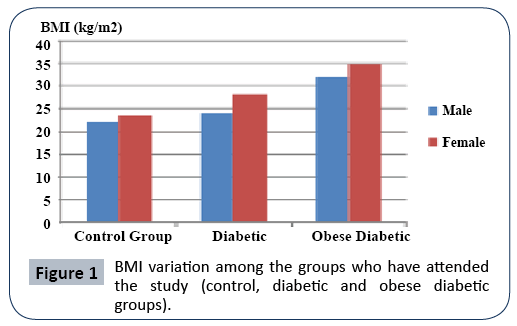
Figure 1: BMI variation among the groups who have attended the study (control, diabetic and obese diabetic groups).
In this study, where effect of boron on carbohydrate metabolism (glucose, HbA1c, insulin), lipid profile (triglyceride, total cholesterol, LDL, HDL) and on some biochemical parameters (Ca, P, Mg and Vitamin D) in diabetic and obese diabetic patients is investigated, the parameters related with the carbohydrate metabolism and the related biochemical parameters and the lipid profile levels of the blood samples taken from patients diagnosed by the doctor according to their weight and BMI are given in Table 2.
In the study for investigating the carbohydrate metabolism, blood glucose, insülin and HbA1c levels were determined. Blood glucose levels in the control group in average was determined to be 100 mg/dL for male subjects and 90 mg/dL for female subjects and in the diabetic group in average it was determined to be 196 mg/dL for male subjects and 147,1 mg/dL for female subjects. In obese diabetic group the blood glucose levels was determined to be 211,42 mg/dL for male subjects and 168,71 mg/dL for female subjects. In Figure 2a. is shown the distribution of glucose level in the female and male subjects in the control (healthy), DM and obese DM groups.
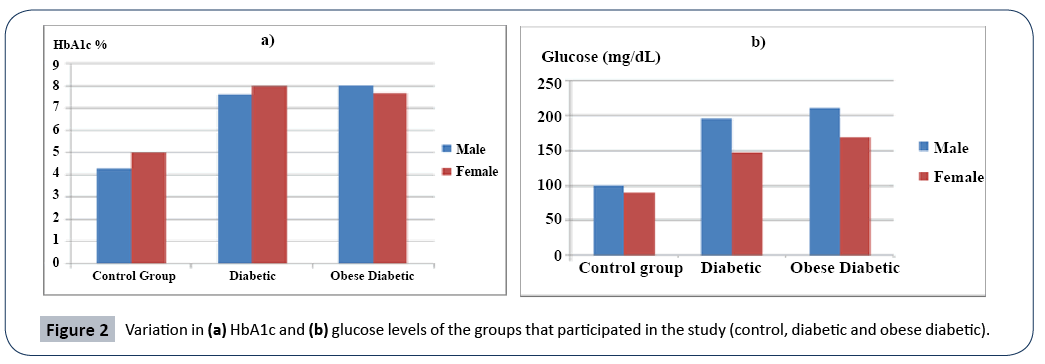
Figure 2: Variation in (a) HbA1c and (b) glucose levels of the groups that participated in the study (control, diabetic and obese diabetic).
According to the results obtained the blood glucose levels for diabetic male (P<0.001) and female (P<0.01) subjects was found to be higher than that of the healthy group members. Dramatic decrease (P<0.05) was observed in blood insulin level of only obese diabetic male subjects when compared to male subjects in the control and diabetic groups. No statistical difference was observed in insulin level of women in any group. In the study, HbA1c level was found to be higher in diabetic and obese diabetic female and male subjects when compared to those in the control group. HbA1c level of diabetic female and obese diabetic female subjects was found to be statistically higher (P<0.01) than that in the control group. HbA1c level of the diabetic male and obese diabetic male patients were also found to be statistically higher (P<0.01) than that in the control group. In Figure 2b. is presented the variation in HbA1c level among the female and male subjects in the control (healthy), diabetic and obese diabetic groups (Figure 2).
In the study while the glucose and insülin level of diabetic and obese diabetic male patients were found to be statistically higher than that of female patients, HbA1c levels were found to be high in all patient groups.
Blood lipid profile was also investiagted in the study. According to this cholesterol level in diabetic female subjects were found to be statistically (P<0.01) higher than that of female subjects in the control and obese diabetic groups.
Moreover, blood cholesterol levels of diabetic (P<0.05) and obese diabetic (P<0.01) male subjects were found to be higher than that of the control group. Triglyceride level of diabetic female subjects was found to be high (P<0.01) and it was found to be higher for obese diabetic male subjects (P<0.001). LDL levels of both diabetic (P<0.01) and obese diabetic (P<0.001) subjects were found to be statistically higher than that of the control group. However, HDL level was found to decrease in the diabetic and obese diabetic groups. While no significant difference in LDL levels was observed between sexes HDL levels of male subjects were found to be lower than that of female subjects. In Figure 3a is presented the variation in cholesterol levels of female and male control (healthy), DM and obese diabetic groups.
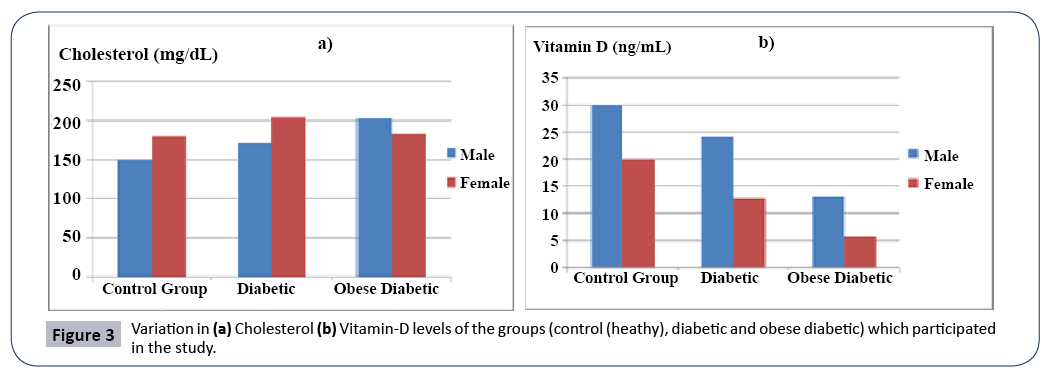
Figure 3: Variation in (a) Cholesterol (b) Vitamin-D levels of the groups (control (heathy), diabetic and obese diabetic) which participated in the study.
In order to determine the effect of boron on bone metabolism the level of some bone metabolism indicators (Ca, P, Mg, D vitamini) were determined. The variation in bone metabolism indicators of the diabetic and obese diabetic subjects with respect to boron levels was determined and presented in Table 3.
Table 3: Biochemical paramteres in the bone metabolism of the groups which participated in the study and their boron values.
| Parameters |
Control Grubu |
Diabetic group |
Obese diabetic group |
Female
(n=7) |
Male
(n=7) |
Female
(n=7) |
Male
(n=7) |
Female
(n=7) |
Male
(n=7) |
| Vitamin D (ng/mL) |
20 ± 5 |
30 ± 4 |
12.7 ± 4.3* |
24.10 ± 7.4** |
5.67 ± 3.8*** |
13.1 ± 6.9* |
| Mg (mg/dL) |
1.8 ± 0.8 |
1.7 ± 0.7 |
1.81 ± 1.2 |
1.817 ± 1.3 |
1.86 ± 1.7 |
1.85 ± 1.5 |
| Ca (mg/dL) |
8.0 ± 3 |
7.9 ± 3 |
9.73 ± 3.85* |
9.37 ± 3.6* |
9.58 ± 3.7* |
9.71 ± 3.81* |
| P (mg/dL) |
2.4 ± 1.5 |
2.2 ± 1.4 |
3.64 ± 1.9* |
3.47 ± 1.8* |
3.70 ± 2* |
3.60 ± 1.9* |
| B (µg/g) |
1.268 ± 0.9 |
1.359 ± 0.7 |
0.679 ± 0.06* |
0.457 ± 0.08** |
0.113 ± 0.07*** |
0.366 ± 0.05** |
*,**,*** indicated that these values are statistically important.
No significant difference was observed among magnesium values of the control and the patient groups. Calcium and phosphorus values were found to be higher for diabetic and obese diabetic groups (P<0.05) than those for the control group. However, while the average Vitamin D level was found to be 20 ng/mL for female and 30 ng/mL for male subjects in the control group, it was found to be 12.7 ng/mL for female and 24.10 ng/mL for male subjects in the diabetic patient group and 5.67 ng/mL for female and 13.1 ng/ mL for male subjects in the obese diabetic patient group. Vitamin D values of the diabetic and obese diabetic patient groups were found to be significantly lower than that of the control group and Vitamin D value of obese diabetic female (P<0.001) and male (P<0.05) subjects were found to be onsiderably lower than that of other groups. In Figure 3b is presented Vitamin D levels of male and female subjects in the control (heathy), DM and obese diabetic patient groups (Figure 3).
Boron values were found to be higher in the control group compared to the diabetic and obese diabeic groups. While boron values were determined to be 1.268 μg/g for female subjects and 1.359 μg/g for male subjects in the control group; for female and male subjects in the diabetic patient group it was 0.679 μg/g and 0.457 μg/g, respectively and for female and male subjects in the obese diabetic patient group it was 0.113 μg/g and 0.366 μg/g, respectively. In the study made boron values for female subjects in the obese diabetic patient group was found to be statistically lower (P < 0.001) than that of in other groups in the study.
While no meaningful difference between serum boron levels of diabetic female and male subjects could be found in the correlation analysis for obese diabetic female subjects (r=-0.765) and obese diabetic male subjects (r=-683) a pronounced negative correlation was found.
In order to determine the correlation among boron levels and the carbohydrate indicators correlation among boron levels blood glucose, HbA1c and insulin levels was investigated. Pronounced negative correlation values were observed between serum boron levels and blood glucose levels of diabetic (r=-0.653) and obese diabetic (r=-0.715) female subjects as well as diabetic (r=-0.567) and obese diabetic (r=-0.748) male subjects. Meaningful correlation could not be observed between serum boron values and insulin values among diabetic and obese diabetic groups (r=0.170, r=0.67). While there is a negative correlation among serum boron levels and HbA1c level of diabetic (r=-0.452) and obese diabetic (r=-0.648) female subjects these negative correlation values were also determined for male subjects in diabetic (r=-0.367) and obese diabetic (r=-0.542) groups. Change in serum boron levels of female and male subjects in the control, DM and obese DM groups are presented in Figure 4.

Figure 4: Change in boron levels of the groups that participated in the study (control, DM and obese DM).
In a similar way when correlation analysis between serum boron levels and the lipid profile was investigated it was observed that there is a negative correlation between total cholesterol and serum boron levels of diabetic female (r=-0.412) and diabetic male subjects (r=-0.541) and obese diabetic female (r=-0.578) and obese diabetic male (r=-0.674) subjects. Negative correlation was observed between for triglyceride values and boron levels only for diabetic female (r=-0.483) and obese diabetic male (r=- 0.612) subjects. However, no meaningful correlation could have been observed between serum boron levels and HDL levels.
In correlation analysis among bone indicators and serum boron levels a positive correlation between Vitamin D levels and serum boron levels of diabetic female (r=0.350) and male (r=-0.241) subjects and obese diabetic female (r=0.586) and male (r=0.453) subjects was observed. However, no meaningful correlation could be observed among Ca and P levels (r=-0.170).
The precision, limit of detection and linear working range for the boron determination method used in this study was found to be 4.1 %, 0.05 μg/g and 0.100-150 μg/g, repectively, for boron concentration range 10-40 μg/g and n=3. ) In recovery studies blood serum samples were spked with 0.5 μg/mL inorganic boron. All blank samples were spiked with inorganic boron in the concentration range 0.5 ve 0.05 μg/mL before analysis. Blood serum, which is not spiked, was also analyzed between the cycles. In the analysis made with acid blank spiked with 0.5 μg/ mL B the recovery was 100%. For precision studies in the analysis of blood serum samples spiked at 50 μg/mL for concentration range 0.48-0.54 μg/mL the average was found to be 0.51 ± 0.04 μg/mL and the variation coefficient was 4.1% and the average recovery was 105%. For blank samples spiked with 50 ng/ mL B the recovery was 95.6% and 99%. These results indicate that the method developed is capable of reducing volatility of boron. Moreover, in the studies made so far ICP-MS, which was mentioned to be superior to other methods with resepct to precision, accuracy and sensitivity [44,45] the developed boron determination method was a method preferrable over other methods with respect to precision, accuracy and eco-friendliness when precision, accuracy and the amount of reagent consumed are taken into consideration.
In boron determination method in the boron concentration range 10-40 μg/g (n=3) precision for boron determnation method was 4.1%, limit of detection 0.05 μg/g and the linear measurement range was found to be 0.100-150 μg/g. In some of the blood serum samples boron concentration was observed tobe lower than the limit of detection. Accuracy study was made by analyzing NIST Citrus leaves 1572, US Dept. of Commerce, National Institute of Standards and Technology, Gaithersburg, MD. It was observed that in the analysis B values were found to lie in the concentration range 49.3 - 53.7 μg/mL and the average value was 53.26 ± 2.41 μg/mL (average ± SS) and the Variation Coefficient was 4.1%. The value 53.26 ± 2.41 μg/mL, which was found to be 53.26 ± 2.41 μg/mL is in conformity with the value 50 μg/mL, which was found in the study made by Hunt and Shuler [40], and the value 63 μg/mL found found in the study made by Clarke et al. [46-48].
Conclusions
In this study targeted at investigating the effect of boron on carbohydrate metabolisms of diabetic and obese diabetic patients. Both blood glucose and HbA1c levels, which are chosen indicators of the carbohydrate metabolism, of diabetic and obese diabetic feale and male subjects were found to be considerably high. Moreover, a pronounced negative correlation was found between the glucose and HbA1c levels of diabetic and obese diabetic female and male subjects and their serum boron levels. This indicates that carbohydrate metabolism of diabetic and obese diabetic patients is affected by low boron level.
Regarding the lipid profile while total cholesterol, triglyceride, LDL and cholesterol levels of diabetic and obese diabetic female and male subjects were considerably higher than those of the control group HDL values were found to be low. This increase and decrease in the lipid profile values indicate that the lipid metabolism is adversely affected from diabetis and obesity. At the same time the negative correlations which are determined among serum boron levels and total cholesterol, triglyceride and LDL levels also support this and it suggests that low boron levels may be related with lipid metabolism during sicknesses. In a study made by Zhao et al. it was shown that the sterol regulating element binding proteins (SREBPs) are the most important regulators in lipid biosynthesis and that inhibition of SREBP transctiptional activity by boron containing compounds increases lipid homeostasis.
A similar situation is valid between serum boron levels and BMI values. It was observed that there is an inverse relation between BMI and boron level. This situation is also supported by the findings of Hasbahçeci et al. although boron level of the subjects in the control group was higher than that of the subjects in other groups, the BMI was at the lowest value. The negative correlation between serum boron values of the diabetic and obese diabetic groups and the BMI values indicates that fat and weight increase affect carbohydrate and lipid metabolisms.
Boron values were found to be much higher in the control group than that in the diabetic and obese diabetic groups. In the control group boron values were determined to be 1.268 μg/g and 1.359 μg/g for female and male subjects, respectively. In the diabetic patient group it was found to be 0.679 μg/g and 0.457 μg/g, for female and male subjects, respectively and in the obese diabetic patient group it was 0.113 μg/g and 0.366 μg/g, for female and male subjects, respectively. In this study it was found that boron values of obese diabetic female subjects were statistically lower (P < 0.001) than those in other study groups. Hasbahçeli et al. have reported that age and obesity affect blood boron levels. The sharp decrease, which was observed in obese and diabetic female subjects above the age 40, may be related with the decrease in the estrogen level due to menopause. In a study made on postmenopausal women it was shown that boron decreases extretion of Ca and Mg via urea and increases 17 beta-estradiol and testosteron concentrations. In this study, while average Vitamin D level was found to be 20 ng/mL for female subjects in the control group for female subjects in the diabetic group it was determined to be 12.7 ng/mL and for male subjects this value was 24.10 ng/mL. In the obese diabetic group the average value was found to ve 5.67 ng/mL and 13.1 ng/mL for female and male subjects, respectively. As this result shows serum vitamin D level of obese diabetic patients is lower compared to that Vitamin D level in obese diabetic subjects was determined to be lower than than that of the subjects with normal weight indicates that Vitamin D affect development of insulin resistance and systemic inflamation processes at varying degrees. On the other hand, low Vitamin D levels create hypotoncicity in the muscles and the hypoactive life style, which this would cause, is a factor that contributes to obesity . It was reported that in cases of Vitamin D deficiency upon glucose loading insülin response detoriorates. In cases of Vitamin D deficiency glucose induced insülin secretion would be inhibited both in vivo and in vitro . Moreover, the positive correlation which is determined between serum boron levels and vitamin D levels of diabtic female (r=350) and male (r=-241) subjects and obese diabetic female (r=586) and male (r=453) subjects also supports that, boron can be related with bone metabolism.
In the light of the results obtained it can be said that the findings of other studies made support the findings obtained in the investigation made on the effect of serum boron levels on carbohydrate and bone metabolisms of diabetic and obese diabetic subjects as well as on their lipid profiles. Thus, it can be concluded that according to the findings boron affects carbohydrate and bone metabolisms and the lipid profiles. Therefore, boron supplementation may be beneficial in treatment of disorders related with diabetes and obesity.
Acknowledgement
The authors are grateful for the financial support provided by the Unit of Scientific Research Projects of Çankırı Karatekin University for the Project titled Investigation of Effect of Serum Boron Level on Glucose and Lipid Metabolism and on Some Biochemical Parameters with the Project No. 2012/14, which was completed in 2016, and the authors present their deepest thanks to Prof. Dr. Tunay KONTAS ASKAR from Cankiri Karatekin University for her valuable suggestions regarding the parameters to be considered in the analysis, to Med. Dr. Ceyhan CICEK, an expert of internal diseases from Private Cankiri Karatekin Hospital, for diagnosing the patients, to the members of the biochemistry division of Private Cankiri Karatekin Hospital for taking the blood samples and to Ass. Prof. Dr. Nesrin Horzum for providing standards in the analysis.
Compliance with Ethics Standards
The patients were asked regarding their approval for participting in the study and they were also asked to fill out Patient Acceptance Forms before blood samples were taken from them.
Conflict of Interest
The authors declare no conflict of interest. This research did not contain any studies involving human or animal subjects.
26404
References
- te Velde SJ, van Nassau F, Uijtdewilligen L, van Stralen MM, Cardon G, et al. (2012) Energy balance-related behaviours associated with overweight and obesity in preschool children: a systematic review of prospective studies. Obes Rev 13: 56-74.
- World Health Organization (2011) Global status report on noncommunicable diseases.
- Bohula EA, Wiviott SD, McGuire DK, Inzucchi SE, Kuder J, et al. (2018) Cardiovascular Safety of Lorcaserin in Overweight or Obese Patients. New England Journal of Medicine 379: 1107-1117.
- Javed A, Jumean M, Murad MH, Okorodudu D, Kumar S, et al. (2015) Diagnostic performance of body mass index to identify obesity as defined by body adiposity in children and adolescents: a systematic review and meta-analysis. Pediatric Obesity 10: 234-244.
- Lovejoy JC, Champagne CM, de Jonge L, Xie H, Smith SR (2008) Increased visceral fat and decreased energy expenditure during the menopausal transition. International Journal of Obesity 32: 949-958.
- Dagdelen S, Deyneli O, Olgun N, Siva ZO, Sargin M, et al. (2018) Turkish Insulin Injection Technique Study: Population Characteristics of Turkish Patients with Diabetes Who Inject Insulin and Details of Their Injection Practices as Assessed by Survey Questionnaire. Diabetes Therapy 9: 1629-1645.
- Goldenberg R, Punthakee Z (2013) Definition, Classification and Diagnosis of Diabetes, Prediabetes and Metabolic Syndrome. Canadian Journal of Diabetes 37: S8-S11.
- Bozdemir H, Tetiker BT (1994) Scientific and Technical Research Council of Turkey (1994) Turkish Journal of Medical Sciences Scientific and Technical Research Council of Turkey 43.
- Ashraff S, Siddiqui MA (20130 Health Authority S. Obesity and Insulin Resistance: Management in Diabetes. Article in Turkish Journal of Endocrinology and Metabolism.
- Vogel H, Jahnert M, Stadion M, Matzke D, Scherneck S, et al. (2017) A vast genomic deletion in the C56BL/6 genome affects different genes within the Ifi200 cluster on chromosome 1 and mediates obesity and insulin resistance. BMC Genomics 18: 172.
- Evert AB, Boucher JL, Cypress M, Dunbar SA, Franz MJ, et al. (2014) Nutrition therapy recommendations for the management of adults with diabetes. Diabetes Care 37: S120-43.
- Sears B, Perry M (2015) The role of fatty acids in insulin resistance. Lipids in Health and Disease 14: 121.
- Greenberg ER, Baron JA, Tosteson TD, Freeman DH, Beck GJ, et al. (1994) A Clinical Trial of Antioxidant Vitamins to Prevent Colorectal Adenoma. New England Journal of Medicine 331: 141–147.
- Rustan A, Drevon C (2005) Fatty Acids: Structures and Properties. London: Encyclopedia of Life Sciences.
- Feingold KR, Grunfeld C (2000) Introduction to Lipids and Lipoproteins. Endotext.
- Nes WD (2011) Biosynthesis of Cholesterol and Other Sterols. Chemical Reviews 111: 6423-6451.
- Brown, Michael S (1984) How LDL receptors influence cholesterol and atherosclerosis. Scientific American 251: 58-69.
- Stein EA, Myers GL (1995) National Cholesterol Education Program recommendations for triglyceride measurement: executive summary. The National Cholesterol Education Program Working Group on Lipoprotein Measurement. Clinical chemistry 41: 1421-1426.
- Davis CG, Goldstein JL, Südhof TC, Anderson RGW, Russell D, et al. (1987) Acid-dependent ligand dissociation and recycling of LDL receptor mediated by growth factor homology region. Nature 326: 760-765.
- Mayes PA (2003) Metabolism of unsaturated fatty acids and eicosanoids. Harper’s Illustrated Biochemistry (26th Edn) (Lange Medical Books, New York) pp: 190-196.
- Kennelly PJ; Murray RK, Jacob M,Varghese J (1996) Plasma proteins, immunoglobulins and blood coagulation. Harper's Illustrated Biochemistry, 30e.
- Belahsen R, Rguibi M (2006) Population health and Mediterranean diet in southern Mediterranean countries. Public Health Nutrition 9: 1130-1135.
- Eggeling S (2006) On the influence of treatment with atorvastatin on the flow-dependent dilation of the brachial artery regardless of the cholesterol reduction.
- Bab IA, Einhorn TA (1994) Polypeptide factors regulating osteogenesis and bone marrow repair. Journal of Cellular Biochemistry 55:358-365.
- Holick MF (2004) Sunlight and vitamin D for bone health and prevention of autoimmune diseases, cancers, and cardiovascular disease. The American Journal of Clinical Nutrition 80: 1678S–1688S.
- McGill AT, Stewart JM, Lithander FE, Strik CM, Poppitt SD (2008) Relationships of low serum vitamin D3with anthropometry and markers of the metabolic syndrome and diabetes in overweight and obesity. Nutrition Journal 7: 4.
- Thorand B, Zierer A, Huth C, Linseisen J, Meisinger C, et al. (2011) Effect of serum 25-hydroxyvitamin D on risk for type 2 diabetes may be partially mediated by subclinical inflammation: results from the MONICA/KORA Augsburg study. Diabetes Care 34: 2320-2322.
- AÃÂÃÂÃÂâÂÂÃÂâââÂÂìÃÂæÃÂÃÂââ¬Ã
¡ÃÂâ¦ÃÂøkar TK, Er H, DemirdöÃÂÃÂÃÂâÂÂÃÂâââÂÂìÃÂ
þÃÂÃÂââ¬Ã
¡ÃÂâ¦ÃÂøen RE (2018) The Effects of Boron on Bone Metabolism as a Nutraceutical. Journal of Eurasian Health Sciences 1: 7-12.
- Rowe RI, Eckhert CD (1999) Boron is required for zebrafish embryogenesis. Journal of Experimental Biology 202.
- Hunt CD (1998) Regulation of enzymatic activity. Biological Trace Element Research 66: 205-225.
- Nielsen FH (2002) The Nutritional Importance and Pharmacological Potential of Boron for Higher Animals and Human. In Boron in Plant and Animal Nutrition, Boston, MA: Springer US, Pp: 37-49.
- Mertz W (1986) Trace elements in human and animal nutrition. Academic Press (5th Edn) 2.
- Moseman RF (1994) Chemical disposition of boron in animals and humans. Environmental Health Perspectives 102: 113–117.
- Bakken NA, Hunt CD (2003) Dietary Boron Decreases Peak Pancreatic In Situ Insulin Release in Chicks and Plasma Insulin Concentrations in Rats Regardless of Vitamin D or Magnesium Status. The Journal of Nutrition 133: 3577–3583.
- Nielsen, Forrest H, Gallagher, Sandra K, Johnson, et al. (1992) Boron enhances and mimics some effects of estrogen therapy in postmenopausal women. Journal of trace elements in experimental medicine 5: 237-246.
- Valk HW (1999) Magnesium in diabetes mellitus. The Netherlands Journal of Medicine 54: 139-146.
- Reis MAB, Reyes FGR, Saad MJA, Velloso LA (2000) Magnesium Deficiency Modulates the Insulin Signaling Pathway in Liver but Not Muscle of Rats. The Journal of Nutrition 130: 133-138.
- Basoglu A, Sevinc M, Birdane FM, Boydak M (2002) Efficacy of Sodium Borate in the Prevention of Fatty Liver in Dairy Cows. Journal of Veterinary Internal Medicine 16: 732-735.
- deHunt CD (1989) Dietary boron modified the effects of magnesium and molybdenum on mineral metabolism in the cholecalciferol-deficient chick. Biological Trace Element Research 22: 201–220.
- Shorrocks VM (1997) The occurrence and correction of boron deficiency. Plant and Soil 193: 121–148.
- Tural B (2010) Separation and Preconcentration of Boron with a Glucamine Modified Novel Magnetic Sorbent. CLEAN-Soil, Air, Water 38: 321–327.
- Sutherland B, Strong P, King JC (1998) Determining human dietary requirements for boron. Biological Trace Element Research 66(1-3): 193-204.
- Meacham SL, Taper LJ, Volpe SL (1995) Effect of boron supplementation on blood and urinary calcium, magnesium, and phosphorus, and urinary boron in athletic and sedentary women. The American Journal of Clinical Nutrition 61: 341-345.
- Al-Ammar AS, Reitznerová E, Barnes RM (1999) Feasibility of using beryllium as internal reference to reduce non-spectroscopic carbon species matrix effect in the inductively coupled plasma–mass spectrometry (ICP-MS) determination of boron in biological samples. Spectrochimica Acta Part B: Atomic Spectroscopy 54: 1813-1820.
- Carlson RM, Paul JL (1969) Potentiometric determination of boron in agricultural samples. Soil Science 108: 266-272.
- Clarke WB, Koekebakker M, Barr RD, Downing RG, Fleming RF (1987) Analysis of ultratrace lithium and boron by neutron activation and mass-spectrometric measurement of 3He and 4He. International Journal of Radiation Applications and Instrumentation. Part A. Applied Radiation and Isotopes 38: 735-743.
- OÃÂÃÂÃÂâÂÂÃÂâââÂÂìÃÂ
þÃÂÃÂââ¬Ã
¡ÃÂâ¦ÃÂøuz FK, OÃÂÃÂÃÂâÂÂÃÂâââÂÂìÃÂ
þÃÂÃÂââ¬Ã
¡ÃÂâ¦ÃÂøuz M, BüyükoÃÂÃÂÃÂâÂÂÃÂâââÂÂìÃÂ
þÃÂÃÂââ¬Ã
¡ÃÂâ¦ÃÂølu T (2012) The effects of using chicken drippings oil instead of the sunflower oil on performance, blood parameters, cholesterol and fatty acid composition of egg yolk in laying.
- Norman AW, Frankel JB, Heldt AM, Grodsky GM (1980) Vitamin D deficiency inhibits pancreatic secretion of insulin. Science 209: 823-825.

