Keywords
Visceral adiposity index; Metabolic phenotype; HOMA-IR; Adiponectin; Glucose
Introduction
The prevalence of obesity has increased worldwide, making it a major public health concern [1]. According to the 2016 National Health and Nutrition Survey in the Mexican population, the prevalence of overweight and obesity is 72.5% in adults of ages 20 and above [2]. Obesity is associated with numerous metabolic complications such as type 2 diabetes, hypertension, cardiovascular diseases and several forms of cancer [3]. However, the presence of these obesity-related metabolic disturbances varies widely among obese individual. There is a subset of obese individuals that seems to be protected or more resistant to the development of metabolic abnormalities associated with obesity [4,5]. These individuals, now known as metabolically healthy obese (MHO), despite having excess body fat, display a favorable metabolic profile, characterized by high levels of insulin sensitivity, the absence of hypertension, as well as a favorable lipid and inflammatory profile [6-8]. In addition, a subgroup of normal-weight individuals with abnormal metabolic parameters or metabolically unhealthy non-obesity (MUNO) has also been described [9]. Epidemiological and clinical studies suggest that the prevalence of MHO subjects may vary between 10 and 40% and is affected by factors such as ethnic background, age and level of physical activity [10,11]. Wildman et al. showed that the prevalence of MHO individuals is higher in non- Hispanic white population [12]. Cross-sectional epidemiological studies also suggest that MHO prevalence is higher in younger individuals and slightly higher in women [12,13]. A complex interaction between genetic, environmental and behavioral factors is thought to be the underlying mechanism of the MHO phenotype [14]. Among multiple factors that might contribute to metabolic health in the MHO state is the reduced accumulation of visceral fat [15]. A more peripheral fat distribution had also been observed in individuals whose MHO phenotype persisted [16]. However, visceral abdominal fat accumulation predicted the conversion of MHO subjects to metabolically unhealthy obese (MUO) state [17]. The visceral abdominal fat accumulation detected by computed tomography predicted the conversion of MHO subjects to MUO state after 10 years of follow-up [17]. The visceral adiposity index (VAI) is a gender-specific mathematical model, which originates from observation in a healthy normal/ overweight population of a linear relationship between body mass index (BMI) and waist circumference (WC) [18,19]. VAI estimates visceral fat distribution, and it is a useful determinant of the phenotype change and substituted the necessity to take high-cost imaging studies, thereby making the prediction much more practical in daily clinical practice and populations studies for the assessment of cardio metabolic risk associated with visceral obesity [18,19]. In addition, VAI showed a correlation with known adipocytokines and cardiometabolic risk serum markers [20,21]. The aims of this work were to evaluate the relationship of visceral adiposity index with different metabolic phenotypes, and cardiometabolic risk markers in non-diabetic subjects.
Methods
Study participants
By means of the cross-sectional design, we recruited clinically healthy subjects from 30 to 50 years old, with normal BMI (Elimine 18.6 to 24.9 kg/m2) and obesity grade I (30 to 34.9 kg/m2), without food supplement or dietary treatment, alcohol consumption or smoking cigarettes, and with a physical level of exercise <2 hours/week. All participants gave their written informed consent to participate in the study. The study was conducted in accordance with the ethical standards laid down in the Declaration of Helsinki in 1983 and in agreement with the Good Clinical Practice guidelines. The study was approved by the Institutional Ethics Committee of the University of Guanajuato.
Anthropometrics and clinical indicators
Weight was measured with a roman type Tanita BC533 scale, height was measured using a SECA 406 Stadiometer, with both measures calculate the BMI. The waist and hip circumferences were measured using a SECA 206 tape according to the technique of Lohman et al. [21]. The percentage of fat mass was determined by bioimpedance using a Tanita BC533 instrument. Systolic and diastolic blood pressures were measured in a sitting position after ten minutes of rest. All measurements were conducted in duplicate by qualified personnel.
Blood samples were withdrawn after 12 h of fasting to quantify the circulating levels of serum glucose, lipids, insulin, high-sensitivity C-reactive protein (hs-CRP) and adiponectin. Serum glucose (coefficient of variation=5.6%) and lipid profile were measured using enzymatic methods with a chemical analyzer (Auto KEM II, Kontrollab, Italy). The coefficient of variation was 4.3% for total cholesterol, 6% for triglycerides, and 3% for high-density lipoprotein cholesterol (HDL-C). The low-density lipoprotein cholesterol (LDL-C) was calculated using the Friedwald formula. Serum insulin was measured by radioimmunoassay with a commercial kit (BI-Insulin-IRMA, Cisbio Bioassay, Codolet, France), with an intra-assay variation coefficient of 3.9%. The hs-CRP was quantified by means of hs- CRP ELISA Kit (ALPCO Immunodiagnostic AG, Stubenwald- Allee, Bensheim) with a 5.5% variation coefficient. For the quantification of adiponectin, a radioimmunoassay kit (Millipore, St. Charles, Missouri, USA) with a variation coefficient of 3.6% was used; whereas the Homoeostatic Model Assessment was used to estimate insulin resistance (HOMA-IR) [22].
Metabolic phenotype definition
The unhealthy phenotype was categorized in the presence of ≥ 3 criteria: 1) systolic blood pressure ≥ 130 mmHg and/or a diastolic blood pressure ≥ 85 mmHg; 2) triglycerides: >150 mg/dL; 3) HDL-C: in men <40 mg/dL and in women, <50 mg/dL; 4) fasting glucose > 100 mg/dL, and waist circumference: in men >102 cm and women >88 cm, and by HOMA-IR ≥ 5th percentile insulin sensibility according to criteria described by Meigs et al. [1]. Using the metabolic phenotype and BMI, we formed 4 groups: 1) metabolically healthy non-obese (MHNO), 2) metabolically unhealthy nonobese (MUNO), 3) metabolically healthy obese (MHO) and 4) metabolically unhealthy obese (MUO).
The Visceral Adiposity index was calculated using the formula obtained by Amato et al. [2]:
Men: [WC/39.68+(1.88*BMI)] x (Triglycerides/1.03) x (1.31/ HDL-C)
Women: [WC/36.58+(1.89*BMI)] x (Triglycerides/0.81) x (1.52/HDL-C).
Statistical Analysis
The continuous variables are expressed as the mean ± standard deviation. The normality of the distribution was tested using the Kolmogorov-Smirnov’s test. The differences between the groups were analyzed using the independent ttest. The Pearson’s correlation was used to examine the relationship between VAI and metabolic variables.
To analyze the differences between VAI quartiles and the metabolic variable, we used one-way ANOVA and post-hoc test. Furthermore, a multiple regression analysis was conducted to evaluate the association between VAI with insulin levels, HOMA-IR and glucose, adjusted by sex and BMI. Using values of VAI quartile 4 (VAI >2.25 in women and >1.86 in men) and quartile 1 as reference performed a logistic regression analysis. To determine the diagnostic value of VAI to detect metabolic alterations, we constructed ROC curves. Nonparametric statistics are applied to the variables without normal distribution. Statistical significance was set at p<0.05. Data analyses were performed with the Statistical 6410 for Windows (Statsoft, Tucson AZ) statistical software and Number Cruncher Statistical System (NCSS) version (Kaysville, Utah).
Results
A total of 183 subjects (70% women and 30% men) with a mean age of 37 ± 7 years old were included. The characteristics of the normal weight and obese subject groups are shown in Table 1.
Table 1: Clinical and metabolic characteristics of individuals according to BMI.
| Variable |
Normal weight (n=82) |
Obesity grade I (n=101) |
|
| Mean ± SD |
Mean ± SD |
T Student |
p |
| Age (years) |
37.6 ± 6.4 |
39.6 ± 6.8 |
1.9 |
0.04 |
| Weight (kg) |
58.8 ± 9.1 |
81.6 ± 10.6 |
15.3 |
<0.001 |
| Height (m) |
1.6 ± 0.1 |
1.6 ± 0.1 |
-1.6 |
0.09 |
| BMI (kg/m2) |
22.7 ± 1.9 |
32.5 ± 2 |
33.6 |
<0.001 |
| WC (cm) |
79.1 ± 8.2 |
100.7 ± 8 |
18.2 |
<0.001 |
| HC (cm) |
95.5 ± 5.4 |
111.2 ±12.1 |
10.9 |
<0.001 |
| Fat mass (%) |
25.1 ± 7.1 |
39.2 ± 6.1 |
14.4 |
<0.001 |
| SBP (mmHg) |
108 ± 8.6 |
114 ± 12 |
4.5 |
<0.001 |
| DBP (mmHg) |
72 ± 7.2 |
78 ± 7 |
4.9 |
<0.001 |
| Glucose (mg/dL) |
85 ± 11 |
91.5 ± 11 |
3.9 |
<0.001 |
| Total cholesterol (mg/dL) |
170.5 ± 27.5 |
175.4 ± 28.6 |
1.2 |
0.24 |
| Triglycerides (mg/dL) |
135 ± 44 |
150 ± 54 |
2 |
0.04 |
| HDL-C (mg/dL) |
61 ± 9 |
52 ± 7 |
-1.5 |
0.12 |
| LDL-C (mg/dL) |
83 ± 24.6 |
87.5 ± 24.7 |
1.2 |
0.21 |
| hs-CRP (mg/L) |
1.1(0.6-1.5) |
3.1(1.7-5.4) |
4.8 |
<0.001 |
| Insulin (pmol/L) |
6.3(4.3-15.5) |
9.8(7.1-13.8) |
2.3 |
0.05 |
| HOMA-IR |
1.3(0.8-3.2) |
2.1(1.5-3.36) |
2.3 |
0.02 |
| Adiponectin (μg/mL) |
9.9(4.9-17.4) |
7.4(4.6-13.8) |
2.3 |
0.05 |
| VAI |
1.4(1.1-2.1) |
1.8(1.4-2.2) |
3 |
<0.01 |
BMI: Body Mass Index; WC: Waist Circumference; HC: Hip Circumference; SBP: Systolic Blood Pressure; DBP: Diastolic Blood Pressure; HDL-C: High Density Lipoprotein Cholesterol; LDL-C: Low Density Lipoprotein Cholesterol; hs-CRP: High Sensitivity C-reactive Protein; HOMA-IR: Homeostasis Model Assessment Insulin Resistance; VAI: Visceral Adiposity Index.
The non-parametric variables were expressed as median (25-75th percentile) and differences between groups were examined using the U Mann-Whitney test.
The metabolic non-healthy phenotype was present in 25% of the total participants; from them, 10% of the subjects had the MUNO phenotype and 15% of the individuals had the MUO phenotype. The 75% remaining corresponded to the metabolic healthy phenotype; 35% to the MHNO phenotype and 40% to the MHO phenotype. The characteristics of the participants according to BMI and the metabolic phenotype are described in Table 2. The individuals with MUNO phenotype showed higher serum triglycerides, insulin levels, HOMA-IR than the MHNO individuals. In contrast, the individual with MHO phenotype showed lower serum glucose, triglycerides, insulin, hs-CRP levels, systolic and diastolic blood pressure, HOMA-IR than the individuals with MUO phenotype (Table 2). Interestingly, MUNO and MUO individuals had higher VAI values than MHNO and MHO individuals.
Table 2: Clinical and metabolic characteristics of subjects according to BMI and metabolic phenotype. Table 2 Clinical and metabolic characteristics of subjects according to BMI and metabolic phenotype. Table 2 Clinical and metabolic characteristics of subjects according to BMI and metabolic phenotype.
| Variable |
MHNO (n=63) |
MUNO (n=19) |
|
MHO (n=73) |
MUO (n=28) |
|
| Mean ± SD |
Mean ± SD |
T |
P |
Mean ± SD |
Mean ± SD |
T |
P |
| Age (years) |
37.8 ± 7 |
36.8 ± 5.6 |
0.6 |
0.53 |
38.8 ± 6.3 |
41.4 ± 7.9 |
1.7 |
0.08 |
| Weight (kg) |
58.9 ± 8 |
58.7 ± 12.1 |
0.06 |
0.94 |
81.9 ±10.9 |
80.7 ± 9.7 |
-0.5 |
0.6 |
| Height (meters) |
1.6 ± 0.1 |
1.6 ± 0.1 |
0.1 |
0.95 |
1.6 ± 0.1 |
1.6 ± 0.1 |
-1.4 |
0.14 |
| BMI (kg/m2) |
22.7 ± 2 |
22.6 ± 2.3 |
0.3 |
0.75 |
32.3 ± 2.1 |
33 ± 1.9 |
1.7 |
0.09 |
| WC (cm) |
79.1 ± 7 |
78.8 ± 10.6 |
0.1 |
0.89 |
99.9 ± 7.9 |
103 ± 7.4 |
1.8 |
0.07 |
| HC (cm) |
95.9 ± 5 |
94.1 ± 5.6 |
1.3 |
0.19 |
110.3 ± 13.6 |
113.6 ± 6.5 |
1.2 |
0.22 |
| Fat mass (%) |
25.4 ± 7 |
24.2 ± 7 |
0.7 |
0.51 |
39 ± 6.8 |
39.7 ± 3.8 |
0.5 |
0.56 |
| SBP (mmHg) |
108 ± 9 |
109 ± 6 |
-0.5 |
0.58 |
113 ± 12 |
119 ± 12 |
2.3 |
0.02 |
| DBP (mmHg) |
71 ± 8 |
77 ± 5 |
-1.7 |
0.08 |
77 ± 7 |
81 ± 7 |
2.5 |
0.01 |
| Glucose (mg/dL) |
84.5 ± 11 |
86.6 ± 12 |
-0.7 |
0.47 |
88.5 ± 9 |
99 ± 13 |
4.7 |
<0.01 |
| Total cholesterol (mg/dL) |
168 ± 25 |
179 ± 33 |
-1.6 |
0.12 |
174 ± 27 |
179 ± 32 |
0.7 |
0.46 |
| Triglycerides (mg/dL) |
128.5 ± 38 |
156 ± 55 |
-2.5 |
0.01 |
139 ± 45 |
176 ± 66 |
3.2 |
<0.01 |
| HDL-C (mg/dL) |
61.5 ± 7 |
59.5 ± 13 |
0.9 |
0.38 |
59.6 ± 6.6 |
58.4 ± 8 |
-0.7 |
0.47 |
| LDL-C (mg/dL) |
81 ± 30 |
88 ± 32 |
-1.1 |
0.27 |
2.24 ± 0.59 |
2.20 ± 0.75 |
0.2 |
0.79 |
| hs-CRP (mg/L) |
1.5(0.6-1.8) |
1.3(0.6-1.4) |
1.15 |
0.25 |
3(1-5.2) |
3.3(1-7.5) |
-2.7 |
<0.01 |
| Insulin (pmol/L) |
5.4 (4-7) |
21 (18-24) |
-12.4 |
<0.01 |
8 (6.5-10.6) |
18 (14.5-22.2) |
10.1 |
<0.001 |
| HOMA-IR |
1.3 ± 1 |
4.4 ± 1.1 |
-12.4 |
<0.01 |
1.9 ± 0.7 |
4.7 ± 2 |
10.4 |
<0.001 |
| Adiponectin (μg/mL) |
12.3 ± 9 |
11.5 ± 9.1 |
0.3 |
0.75 |
10.2 ± 7.7 |
8.9 ± 5.7 |
-0.8 |
0.41 |
| VAI |
1.5 ± 1 |
2.0 ± 0.9 |
-2.5 |
0.01 |
1.8 ± 0.6 |
2.4 ± 1.2 |
3.5 |
<0.01 |
MHNO: Metabolically Healthy Non-Obese; MUNO: Metabolically Unhealthy Non-Obese; MHO: Metabolically Healthy Obese; MUO: Metabolically Unhealthy Obese; BMI: Body Mass Index; WC, Waist Circumference; HC: Hip Circumference; SBP: Systolic Blood Pressure; DBP: Diastolic Blood Pressure; HDL-C: High Density Lipoprotein cholesterol; LDL-C: Low Density Lipoprotein cholesterol; hs-CRP: High sensitivity C-reactive protein; HOMA-IR: Homeostasis Model Assessment Insulin Resistance; VAI: Visceral Adiposity Index.
The non-parametric variables were expressed as median (25-75th percentile) and differences between groups were examined using the U Mann-Whitney test.
The VAI value was analyzed by quartiles to examine the relationship of the clinical and metabolic characteristics according to the VAI values (Table 3). The individuals in the first quartile had a lower BMI, fat mass and triglycerides levels than the other three quartiles. In contrast, the individuals of the fourth quartile had higher diastolic blood pressure (DBP), glucose, insulin, HOMA-IR and lower HDL-C levels than the other three quartiles. In addition, total cholesterol was elevated and adiponectin levels were decreased in the fourth quartile in comparison with the first and second quartiles.
Table 3: Clinical and metabolic characteristics of individuals according to the VAI quartiles.
| Variable |
Q1 (n=46) |
Q2 (n=46) |
Q3 (n=44) |
Q4 (n=47) |
ANOVA |
|
| |
Mean ± SD |
Mean ± SD |
Mean ± SD |
Mean ± SD |
F |
p |
Post-Hoc |
| Age (years) |
38.1 ± 6.9 |
39.6 ± 7.3 |
38.1 ± 5.9 |
38.9 ± 6.6 |
0.5 |
0.65 |
|
| Weight (kg) |
65.9 ± 16.9 |
71.7 ± 13.4 |
73.3 ± 14.9 |
74.7 ± 13.8 |
3.1 |
0.02 |
1(3,4) |
| BMI (kg/m2) |
23.5(22-30) |
28.5 ± 5 |
28.5 ± 5.1 |
29.7 ± 4.7 |
5.4 |
<0.01 |
1(2,3,4) |
| WC (cm) |
83.9 ± 14.2 |
91 ± 12.3 |
93.2 ± 12.9 |
96 ± 11.5 |
7.6 |
<0.001 |
1(4) |
| HC (cm) |
101.4 ± 11 |
103.2 ± 16.8 |
106 ± 10 |
106 ± 10 |
1.6 |
0.18 |
|
| Fat mass (%) |
28.9 ± 11.6 |
34.6 ± 7.9 |
33.6 ± 9.7 |
34.4 ± 7.8 |
3.6 |
0.01 |
1(2,3,4) |
| SBP (mmHg) |
110 ± 10 |
111 ± 11 |
112 ± 11 |
112 ±13 |
1.7 |
0.62 |
|
| DBP (mmHg) |
73 ± 8 |
75 ± 8 |
74 ± 7 |
79 ± 7.3 |
7.4 |
<0.001 |
4(1,2,3) |
| Glucose (mg/dL) |
84 ± 9 |
87 ± 11 |
88 ± 11 |
95 ± 13 |
7.9 |
<0.01 |
4(1,2,3) |
| Total cholesterol (mg/dL) |
167 ± 25 |
168 ± 23 |
175 ± 32 |
182 ± 30 |
3.1 |
0.02 |
4(1,2) |
| Triglycerides (mg/dL) |
97 ± 18.5 |
121 ± 16 |
151 ± 23 |
203 ± 51 |
15 |
<0.001 |
1(2,3,4) |
| HDL-C (mg/dL) |
66 ± 8 |
61 ± 5.5 |
60 ± 6 |
54 ± 6 |
27 |
<0.001 |
4(1,2,3) |
| LDL-C (mg/dL) |
82 ± 20 |
83 ± 20 |
86 ± 31 |
90 ± 26 |
0.9 |
0.41 |
|
| hs-CRP (mg/L) |
2.1 ± 1.8 |
2.4 ± 3 |
3.2 ± 3 |
3.4 ± 3.3 |
0.9 |
0.44 |
|
| Insulin (pmol/L) |
9.3 ± 6.8 |
9.8 ± 5.9 |
9.5 ± 6.2 |
14.2 ± 8.1 |
5.4 |
<0.001 |
4(1,2,3) |
| HOMA-IR |
1.9 ± 1.4 |
2.1 ± 1.3 |
2 ± 1.3 |
3.4 ± 2.2 |
8.8 |
<0.001 |
4(1,2,3) |
| Adiponectin (μg/mL) |
13.6(6-17) |
10.6(6-18) |
6.2(4.5-14) |
5.5(3-11.5) |
12 |
0.03 |
4(1,2) |
BMI: Body Mass Index; WC: Waist Circumference; HC: Hip Circumference; SBP: Systolic Blood Pressure; DBP: Diastolic Blood Pressure; HDL-C: High Density Lipoprotein Cholesterol; LDL-C: Low Density Lipoprotein Cholesterol, hs-CRP: High sensitivity C-Reactive Protein; HOMA-IR: Homeostasis Model Assessment Insulin Resistance, VAI: Visceral Adiposity Index
The non-parametric variables were expressed as median (25-75th percentile) and differences between groups were examined using the Kruskal-Wills test.
A multiple regression analysis showed associations of VAI values with glucose (β=2.543, p=0.01), adiponectin (β=-2.66, p<0.01) and HOMA-IR (β=3.33, p=0.001) levels adjusted by sex and BMI. In a logistic regression analysis using the cut-offs of quartile 4, VAI >2.25 in women and >1.86 in men exhibited a strong association with high glucose and HOMA-IR by low adiponectin concentrations (Table 4). In addition, ROC analysis revealed that the optimal VAI cutoff for determining glucose concentrations >100 mg/dL were the values in the quartile 4 of VAI, with area under the curve of 0.83 (IC95% 0.66-0.92, p=0.0009) in men and 0.71 (IC95%=0.58-0.81, p=0.0016) in women; for HOMA-IR 0.78 (IC95% 0.64-0.93, p=0.006) in men, no significant in women; for adiponectin concentration 0.69 (IC95% 0.58-0.86, p=0.046) in men and 0.91 (IC95% 0.86-0.94, p<0.001) in women (Figures 1-3).
Table 4: Odds ratios (ORs) of metabolic variables associated with VAI quartiles.
| VAI |
Variable |
OR (IC95%) |
p |
| Glucose |
| Q1 |
1.0 (reference) |
|
| Q2 |
4.3 (0.5-7) |
0.201 |
| Q3 |
8.5 (1.0-7.3) |
0.049 |
| Q4 |
17 (2.1-20) |
0.007 |
| HOMA-IR |
| Q1 |
1.0 (reference) |
|
| Q2 |
1.5(0.5-4.5) |
0.42 |
| Q3 |
1.5(0.15-2) |
0.37 |
| Q4 |
4.5(1.7-12) |
0.002 |
| Adiponectin |
| Q1 |
1.0 (reference) |
|
| Q2 |
1.6((0.7-3.7) |
0.28 |
| Q3 |
3.3(1.4-7.8) |
0.007 |
| Q4 |
3.6(1.5-8.6) |
0.003 |
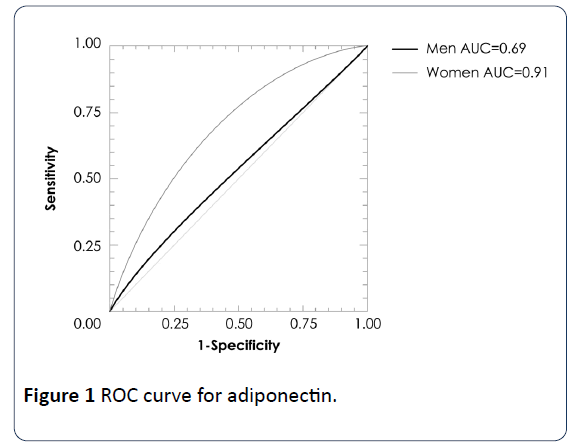
Figure 1:ROC curve for adiponectin.
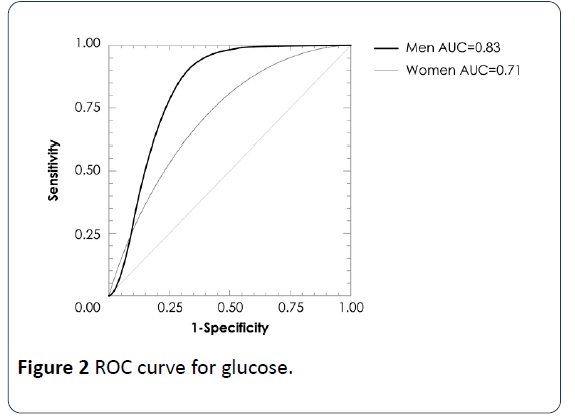
Figure 2:ROC curve for glucose.
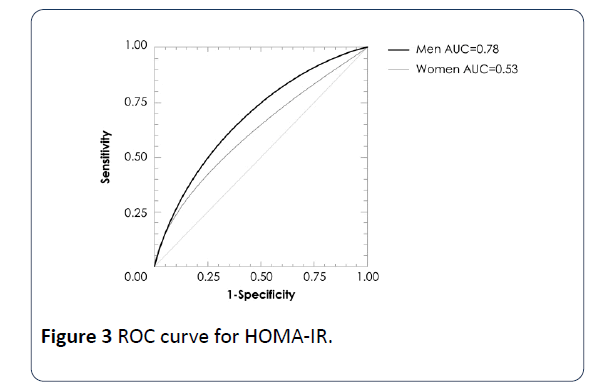
Figure 3:ROC curve for HOMA-IR.
Discussion
In our study group, we found four groups according to their metabolic state, which includes MHNO, MUNO, MUO and MHO. The prevalence of MHO subjects was 40% similar to that previously reported [6,23]. This obese subject group seems to be relatively protected against the worsening of metabolic health since the subjects of this group do not present metabolic disturbance, dyslipidemia, insulin resistance, impaired glucose metabolism and overt type 2 diabetes [4,24,25]. Appleton et al. [26] have demonstrated that MHO is a transient phenotype after 5.5–10.3 years of follow-up [16] and it is still under debate whether MHO individuals are really healthy since several recently performed meta-analysis of prospective cohort studies have shown that the majority of MHO subjects have a markedly increased risk of developing type 2 diabetes [25] and cardiovascular disease [26]. MHO subjects are characterized by lower visceral fat area, less fat accumulation in the liver and skeletal muscle, smaller adipocytes, fewer macrophages infiltration and inflammation in the adipose tissue [24,27]. In our study, even though MHO subjects had comparable total body fatness, they had significantly lower triglycerides levels and systolic blood pressure and DBP than MUO subjects. Several studies have shown that MHO subjects present a favorable blood lipid profile, as evidenced by lower triglycerides levels and higher HDL-C [6,7], however, the results on blood pressure in MHO individuals are less consistent than those observed for lipids [28], since not all obese subjects of multiethnic origin are at similar risk for developing hypertension and other cardio metabolic risk factors [28]. In accordance with previous reports, MHO subjects from our study showed lower fasting glucose, insulin levels and insulin resistance than the MUO group [6-8]. Several studies have reported levels similar to adiponectin in MHO subjects of those found in normal BMI subjects [8,29] however, we found similar adiponectin levels among MHO and MUO groups, but the hs-CRP levels were significantly lower in MHO subjects than in MUO subjects, as previously demonstrated by Karelis et al. [30].
We found that individuals with normal weight also present metabolic alterations. This condition has been previously recognized by Ruderman et al. [31] who proposed the concept of metabolically obese but normal-weight individual (MONW or MUNO) [30]. They are characterized by hyperinsulinism and insulin resistance, and are vulnerable to type 2 diabetes and cardiovascular disease, even though they are not obese. In our study, the overall prevalence of MUNO subjects was 10%, the VAI index and other metabolic variables such as triglycerides were also elevated in this group. However, there is a different prevalence in the Korean population; in men, it was 14.2% and 12.9% for women [31]. By contrast, in Chinese Beijing women, the prevalence was 8.78 and 6.62% in men [32]. In addition, both population, weight, BMI and waist circumference were significantly increased in MUNO subjects.
In obese people, their body fat distribution and disease risk may vary. It is noted that the accumulation of visceral adipose tissue, as opposed to subcutaneous fat, increases the risk of developing metabolic disorders [12]. VAI includes both anthropometric and metabolic variables; therefore, it is a useful tool because it provides information regarding visceral adipose tissue and insulin resistance, and has recently been suggested as a surrogate of visceral adipose [33]. In our study, we found that MHO subjects had a lower VAI than MUO subjects, and surprisingly MUNO subjects had higher VAI values than MHNO subject. We also found that a value of VAI >2.25 in women and >1.86 in men (cut-off quartile 4) determines an elevated DBP, serum glucose, insulin, insulin resistance, and lower HDL-C and adiponectin levels. These biomarkers also are components of the metabolic syndrome [23]. In other studies, VAI has been associated with the incident metabolic syndrome in obstructive sleep apnea patients [34] and with adiponectin concentrations in patients with type 2 Diabetes [20]. It has also been observed that VAI increases gradually across the HOMA-IR quartiles in a population without central obesity [35]. In addition, we found that these cut-offs of VAI are strong predictors of increased serum glucose, HOMA-IR, and decreased adiponectin concentrations. Recently, the inverse association of adiponectin with abdominal visceral fat and HOMA2-IR has been reported in Japanese Americans [36].
VAI has been proposed as an appropriate candidate to surrogate measure for predicting unfavorable metabolic outcomes in MHO individuals more than WC, possibly due to a more accurate assessment of visceral adiposity [18]. However, in boys with an age of 11.9 ± 3.3 years and a BMI of 19.8 ± 5.6 kg/m2, VAI was inferior to BMI and WC, but was the only index independently associated with glucose [37]. On the other hand, VAI was associated with an increased risk of incident cardiovascular disease among women, but among men, after adjustment for established cardiovascular disease risk factors, VAI was no longer associated with increased risk of cardiovascular disease [38]. Although VAI is not a diagnostic tool for cardiovascular and cerebrovascular events, the simplicity of WC and BMI measurement and triglycerides and HDL-C assessment make it an easily applicable index for evaluation of visceral fat dysfunction [19]. VAI might therefore, be a useful tool in daily clinical practice and in population studies for the assessment of cardio metabolic risk associated with visceral obesity [19]. Despite the sample size of our study, we demonstrated the applicability of VAI to a population with an elevated prevalence of obesity in the discrimination of metabolic risk using quartile 4 of VAI.
Conclusion
From the total subjects, 75% had the metabolic healthy phenotype; 35% of the MHNO phenotype and 40% of the MHO phenotype. The remaining 25% were metabolic nonhealthy subjects.
The MUNO subjects showed higher serum triglycerides, insulin levels, HOMA-IR than the MHNO subjects. MHO individual showed lower serum glucose, triglycerides, insulin, hs-CRP levels, systolic and diastolic blood pressure, HOMA-IR than with the MUHO subjects.
The MUNO and MUO subjects had higher VAI values than MHNO and MHO individuals. In logistic regression analysis using the cut-offs of quartile 4, VAI >2.25 in women and >1.86 in men exhibited a strong association with high glucose and HOMA-IR and low adiponectin concentrations. ROC analysis using the cut-offs of quartile 4, determined glucose concentrations >100 mg/dL with area under the curve of 0.83 (IC95% 0.66-0.92, p=0.0009) in men and 0.71 (IC95%=0.58-0.81, p=0.0016) in women; for HOMA-IR 0.78 (IC95% 0.64-0.93, p=0.006) only in men; for adiponectin concentration 0.69 (IC95% 0.58-0.86, p=0.046) in men and 0.91 (IC95% 0.86-0.94, p<0.001) in women. Therefore, VAI is a useful indicator to evaluate the metabolic risk both of nonobese and obese individuals.
23549
References
- Meigs JB, Wilson PW, Fox CS, Vasan RS, Nathan DM, et al. (2006) Body mass index, metabolic syndrome, and risk of type 2 diabetes or cardiovascular disease. J Clin Endocrinol Metab 91: 2906-2912.
- Amato MC, Giodano C, Galia M, Criscimanna A, Vitabile S, et al. (2010) Visceral Adiposity Index. Diabetes Care 33: 920-922.
- Kelly T, Yang W, Chen CS, Reynolds K, He J (2008) Global burden of obesity in 2005 and projections to 2030. Int J Obes 32: 1431-1437.
- Mokdad AH, Ford ES, Bowman BA, Dietz WH, Vinicor F, et al. (2003) Prevalence of obesity, diabetes, and obesity-related health risk factors. JAMA 289: 76-79.
- Bluher M (2010) The distinction of metabolically ‘healthy’ from ‘unhealthy’ obese individuals. Curr Opin Lipidol 21: 38-43.
- Phillips CM (2013) Metabolically healthy obesity: definitions, determinants and clinical implications. Rev Endocr Metab Disord 14: 219-227.
- Brochu M, Tchernof A, Dionne IJ, Sites CK, Eltabbakh GH, et al. (2001) What are the physical characteristics associated with a normal metabolic profile despite a high level of obesity in postmenopausal women? J Clin Endocrinol Metab 86: 1020-1025.
- Aguilar-Salinas CA, Garcia EG, Robles L, Riano D, Ruiz-Gomez DG, et al. (2008) High adiponectin concentrations are associated with the metabolically healthy obese phenotype. J Clin Endocrinol Metab 93: 4075-4079.
- Li Z, Guo X, Liu Y, Zhang N, Chang Y, et al. (2016) Metabolism rather than obesity is associated with ischemic stroke: a cross-sectional study in rural Northeastern China. Springerplus 5: 1419.
- Primeau V, Coderre L, Karelis AD, Brochu M, Lavoie ME, et al. (2011) Characterizing the profile of obese patients who are metabolically healthy. Int J Obes 35: 971-981.
- Wildman RP, Muntner P, Reynolds K, McGinn AP, Rajpathak S, et al. (2008) The obese without cardiometabolic risk factor clustering and the normal weight with cardiometabolic risk factor clustering: prevalence and correlates of 2 phenotypes among the US population (NHANES 1999–2004). Arch Intern Med 168: 1617-1624.
- Fox CS, Massaro JM, Hoffmann U, Pou KM, Maurovich-Horvat P, et al. (2007) Abdominal visceral and subcutaneous adipose tissue compartments: association with metabolic risk factors in the Framingham Heart Study. Circulation 116: 39-48.
- Park YW, Zhu S, Palaniappan L, Heshka S, Carnethon MR, et al. (2003) The metabolic syndrome: prevalence and associated risk factor findings in the US population from the Third National Health and Nutrition Examination Survey, 1988-1994. Arch Intern Med 163: 427-436.
- Seo MH, Rhee EJ (2014) Metabolic and cardiovascular implications of a metabolically healthy obesity phenotype. Endocrinol Metab 29: 427-434.
- Samocha-Bonet D, Dixit VD, Kahn CR, Leibel RL, Lin X, et al. (2014) Metabolically healthy and unhealthy obese-the 2013 Stock Conference report. Obes Rev 15: 697-708.
- Hwang YC, Hayashi T, Fujimoto WY, Kahn SE, Leonetti DL, et al. (2015) Visceral abdominal fat accumulation predicts the conversion of metabolically healthy obese subjects to an unhealthy phenotype. Int J obes 39: 1365-1370.
- Amato MC, Pizzolanti G, Torregrossa V, Misiano G, Milano S, et al. (2014) Visceral adiposity index (VAI) is predictive of an altered adipokine profile in patients with Type 2 Diabetes. PLoS ONE 9: e91969.
- Amato MC, Pizzolanti G, Torregrossa V, Misiano G, Milano S, et al. (2014) Visceral adiposity index (VAI) is predictive of an altered adipokine profile in patients with Type 2 Diabetes. PLoS ONE 9: e91969.
- Lohman TG, Roche AF, Martorell R (1988) Anthropometric standardization reference manual. Human Kinetics: Champane Illinois.
- Matthews D, Hosker J, Rudenski A, Naylor BA, Treacher DF, et al. (1985) Homeostasis model assessment: insulin resistance and β-cell function from fasting plasma glucose and insulin concentrations in man. Diabetologia 28: 412-419.
- Stefan N, Haring HU, Hu FB, Schulze MB (2013) Metabolically healthy obesity: epidemiology, mechanisms, and clinical implications. Lancet Diabetes Endocrinol 1: 152-162.
- Bell JA, Kivimaki M, Hamer M (2014) Metabolically healthy obesity and risk of incident type 2 diabetes: a meta-analysis of prospective cohort studies. Obes Rev 1: 152-162.
- Eckel N, MeidtnerK, Kalle-Uhlmann, Stefan N, Schulze MB (2016) Metabolically healthy obesity and cardiovascular events: a systematic review and meta-analysis. Eur J Prev Cardiol 23: 956-966.
- Klöting N, Fasshauser M, Dietrich A, Kovacs P, Schon MR, et al. (2010) Insulin-sensitive obesity. Am J Physiol Endocrinol Metab 299: e506-515.
- Appleton SL, Seaborn CJ, Visvanathan R, Hill CL, Gill TK, et al. (2013) Diabetes and cardiovascular disease outcomes in the metabolically healthy obese phenotype: a cohort study. Diabetes Care 36: 2388-2394.
- Genelhu VA, Celoria BM, Duarte SF, Cabello PH, Francischetti EA et al. (2009) Not all obese subjects of multiethnic origin are at similar risk for developing hypertension and type-2 diabetes. Eur J Intern Med 20: 289-295.
- Weiss R, Taksali SE, Dufour S, Yeckel CW, Papademetris X, et al. (2005) The “obese insulin-sensitive” adolescent: importance of adiponectin and lipid partitioning. J Clin Endocrinol Metab 90: 3731-3737.
- Lee SH, Ha HS, Park YJ, Lee JH, Yim HW, et al. (2011) Identifying metabolically obese but normal-weight (MONW) individuals in a nondiabetic Korean population: the Chungju Metabolic disease Cohort (CMC) study. Clin Endocrinol 75: 475-481.
- Karelis AD, Faraj M, Bastard JP, St-Pierre DH, Brochu M, et al. (2005) The metabolically healthy but obese individual presents a favorable inflammation profile. J Clin Endocrinol Metab 90: 4145-4150.
- Ruderman NB, Schneider SH, Berchtold P (1981) The metabolically-obese, normal-weight individual. Am J Clin Nutr 34: 1617-1621.
- Liu PJ, Ma F, Lou HP, Chen Y (2016) Visceral Adiposity Index Is Associated with Pre-Diabetes and Type 2 Diabetes Mellitus in Chinese Adults Aged 20-50. Ann Nutr Metab 68: 235-243.
- Zhang Y, Fu J, Yang S, Yang M, Liu A, et al. (2017) Prevalence of metabolically obese but normal weight (MONW) and metabolically healthy but obese (MHO) in Chinese Beijing urban subjects. Biosci Trends 11: 418-426.
- Chen GP, Qi J-Ch, Wang BY, Lin X, Zhang XB, et al. (2016) Applicability of adiposity index in predicting metabolic syndrome in adults with obstructive sleep apnea: a cross-sectional study. BMC Pulmonary 16: 37.
- Ji B, Qu H, Wang H, Deng H (2017) Association between the visceral adiposity index and homeostatic model assessment of insulin resistance in participants with normal waist circumference. Angiology 68: 716-721.
- Han SJ, Boyko EJ, Fujimoto WY, Kahn SE, Leonetti DL (2017) Low plasma adiponectin concentrations predict increases in visceral adiposity and insulin resistance. J Clin Endocrinol Metab 102: 4626-4633.
- Al-Daghri NM, Al-Attas OS, Alokail M, Alkharfy K, Wani K, et al. (2014) Does visceral adiposity index signify early metabolic risk in children and adolescents?: association with insulin resistance, adipokines, and subclinical inflammation. Pediatr Res 75: 459-463.
- Mohammadreza B, Farzad H, Davoud K, Fereidoun AF (2012) Prognostic significance of the complex "Visceral Adiposity Index" vs. simple anthropometric measures: Tehran lipid and glucose study. Cardiovasc Diabetol 11: 20.

