Keywords
Skin lesions; Melanoma; Segmentation; Border detection; multi-level decomposition; classification
Introduction
Recently, the melanoma becomes one of the most dangerous diseases. However, the mortality rate can be decreased by either earlier detection or better prevention. It is the eighth most frequently diagnosed cancer in the world and its survival rate is directly related to early diagnoses [1,2]. The development of computerized image analysis techniques is of paramount importance [5]. The first step in the computerized analysis of skin lesion images is the detection of the lesion border. The importance of border detection for the analysis is two-fold. First, the border structure provides important information for accurate diagnosis. Many clinical features such as asymmetry, border irregularity, and abrupt border cutoff are calculated from the border. Second, the extraction of other important clinical features such as atypical pigment networks, globules, and blue-white areas critically depends on the accuracy of border detection.
Thereforen, the separation of lesion from background is a critical early step in the analysis of dermatoscopic imagery. Although most segmentation methods are semi-automatic, requiring an interaction between the user and the software in order to establish the proper segmentation. Several techniques have been reported for segmentation of pigmented lesions, in dermatoscopic or conventional macro images. The most commonly used technique is not a straightforward task due to the great variety of lesions, low contrast between the lesion and the surrounding skin, irregular and fuzzy lesion borders skin types and presence of hair. In this purpose, a variety of image segmentation methods have been proposed, such as thresholding [3,4], and hybrid algorithms [5,6]. In this paper, an approach to border detection in dermoscopy images based on the multi-level decomposition and classification method is presented. The rest of the paper is organized as follows: In the First step, we present a multilevel decomposition methodology for edge characterization to improve the tumors classification. Therefore, the difficulty encountered in analyzing the skin tumors images is related to the interpretation of the tumor type. In the second step, the classification method of tumors skin lesions is presented. Finally, a comparison of some alternative segmentation methods proposed in the literature for image segmentation is performed.
Multi-level decomposition for analysis of the skin tumors
The wavelet decomposition is achieved in the Fourier domain. This decomposition combines both of the frequency appearance study and the time domain study. In this paper, we apply the 2D wavelet decomposition on image. Especially, we will interest on the discrete wavelet study.
In this part, we use the wavelet decomposition for multi-scale edge detection of skin tumors. For this, we use decomposition by a Gaussian filter.
First, the low-pass filter and high-pass filter obtained respectively by Gaussian and Gaussian derivative are used. The low-pass filters and the high-pass filters are defined by the following equation [7]:

In Fourier Domain the filters are defined by the following equation [7]:

Figure 1 illustrates the filters shape in the Fourier domain for different scales.
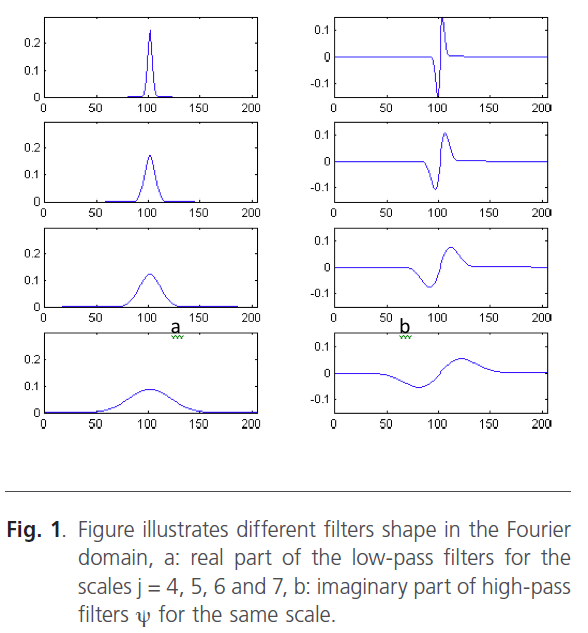
Figure 1: Figure illustrates different filters shape in the Fourier domain, a: real part of the low-pass filters for the scales j = 4, 5, 6 and 7, b: imaginary part of high-pass filters ψ for the same scale.
When the image is filtered on the scale, we will obtain a gradient vector according the x direction and according the y direction. Indeed, in low frequencies, the image is filtered and only the major variations are detected. Contrary, when the scale increases the high-pass filter takes the most important frequencies. In this situation, we can distinguish the smallest variations. Figure 3 represents the wavelet decomposition of the skin tumors illustrated in figure 2. The edge is obtained by thresholding operation to keep only the borders.
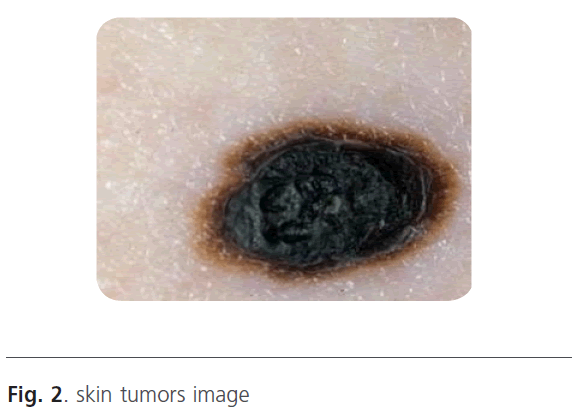
Figure 2: skin tumors image
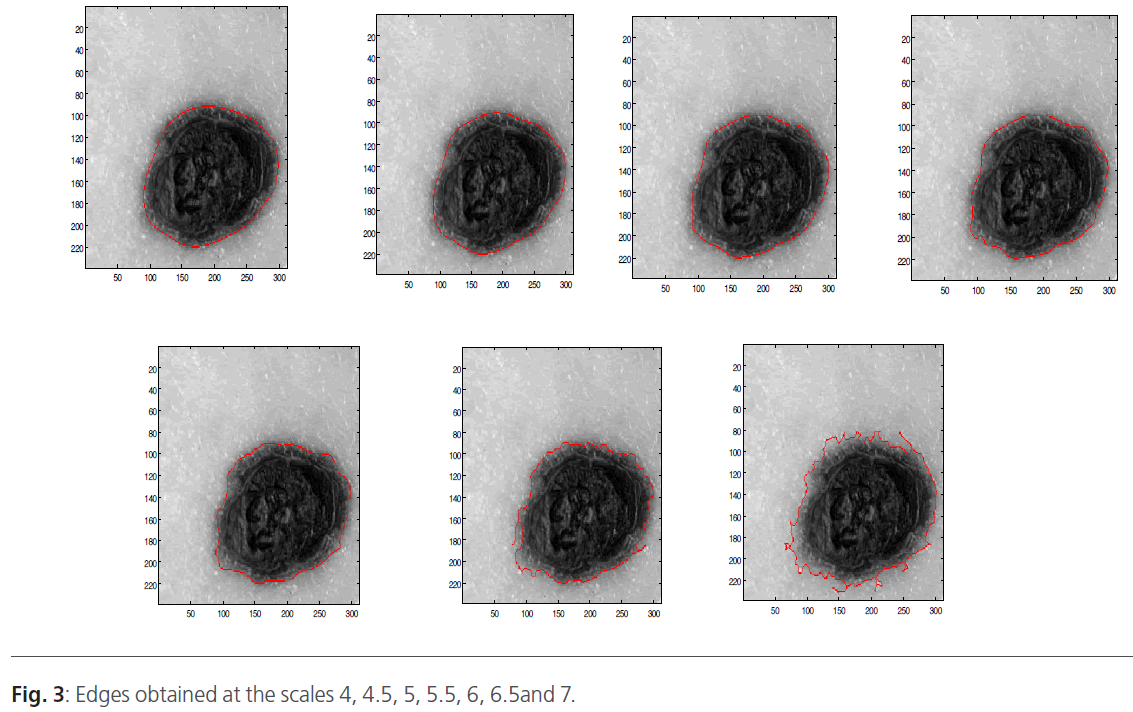
Figure 3: Edges obtained at the scales 4, 4.5, 5, 5.5, 6, 6.5and 7.
The wavelet decomposition result is a gradient vector (x, y) that depends on the scale. Indeed, we obtained an image contained only the edge. To improve the segmentation results, we use threshold operation to obtain only the tumor edge. Then, the different boundaries obtained at different scales are superimposed on the original image (Figure 2).
In our proposed method, the segmentation operation searched to locate only the lesion. The analysis level evolves according to the observation window. The first level provides a “coarse segmentation” and the system has only a vague vision of the lesion (the edge is drawn with the white color). The second level produces an edge which has a great correlation with the edge of the lesion (the edge is drawn with blue color). This level is corresponding to first level analysis. The third level is carried on smaller windows and it provides a finer edge (the edge is drawn with green color). In addition, the system is more sensitive to the local variations. Indeed, at this scale, we can observe the atypical pigment networks, globules, and blue-white. In the figure 4, we present the results that have been obtained.
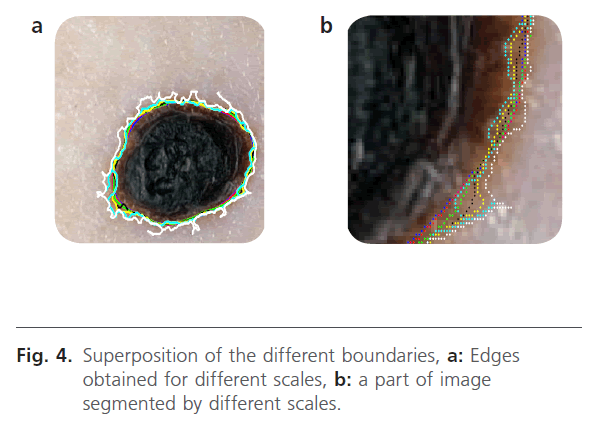
Figure 4: Superposition of the different boundaries, a: Edges obtained for different scales, b: a part of image segmented by different scales.
Segmentation by classification method
A second lesion segmentation method is described. The methodology containing four steps (figure 5):
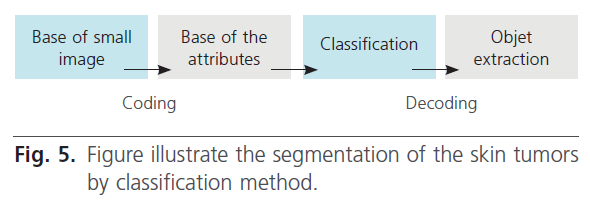
Figure 5: Figure illustrate the segmentation of the skin tumors by classification method.
Step 1: constitution of the training set.
Step 2: coding of small images.
Step 3: classification of this small images.
Step 4: presentation of the result.
Extraction of statistical descriptors
In the segmentation context, a selection of statistical descriptors is often simple to implement and its can give good segmentation results of skin tumors. In our paper, we have calculated some parameters such as mean, standard deviation, and variance for each small image.
Texture information has always been an important and efficient measure to estimate the structure, orientation, roughness, or regularity of various regions in a set of images that enables us to distinguish between different objects [8]. This is high-level processing that allows us to extract condensed numerical information that will serve as a basis for our classification. In Dermatoscopic images, we can estimate that the measure of the parameters texture between the melanoma and benign lesion is very different. Texture is a property of images that is related to their structural aspect. Haralick [9] have proposed a method to characterize texture in digital images using statistical parameters. This involves extracting 14 different textural parameters from a pre-computed cooccurrence matrix. The co-occurrence matrix is a representation of how pixels are related to their neighbors. It is a square matrix in which the number of columns is the number of grey levels present in the images. Each element (i, j) represents the number of co-occurrences between pixels of grey level i and pixels of grey level j. Co-occurrence matrix is when two pixels are neighbors in a given direction. Four main directions were used: 0, 45, 90, and 135 degrees, giving four different matrices. This definition of the co-occurrence matrix takes into account the orientation of the textural pattern. For example, the parameters computed using the matrix will differ according to the direction chosen in patterns such as lines or grids. However, in our images, the texture is clearly oriented; making oriented texture characterization pertinent. To remove the directional information, two simple methods are possible. The first is to compute the parameters on each of the four matrices and average them. The second is to sum in a single matrix the number of cooccurrences computed in each of the four usual directions, and then compute the parameters using the resulting matrix. We chose the second method for its simplicity and efficiency. The last step is the extraction of the statistical parameters from this single matrix [pij]. We selected 04 parameters of the 14 proposed by Haralick[9]. Parameters Extracted from Haralick’s Textural Features are:
Correlation: this attribute evaluate the color distribution on the lesion. It consists in describing the evaluation of the color level from the centroid towards the boundary of a lesion.
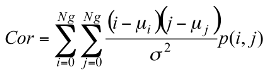 (1)
(1)
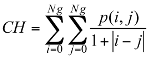
Colors homogeneity: this parameter indicates a measurement of the uniformity of the grey levels of the image.
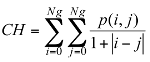 (2)
(2)
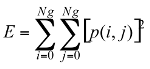
Energy: This parameter has a low value when the p(i, j) have very close values and a great value when the p(i, j) values are large.
 (3)
(3)
Contrast: This parameter has a important numerical value if the p(i, j) are concentrated except the diagonal.
 (4)
(4)
Classification
We have seen that, in addition to the difficulty of standardizing the diagnosis criteria and the wide variability of the encountered structures, discrimination of some types of lesions remains problematic. A system that allows analysis of tumors would be useful, especially for general practitioners who do not often observe melanomas (one case every four years on average) [10]. Such system is introduced in figure 5 which presents a general methodology based on segmentation of skin lesion. The previous steps allow a set of texture parameter to be calculated that will describe the tumor. In order to achieve the skin tumors images segmentation, a multilayer neural network with supervised learning algorithms is used [11].
Multilayer neural network
In the multilayer neural network the neurons are arranged by layer. The neurons of the first layer are related to external data and receive the input vector. The characteristic vector of an object is transmitted to all the neurons in the first layer of the neural network. The outputs of the neurons in this layer are then communicated to the neurons in the next layer, and so forth (figure 6). The last layer of the network is called the output layer, and the others are hidden layers [12].
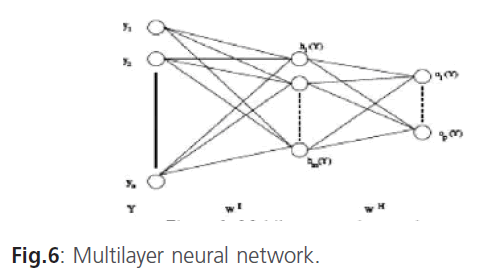
Figure 6: Multilayer neural network.
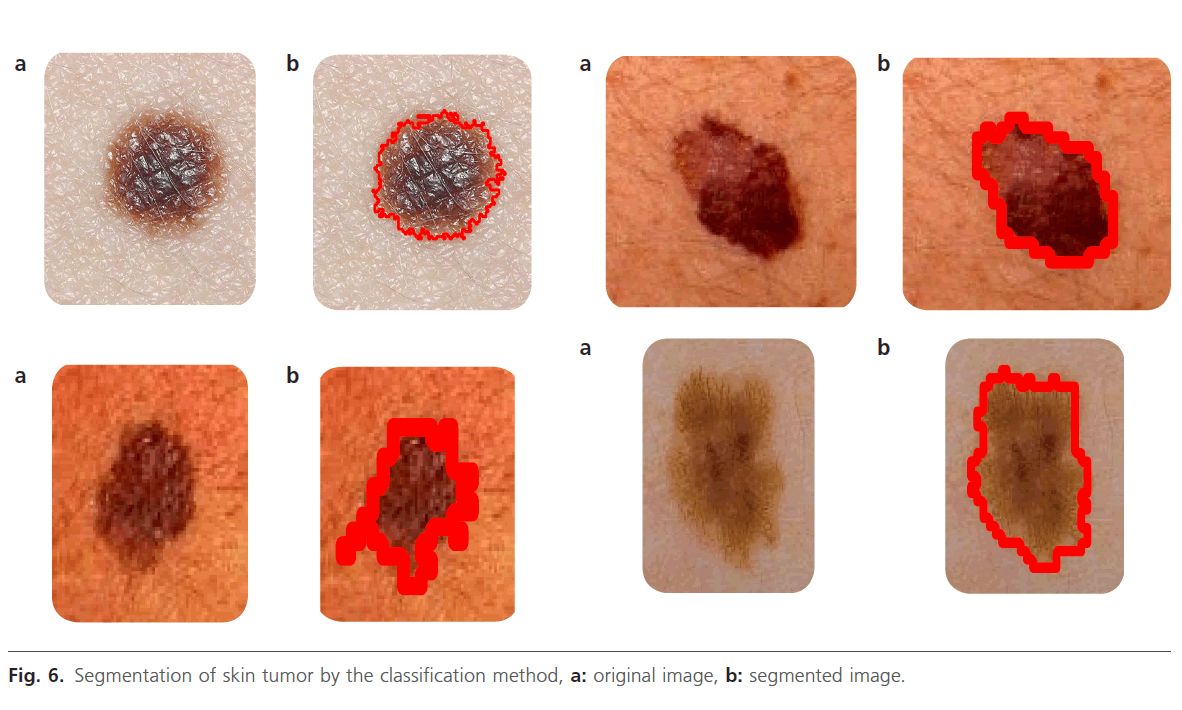
Figure 6: Segmentation of skin tumor by the classification method, a: original image, b: segmented image.
Y =(y1,.....yn) where n is the number of input attributes.
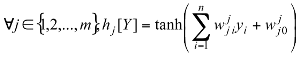
Where: h: Represents the activation function.  Is the weight vector connecting the input i and layer
  is the threshold of the hidden unit. m: is the number of units in the hidden layer.
The learning algorithm of multilayer networks, known as the back-propagation algorithm, requires that the activation functions of neurons are continuous and derivable [13,14]. In our case, the network architecture is defined by six entries units representing different attributes describing the tumors (Correlation, Colors, homogeneity, Energy, Contrast, etc…). The classifier differentiates between skin and tumors. In this case, the back-propagation algorithm minimizes squared error εr between the desired output and the input. There are a number of arbitrary parameters whose values must be defined for the network to get good performance, in particular, the number of hidden layers and the number of iterations. In our case, the errors εr are less than 0.1, the number of hidden layers is equal to 1 and the number of iterations which ensure the convergence of the network is equal to 1000 iterations
Results
In this application, we used over 60 images from Joaquim database [15] which has been validated by a survey of dermatologists in the CHUT (University hospital Centre, Tlemcen, Algeria). These selected images represent melanocytic lesions and benign lesion. The used images are in color with a 512 pixel x 486 pixel format. Each tumor of the selected image is located at the center and surrounded by the skin color. These lesions vary in size, shape, color, saturation and in most cases, the margin between the lesion and the surrounding skin is poorly defined clinically, and this introduces sometimes some error decisions. Therefore, the data are arranged according to a desired output calculated from previous steps which represent both cases. The size of the learning vector should be large and represent all data to ensure a good rate of classification.
To better validate the proposed method , we calculate the relationship between the intersection and the union of the initial contour (M) of the exudates segmented manually by a specialist and contours (A) obtained by the proposed method.

D: Resemblance degree (Rd) [16].
The objective of this operation is to quantify the resemblance degree of images which are classified like very good, average and bad (table 1).
The calculation of the resemblance degree is illustrated in table 1:
According to table 1, we can notice that all classified images as very good have a D (Rd) close to 1. Where M is a binary images such all pixels inside the curves produced by a clinical expert and A is the set of all lesion pixels labelled by a classification method. This studies gives the mean, standard deviation border error and shows the performance of the three segmentation methods (Thresholoding, region growing and classification method) according to the clinical evaluation (manual method). The classification method was evaluated by a dermatologist and rated in one of three possible labels: Vg-very good, Av-average, B-bad. The manual segmentation was the highest rated method, with all of images rated very good (Vg). The best of the automatic methods was the classification method, with 75% of images rated very good (Vg). However, the number of bad cases (B=4) was few for both this method. The segmentation methods like Thresholoding and region growing are semi-automatic, requiring an interaction between the user and the software in order to establish the proper segmentation. Classification method is adapted to this problem due to its simplicity, computational efficiency, and excellent performance on a variety of image domains.
Conclusion
In this paper, a fast approach to border detection in dermoscopy images based on the classification method and characterization of the border is presented. This approach will be using for extraction efficiency of specific parameters for skin tumors. In this work, the two segmentation methods (multilevel and classification method) was presented in order to localize the tumor and to extract the contour. In this paper we have compared and evaluated different methods for getting adequate segmentation of dermatoscopic images. Our approach based on classification method produced better results. This result is very encouraging as a system based on this segmentation method can provide an acceptable lesion segmentation which requires only a minor intervention from the operator.
1936
References
- Boudghene-Stambouli; Merad-Boudia A; Benmezroua M ; ÃÂÃÂÃÂâÂÂÃÂâââÂÂìÃÂ
áÃÂÃÂââ¬Ã
¡ÃÂâÂÂÃÂë le mÃÂÃÂÃÂâÂÂÃÂâ â≢ÃÂÃÂââ¬Ã
¡ÃÂâÂÂÃÂélanome malin ÃÂÃÂÃÂâÂÂÃÂâ â≢ÃÂÃÂââ¬Ã
¡ÃÂâÂÂÃÂàTlemcen AlgÃÂÃÂÃÂâÂÂÃÂâ â≢ÃÂÃÂââ¬Ã
¡ÃÂâÂÂÃÂérie), expÃÂÃÂÃÂâÂÂÃÂâ â≢ÃÂÃÂââ¬Ã
¡ÃÂâÂÂÃÂérience de dix ans (1981 a 1990).
- Camille Serruys ÃÂÃÂÃÂâÂÂÃÂâââÂÂìÃÂ
áÃÂÃÂââ¬Ã
¡ÃÂâÂÂÃÂë Classification automatique des tumeurs noires de la peau par des techniques numÃÂÃÂÃÂâÂÂÃÂâ â≢ÃÂÃÂââ¬Ã
¡ÃÂâÂÂÃÂériques dÃÂÃÂÃÂâÂÂÃÂâÂÂÃÂâÃÂÃÂââ¬Ã
¡ÃÂâââ¬Ã
¡ÃÂìÃÂÃÂââ¬Ã
¡ÃÂâââ¬Ã
¾ÃÂâanalyse dÃÂÃÂÃÂâÂÂÃÂâÂÂÃÂâÃÂÃÂââ¬Ã
¡ÃÂâââ¬Ã
¡ÃÂìÃÂÃÂââ¬Ã
¡ÃÂâââ¬Ã
¾ÃÂâimages fondÃÂÃÂÃÂâÂÂÃÂâ â≢ÃÂÃÂââ¬Ã
¡ÃÂâÂÂÃÂées sur des mÃÂÃÂÃÂâÂÂÃÂâ â≢ÃÂÃÂââ¬Ã
¡ÃÂâÂÂÃÂéthodes dÃÂÃÂÃÂâÂÂÃÂâÂÂÃÂâÃÂÃÂââ¬Ã
¡ÃÂâââ¬Ã
¡ÃÂìÃÂÃÂââ¬Ã
¡ÃÂâââ¬Ã
¾ÃÂâapprentissage par lÃÂÃÂÃÂâÂÂÃÂâÂÂÃÂâÃÂÃÂââ¬Ã
¡ÃÂâââ¬Ã
¡ÃÂìÃÂÃÂââ¬Ã
¡ÃÂâââ¬Ã
¾ÃÂâexemple : Aide au dÃÂÃÂÃÂâÂÂÃÂâ â≢ÃÂÃÂââ¬Ã
¡ÃÂâÂÂÃÂépistage des mÃÂÃÂÃÂâÂÂÃÂâ â≢ÃÂÃÂââ¬Ã
¡ÃÂâÂÂÃÂélanomes ÃÂÃÂÃÂâÂÂÃÂâââÂÂìÃÂ
áÃÂÃÂââ¬Ã
¡ÃÂâÂÂÃÂû thÃÂÃÂÃÂâÂÂÃÂâ â≢ÃÂÃÂââ¬Ã
¡ÃÂâÂÂÃÂèse de doctorat, lÃÂÃÂÃÂâÂÂÃÂâÂÂÃÂâÃÂÃÂââ¬Ã
¡ÃÂâââ¬Ã
¡ÃÂìÃÂÃÂââ¬Ã
¡ÃÂâââ¬Ã
¾ÃÂâuniversitÃÂÃÂÃÂâÂÂÃÂâ â≢ÃÂÃÂââ¬Ã
¡ÃÂâÂÂÃÂé Paris V, 2002.
- Erkol, B., Moss, R.H., Stanley, R.J., Stoecker, W.V. and Hva-tum, E., ÃÂÃÂÃÂâÂÂÃÂâÂÂÃÂâÃÂÃÂââ¬Ã
¡ÃÂâââ¬Ã
¡ÃÂìÃÂÃÂââ¬Ã
¡ÃÂâÂÂÃÂÃÂAutomatic lesion boundary detection in dermoscopy images using gradient vector flow snakesÃÂÃÂÃÂâÂÂÃÂâÂÂÃÂâÃÂÃÂââ¬Ã
¡ÃÂâââ¬Ã
¡ÃÂìÃÂÃÂââ¬Ã
¡ÃÂâÂÂÃÂÃÂ. Skin Research & Tech, 2005, 11: 17-26.
- Burroni, M., Corona, R., DellÃÂÃÂÃÂâÂÂÃÂâÂÂÃÂâÃÂÃÂââ¬Ã
¡ÃÂâââ¬Ã
¡ÃÂìÃÂÃÂââ¬Ã
¡ÃÂâââ¬Ã
¾ÃÂâEva, G., Sera, F., Bono, R., Puddu, P., Perotti, R., Nobile, F., Andreassi, L. and Rubegni, P., Melanoma computer-aided diagnosis: reliability and feasibility study. Clinincal Cancer Research, 2004, 10 (6):1881-1886.
- Hoffmann, K., Gambichler, T., Rick, A., Kreutz, M., Anschu-etz, M., Grunendick, T., Orlikov, A., Gehlen, S., Perotti, R., Andreassi,L., Bishop, J. N., CÃÂÃÂÃÂâÂÂÃÂâââÂÂìÃÂ
áÃÂÃÂââ¬Ã
¡ÃÂâÂÂÃÂôesarini, et al., Diagnos-tic and neural analysis of skin cancer (DANAOS). A multi-centre study for collection and computer-aided analysis of data from pigmented skin lesions using digital dermoscopy. British Journal of Dermatology, 2003, 149: 801-809.
- Tomatis, S., Carrara, M., Bono, A., Bartoli, C., Lualdi, M., Tragni, G., Colombo, A. and Marchesini, R., Automated melanoma detection with a novel multispectral imaging system: results of a prospective study, Physics in Medicine and Biology, 2005, 50: 1675-1687.
- Jun Li, A Wavelet Approach to Edge Detection, thesis, Huntsville, Texas, August, 2003
- Xiaojing Yuan, Zhenyu Yang, George Zouridakis, and Nizar Mullani , 2006, ÃÂÃÂÃÂâÂÂÃÂâÂÂÃÂâÃÂÃÂââ¬Ã
¡ÃÂâââ¬Ã
¡ÃÂìÃÂÃÂââ¬Ã
¡ÃÂâ¦ââ¬Ã
ÂSVM-based Texture Classification and Application to Early Melanoma DetectionÃÂÃÂÃÂâÂÂÃÂâÂÂÃÂâÃÂÃÂââ¬Ã
¡ÃÂâââ¬Ã
¡ÃÂìÃÂÃÂââ¬Ã
¡ÃÂâÂÂÃÂÃÂ, Proceedings of the 28th IEEE EMBS Annual International Conference New York City, USA, Aug 30-Sept 3, 2006, 1-4244-0033-3/06
- Haralick, R. M., Shanmugan, K., and Dinstein, 1973. ÃÂÃÂÃÂâÂÂÃÂâÂÂÃÂâÃÂÃÂââ¬Ã
¡ÃÂâââ¬Ã
¡ÃÂìÃÂÃÂââ¬Ã
¡ÃÂâ¦ââ¬Ã
ÂTextural features for image classificationÃÂÃÂÃÂâÂÂÃÂâÂÂÃÂâÃÂÃÂââ¬Ã
¡ÃÂâââ¬Ã
¡ÃÂìÃÂÃÂââ¬Ã
¡ÃÂâÂÂÃÂÃÂ, IEEE Trans. Syst. Man Cybernetics SMC-3, 610 ,1973.
- Serruys, C. Brahmi, D. Giron, A. Vilain, J. Triller, R. and Fertil, B, 1999, ÃÂÃÂÃÂâÂÂÃÂâÂÂÃÂâÃÂÃÂââ¬Ã
¡ÃÂâââ¬Ã
¡ÃÂìÃÂÃÂââ¬Ã
¡ÃÂâ¦ââ¬Ã
ÂClassification of skin tumors by an adaptive approach grounded on a learning-by-sample process: Application to the detection of melanomasÃÂÃÂÃÂâÂÂÃÂâÂÂÃÂâÃÂÃÂââ¬Ã
¡ÃÂâââ¬Ã
¡ÃÂìÃÂÃÂââ¬Ã
¡ÃÂâÂÂÃÂÃÂ. SPIEÃÂÃÂÃÂâÂÂÃÂâÂÂÃÂâÃÂÃÂââ¬Ã
¡ÃÂâââ¬Ã
¡ÃÂìÃÂÃÂââ¬Ã
¡ÃÂâââ¬Ã
¾ÃÂâs Int. Tech. Gr. Newsletter 10, 1-3 (1999).
- Cucchiara, R. Grana, C. and Piccardi, M, 2001, ÃÂÃÂÃÂâÂÂÃÂâÂÂÃÂâÃÂÃÂââ¬Ã
¡ÃÂâââ¬Ã
¡ÃÂìÃÂÃÂââ¬Ã
¡ÃÂâ¦ââ¬Ã
ÂIterative fuzzy clustering for detecting regions of interest in skin lesionsÃÂÃÂÃÂâÂÂÃÂâÂÂÃÂâÃÂÃÂââ¬Ã
¡ÃÂâââ¬Ã
¡ÃÂìÃÂÃÂââ¬Ã
¡ÃÂâÂÂÃÂÃÂ, University of Modena -- 41100 Modena, Italy
- Gosselin, B, 1996, Thesis, Phd, ÃÂÃÂÃÂâÂÂÃÂâââÂÂìÃÂ
áÃÂÃÂââ¬Ã
¡ÃÂâÂÂÃÂëApplication de rÃÂÃÂÃÂâÂÂÃÂâ â≢ÃÂÃÂââ¬Ã
¡ÃÂâÂÂÃÂéseaux de neurones artificiels ÃÂÃÂÃÂâÂÂÃÂâ â≢ÃÂÃÂââ¬Ã
¡ÃÂâÂÂÃÂàla reconnaissance automatique de caractÃÂÃÂÃÂâÂÂÃÂâ â≢ÃÂÃÂââ¬Ã
¡ÃÂâÂÂÃÂères manuscrits ÃÂÃÂÃÂâÂÂÃÂâââÂÂìÃÂ
áÃÂÃÂââ¬Ã
¡ÃÂâÂÂÃÂû, Polytechnic faculty, Mons university.
- Rosenblatt, F, 1962, ÃÂÃÂÃÂâÂÂÃÂâÂÂÃÂâÃÂÃÂââ¬Ã
¡ÃÂâââ¬Ã
¡ÃÂìÃÂÃÂââ¬Ã
¡ÃÂâ¦ââ¬Ã
ÂPrinciples of Neurodynamics : Perceptron and theory of brain mechanismsÃÂÃÂÃÂâÂÂÃÂâÂÂÃÂâÃÂÃÂââ¬Ã
¡ÃÂâââ¬Ã
¡ÃÂìÃÂÃÂââ¬Ã
¡ÃÂâÂÂÃÂÃÂ, Washington, DC: Spartan Books.
- Bostock, R. Claridge, T. Harget,E. and Hall, P, 1993, ÃÂÃÂÃÂâÂÂÃÂâÂÂÃÂâÃÂÃÂââ¬Ã
¡ÃÂâââ¬Ã
¡ÃÂìÃÂÃÂââ¬Ã
¡ÃÂâ¦ââ¬Ã
ÂTowards a neural network based system for skin cancer diagnosisÃÂÃÂÃÂâÂÂÃÂâÂÂÃÂâÃÂÃÂââ¬Ã
¡ÃÂâââ¬Ã
¡ÃÂìÃÂÃÂââ¬Ã
¡ÃÂâÂÂÃÂÃÂ, 3rd International Conference on Artificial Neural Networks, 372, 215ÃÂÃÂÃÂâÂÂÃÂâÂÂÃÂâÃÂÃÂââ¬Ã
¡ÃÂâââ¬Ã
¡ÃÂìÃÂÃÂââ¬Ã
¡ÃÂâââÂÂìÃÂ
âÂÂ219.
- Joaquim, M., thesis, 2009, ÃÂÃÂÃÂâÂÂÃÂâÂÂÃÂâÃÂÃÂââ¬Ã
¡ÃÂâââ¬Ã
¡ÃÂìÃÂÃÂââ¬Ã
¡ÃÂâ¦ââ¬Ã
ÂClassification of Skin Tumours through the Analysis of Unconstrained ImagesÃÂÃÂÃÂâÂÂÃÂâÂÂÃÂâÃÂÃÂââ¬Ã
¡ÃÂâââ¬Ã
¡ÃÂìÃÂÃÂââ¬Ã
¡ÃÂâÂÂÃÂÃÂ, thesis, Montfort University Leicester, UK.
- Messadi M, Bessaid A, Taleb-Ahmed A, Segmentation of dermatoscopic images used for computer-aided diagnosis of melanoma, jmmb, 2009.