Delmy Oliva1,2*, Lasse Jensen3, Lena Sharp4,5, Mats Nilsson3,6 and Freddi Lewin1,2
1Department of Oncology, Ryhov County Hospital, Jönköping, Sweden
2Department of Clinical and Experimental Medicine, Linköping University, Linköping, Sweden
3Department of Medical and Health Sciences, Linköping University, Linköping, Sweden
4Regional Cancer Centre, Stockholm- Gotland, Stockholm, Sweden
5Department of Learning, Informatics, Management and Ethics, Division of Innovative Care Research, Karolinska Institute, Stockholm, Sweden
6Futurum - The Academy for Healthcare, Region Jönköping County, Jönköping, Sweden
*Corresponding Author:
Dr. Delmy Oliva
Department of Oncology
Ryhov County Hospital
SE-551 85, Jönköping, Sweden
Tel: +46(0)10 24 2 69 09
Fax: +46(0)10 24 22 9 16
E-mail: delmy.oliva@rlj.se
Received Date: February 11, 2019; Accepted Date: February 24, 2019; Published Date: February 28, 2019
Citation: Oliva D, Jensen L, Sharp L, Nilsson M, Lewin F (2019) Sleep Disturbance after Cancer Diagnosis and Treatment- A Multifaceted Clinical Problem- A Pilot Study. J Neurol Neurosci Vol.10 No.01:284. doi: 10.21767/2171-6625.1000284
Keywords
Sleep disturbance; Quality of life; Chemotherapy; EORTC QLQ C30; MOS-scale
Introduction
Cancer treatments are typically associated with a variety of side effects [1] amongst which emotional distress, nausea, fatigue, bone marrow depression, anxiety and depression are the most frequently reported. In addition, many patients also report sleep disturbance which includes reduced sleep duration and quality [2-4].
Sleep is important to maintain the natural rhythm of the body. Insufficient or reduced quality of sleep will impact the different biological clocks and they may suddenly stop working as supposed [5]. The sleep systems are firmly integrated in almost all aspects of human physiology including cellular metabolism, cardiovascular functions, cognitive functions and immune functions which is good in normal conditions [6]. Every cell of the body has a clock that communicates with the suprachiasmatic nucleus (SCN) in the hypothalamus within the brain. This is important in order to regulate and synchronize the function of peripheral clocks [6]. Normally, the SCN via the retinohypothalamic tract senses daylight and uses this signal to coordinate bodily functions. The pineal gland assists the body to fall asleep and recover from the day-time stressors during night-time [7].
Savard [8,9] and Fiorentino [10] both reported that 30-50% of all cancer patients report sleep disturbance as a problem related to nocturia, night sweat and pain. If the sleep is disturbed, it will also have a broad, negative impact on cognitive and physiological functions [11,12]. Patients quality of life (QoL) may therefore be severely affected [13].
In order to provide high quality care for cancer patients, it is essential to understand the mechanisms underlying the interactions between sleep, malignant disease severity and cancer therapy. However, how this translates to the care of newly and currently diagnosed cancer patients, a patient group at particular risk of developing sleep disturbances, are poorly understood.
The aim of this study is to explore sleep disturbance among cancer patients undergoing systemic adjuvant and/or palliative oncological treatment.
Materials and Methods
Design
In this cross-sectional cohort study, patients who are currently undergoing systemic adjuvant and/or palliative oncological treatment were included. The study was performed at the Department of Oncology, Ryhov County Hospital Jönköping, Sweden from January 2017 to May 2018. The Regional Ethical Review Board approved the study (Dnr 2016/379-31) which follows the Helsinki declaration of ethical principles for medical research involving humans.
Participants
Sample: Ninety consecutive patients with different diagnoses of cancer were informed about the study verbally and informed consent was obtained from all individual participants included in the study by an oncology research nurse. The patients could withdraw from the study at any time.
Inclusion criteria: The inclusion criteria were: a performance status estimated by toxicity and response criteria of the Eastern Cooperative Oncology Group (ECOG) of ≤ 1, age ≥ 18 years and being able to understand and speak Swedish. The patients would start an adjuvant or palliative systemic oncological treatment.
Data collection
• Patient reported data were collected at baseline, before initial systemic adjuvant and/or palliative cancer treatment and at follow-up, three months later.
• We used the Medical Outcomes Study (MOS) Sleep Scale, which is a generic, self-administered measure of sleeping patterns questionnaire [14].
• Study-specific open-ended questions related to sleep (quality of sleep, the cause of any sleep problems and sleep pattern).
• The European Organization for Research and Treatment of Cancer (EORTC) QLQ-C30 questionnaire [15].
Clinical data: Demographic data including age, Body Mass Index (BMI) and occupational status of the patients were collected from the medical record. Eastern Cooperative Oncology Group (ECOG) [16] scale of performance status was registered. Information regarding smoking habits, alcohol consumption and previous experiences of nausea was collected as a part of the inclusion.
Instruments:
(A) Sleep: The Medical Outcomes Study (MOS) Sleep Scale is a 12-item scale, measuring 6 dimensions of sleep: disturbance (e.g., the ability to fall and stay asleep), adequacy (e.g., sleeping enough to feel rested and restored), quantity (e.g., the number of hours slept), somnolence (e.g., daytime sleepiness), snoring and shortness of breath and/or headaches. Participants were asked to recall sleep quality during the previous four weeks both at baseline and three months later.
MOS Item 1 (How long did it usually take for you to fall asleep during the past four weeks?) have the following response options: “0-15 minutes”, 16-30 minutes”, “31-45 minutes”, “46- 60 minutes” or “More than 60 minutes”. For MOS Item 2 (On the average, how many hours did you sleep each night during the past four weeks?) the patient estimates the number of hours they consider they slept. The remaining 10 MOS items have five-scale response options, ranging from ‘none of the time’ to ‘all of the time’ [14].
Three study-specific open-ended questions were used to determine the patient’s own assessment of their sleep quality and causes of sleep problems. The patients reported those questions at baseline and follow-up. The items were: 1. “Describe how you experience the quality of your sleep.” 2. “What do you think may be the cause of any sleep problems?” and 3. “Describe your sleep pattern.”
(B) Health-Related Quality of Life (HRQoL): The EORTC QLQ-C30 questionnaire was used to study the health-related quality of life. The questionnaire incorporates five functional dimensions (physical, role, cognitive, emotional, and social), three symptomatic dimensions (fatigue, pain, and nausea/vomiting), a global health status/QoL dimension as well as several items measuring extra symptoms commonly reported by cancer patients (dyspnea, loss of appetite, insomnia, constipation and diarrhea) and the perceived financial impact of the disease. The response categories for items 1 to 28 “Not at all”, “A little”, “Quite a bit” and “Very much”. Items 29 and 30 have a different respond scale from 1 to 7 where 1 is the worst and 7 are the best. The authorized Swedish version of the QLQ-C30 was used [15].
Statistical analysis
For the analysis in the open-ended questions we used a descriptive quantitative analysis. We computed the median and percentages for the categorical variables in order to focus on experiences from an individual perspective. For the analysis of both questionnaires, MOS and EORTC QLQ C30, “the Svensson method” was used to evaluate eventual disagreement between base line and follow up on the ordered categorical items for the paired ordered categorical data. If there is a systematic change this can be a sign of a common group change whereas a random variability could be a sign of individual change [17]. There are four main outcomes from the analysis: Pairwise identical answers- Percent agreement (PA 0 – 100%), group-level systematic disagreement - Relative Position (RP, -1 to +1), concentration of the systematic change - Relative Change (RC, -1 to +1) and individual variability Relative Rank Variance (RV, 0 to +1). An RV result > 0.20 indicates a non-negligible heterogeneity. The results for RP, RC and RV are presented with the value and 95% confidence interval. If the interval includes zero, this is a sign of a lack of statistical significance.
For the evaluation of time slept between baseline and follow-up paired t-test were used. The null hypothesis is no difference in self estimated hours slept from baseline to follow-up.
Results
Ninety patients were enrolled in the study. For different reason, seventeen (19%) patients did not complete the study. At baseline, eighty (89%) patients responded to the questionnaires and seventy-two (80%) patients responded at follow-up. The patients were undergoing treatment for a variety of cancer diagnoses e.g. in the gastrointestinal area, breast and urogenital area. When asking patients at the time of inclusion, 25% (n=18) stated that they had sleeping problems (Table 1).
| Demographic data |
| Age, years (min-max) 31-82 |
n= (%) |
| Female (mean) 61 years |
28 (37) |
| Male (mean) 68 years |
47 (63) |
| Performance Status (ECOG)* n= (%) |
| 0 |
46 (63) |
| 1 |
29 (37) |
| Sleep quality n= (%) |
| Good |
54 (75) |
| Not good |
18(25) |
| Alcohol consumption, n= (%) |
| No |
23 (30) |
| Yes |
52 (70) |
| Nausea experience before treatment, n= (%) |
| Pregnancy |
8 (11) |
| Travel nausea |
7 (9) |
| Not nausea at all |
60 (80) |
| Occupational status, n= (%) |
| Retired |
49 (65) |
| Working |
25 (33) |
| Unemployed |
1 (2) |
| Civil status, n= (%) |
| Married/partner |
64 (85) |
| Single |
10 (13) |
| Widower |
1 (2) |
| Tobacco use, n= (%) |
| No |
65 (87) |
| Yes |
10 (13) |
| BMI |
| Min-max |
19-43 |
| Median |
26 |
| Tumor classification |
| Gastrointestinal cancer |
50 |
| Urothelial cancer |
11 |
| Breast cancer |
11 |
| Brain tumor |
1 |
| Tonsillar cancer |
1 |
| Cancer unknown primary |
1 |
*ECOG Performance Status = Toxicity and response criteria of the Eastern Cooperative Oncology Group.
Table 1: Demographic data of the responding patients.
Sleeping habits
When analyzing the MOS items, both at baseline and follow-up, a large individual variation was found concerning the patients sleeping problems. The number of hours of sleep on baseline and follow-up was not significantly different at the group level. The self-reported change in average sleeping hours between baseline and follow-up is depicted in Figure 1. Twenty-one patients did not change their sleeping time. The mean change was +9 minutes which is not statistically significant t (71) =0.92, p=0.36.
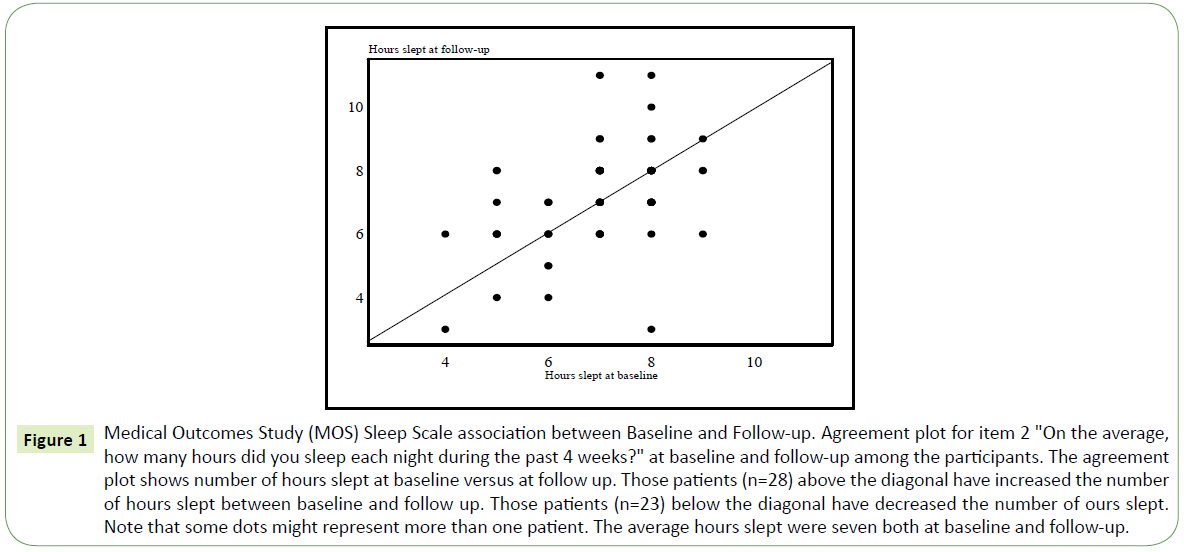
Figure 1: Medical Outcomes Study (MOS) Sleep Scale association between Baseline and Follow-up. Agreement plot for item 2 "On the average, how many hours did you sleep each night during the past 4 weeks?" at baseline and follow-up among the participants. The agreement plot shows number of hours slept at baseline versus at follow up. Those patients (n=28) above the diagonal have increased the number of hours slept between baseline and follow up. Those patients (n=23) below the diagonal have decreased the number of ours slept. Note that some dots might represent more than one patient. The average hours slept were seven both at baseline and follow-up.
The patients reported that they became more tired with time of treatment and needed to rest more during the day as shown in items 4, 6 and 9 (Table 2) over time. In item 4, 62 patients responded that they experienced insufficient sleep, corresponding to 86% (data not shown).
| MOS sleep scale analysis using the Svensson method |
| Items |
PA |
RP |
SE |
95% CI |
RC |
SE |
95% CI |
RV |
SE |
95% CI |
| 1. How long did it usually take for you to fall asleep during the past 4 weeks? |
53% |
–0.04 |
0.05 |
–0.14; 0.05 |
0.04 |
0.07 |
–0.11; 0.18 |
0.03 |
0.01 |
0.01; 0.05 |
| How often during the past 4 weeks did you (same question from “3” to “12” but with different context) |
| 3. Feel that your sleep was not quiet (moving restlessly, feeling tense, speaking, etc., while sleeping)? |
53% |
-0.08 |
0.06 |
–0.21; 0.04 |
0.02 |
0.09 |
– 0.15; -0.18 |
0.13 |
0.04 |
0.04; 0.21 |
| 4. Get enough sleep to feel rested upon waking in the morning? |
43% |
0.12 |
0.07 |
–0.02; 0.25 |
–0.02 |
0.07 |
–0.15; 0.12 |
0.25 |
0.09 |
0.08; 0.41 |
| 5. Awaken short of breath or with a headache? |
81% |
–0.05 |
0.04 |
–0.13; 0.03 |
–0.06 |
0.04 |
–0.13; 0.02 |
0.003 |
0.003 |
0; 0.01 |
| 6. Feel drowsy or sleepy during the day? |
47% |
0.19 |
0.07 |
0.06; 0.33 |
–0.01 |
0.08 |
–0.16; 0.13 |
0.17 |
0.07 |
0.04; 0.3 |
| 7. Have trouble falling asleep? |
49% |
–0.07 |
0.06 |
–0.19; 0.05 |
–0.05 |
0.08 |
–0.21; 0.11 |
0.13 |
0.05 |
0.04; 0.22 |
| 8. Awaken during your sleep time and have trouble falling asleep again? |
51% |
–0.09 |
0.06 |
–0.19; 0.02 |
–0.08 |
0.07 |
–0.22; 0.07 |
0.07 |
0.03 |
0.02; 0.12 |
| 9. Have trouble staying awake during the day? |
49% |
0.21 |
0.07 |
0.08; 0.34 |
0.09 |
0.08 |
–0.07; 0.25 |
0.13 |
0.05 |
0.03; 0.23 |
| 10. Snore during your sleep? |
60% |
–0.02 |
0.06 |
–0.14; 0.09 |
–0.03 |
0.06 |
–0.14; 0.09 |
0.07 |
0.03 |
0.01; 0.14 |
| 11. Take naps (6 minutes or longer) during the day? |
46% |
0.07 |
0.06 |
–0.05; 0.19 |
0.1 |
0.08 |
–0.05; 0.26 |
0.19 |
0.07 |
0.06; 0.31 |
| 12. Get the amount of sleep you needed? |
46% |
0.003 |
0.06 |
–0.12; 0.12 |
–0.01 |
0.08 |
–0.16; 0.14 |
0.11 |
0.04 |
0.03; 0.19 |
PAL: Percent Agreement; RC: Relative Concentration; RP: Relative Position; RV: Relative Rank Variance; SE: Standard Error; CI: Confidential Interval.
Significant values are given in bold
In the table were question 2 not include since is not evaluated on the same way see Figure I instead
Table 2: Medical Outcomes Study (MOS) sleep scale association between baseline and follow-up.
Study specific open-ended questions: We found many similarities between the different patients regarding their experiences related to sleep disturbances. When linking the different responses, we put the answers in four different alternatives. We have missing data as a possible alternative because there were a lot of patients who preferred not to answer each of these questions.
In the first question (Describe how you experience the quality of your sleep?) We found four areas of responses (1) “Good/ well”, (2) “Good sleep” but only after using sleeping pills, (3) “Insufficient” and (4) missing data (n= 5-10 at baseline and follow up respectively).
In question two, “What you think may be the cause of any sleep problems? we found five different types of responses: (1) nocturia, (2) cancer disease, (3) anxiety, (4) pain and (5) missing data (many patients preferred not to answer the question [n=35] both in baseline and in follow-up).
In question three “Describe your sleep pattern? We found four types of responses: (1) sleeps mostly at night, (2) sleeps mostly at day, (3) at night some days and at day some days in the week and (4) missing data (n= 2-7 at baseline and follow up respectively).
Based on the above described response areas, descriptive statistics were used to present the results.
The results from the open-ended questions revealed that 30% of the patients experienced insufficient sleep both at baseline and follow up (Table 3). The proportion of patients who could sleep using sleeping pills was 6% at baseline and 8% at follow-up. Of those who reported having good sleep at the start of treatment, a 10% decline was reported in the quality of sleep after three months. The main reasons for poor sleep were “the disease” and anxiety at baseline. At follow-up, anxiety was still one of the main causes to poor sleep together with nocturia. “The disease” however declined as a cause of sleeping disturbances and was reported by 56% at baseline and 51% at follow-up. Sleeping during the night time were reported by 95% (n=76) at baseline and 84% (n=61) at follow-up (Table 3).
| Describe how you experience the quality of your sleep? |
n= (%) |
| Baseline |
Follow-up |
| 1. Good/well |
46 (58) |
35 (48) |
| 2. Good sleep but only after using sleep pills |
5 (6) |
6 (8) |
| 3. Insufficient |
24 (30) |
22 (30) |
| 4. Missing data |
5 (6) |
10 (14) |
| Total |
80 (100) |
73 (100) |
| What you think may be the cause of any sleep problems? |
Baseline |
Follow-up |
| 1. Nocturia |
6 (7,5) |
13 (18) |
| 2. Disease/cancer |
20 (25) |
7 (10) |
| 3. Anxiety |
18 (22.5) |
16 (22) |
| 4. Pain |
1 (1) |
1 (1) |
| 5. Missing data |
35 (44) |
35 (49) |
| Total |
80 (100) |
72 (100) |
| Describe your sleep pattern? |
Baseline |
Follow-up |
| 1. Sleeps mostly at night |
76 (95) |
61 (84) |
| 2. Sleep mostly at day |
1 (1) |
1 (1) |
| 3. At night some days and at day some days on the week |
1 (1) |
3 (4) |
| 4. Missing data |
2 (3) |
7 (11) |
| Total |
80 (100) |
72 (100) |
Table 3: Patients reported sleep quality in the open-ended questions.
Health-related Quality of Life (HRQoL)
When comparing baseline and follow-up data on HRQoL we found a slight increase in fatigue between baseline and follow-up (Figure 2), RP=0.19 with 95% CI 0.05 to 0.32. Patients who reported a need to sit or stay in bed more often experienced limitations in social activity levels both in terms of family- and social life. Furthermore, patients that needed to rest more generally felt weaker (Table 4). Concerning HRQOL, patients fluctuated from very poor to excellent as seen in Figure 3 with individual variability, Relative Rank Variance of 0,22 (RV). On question 11 regarding the difficulty of sleeping, 51% (n=37) reported problems at baseline and 43% (n=31) experienced problems on follow-up an. Consequently, their HRQoL was heterogeneous as indicated also by the RV value. Only 44% of the patients were unchanged between baseline and follow up.
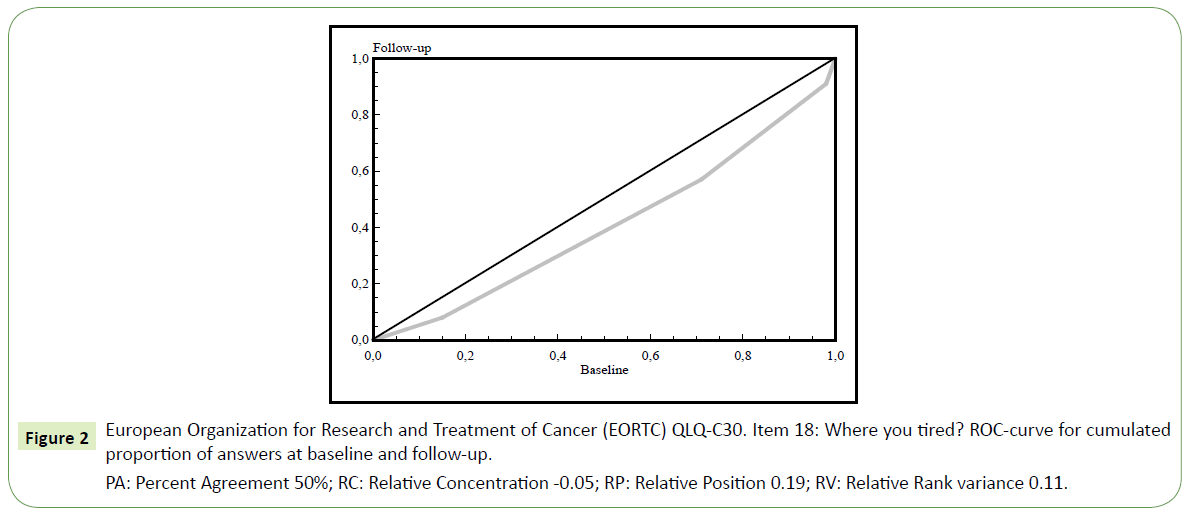
Figure 2: European Organization for Research and Treatment of Cancer (EORTC) QLQ-C30. Item 18: Where you tired? ROC-curve for cumulated proportion of answers at baseline and follow-up.
PA: Percent Agreement 50%; RC: Relative Concentration -0.05; RP: Relative Position 0.19; RV: Relative Rank variance 0.11.
| EORTC QLQ C30 analysis with the Swenson method |
| Items |
PA |
RP |
SE |
95% CI |
RC |
SE |
95% CI |
RV |
SE |
95% CI |
| 1 |
45% |
0.11 |
0.07 |
–0.03; 0.25 |
0.05 |
0.09 |
–0.12; 0.22 |
0.15 |
0.05 |
0.05; 0.24 |
| 2 |
46% |
0.21 |
0.06 |
0.09; 0.34 |
0.7 |
0.09 |
–0.1; 0.25 |
0.12 |
0.04 |
0.03; 0.19 |
| 3 |
69% |
0.15 |
0.06 |
0.03; 0.26 |
0.05 |
0.07 |
–0.08; 0.18 |
0.03 |
0.02 |
0; 0.06 |
| 4 |
36% |
0.21 |
0.08 |
0.06; 0.35 |
–0.06 |
0.09 |
–0.24; 0.12 |
0.19 |
0.06 |
0.07; 0.3 |
| 5 |
93% |
0.03 |
0.03 |
–0.02; 0.08 |
–0.06 |
0.03 |
–0.11; 0 |
0 |
0 |
0; 0 |
| 6 |
39% |
0.13 |
0.08 |
–0.03; 0.3 |
0.06 |
0.08 |
–0.1; 0.23 |
0.37 |
0.09 |
0.19; 0.55 |
| 7 |
39% |
0.19 |
0.08 |
0.03; 0.34 |
0.14 |
0.09 |
–0.03; 0.31 |
0.27 |
0.08 |
0.13; 0.42 |
| 8 |
43% |
0.23 |
0.08 |
0.08; 0.38 |
0.11 |
0.09 |
–0.07; 0.28 |
0.18 |
0.06 |
0.06; 0.3 |
| 9 |
53% |
–0.07 |
0.08 |
–0.21; 0.08 |
0.14 |
0.07 |
–0.01; 0.28 |
0.2 |
0.07 |
0.07; 0.33 |
| 10 |
47% |
0.13 |
0.07 |
–0.02; 0.28 |
0.07 |
0.07 |
–0.08; 0.21 |
0.22 |
0.09 |
0.05; 0.39 |
| 11 |
54% |
–0.04 |
0.06 |
–0.16; 0.09 |
–0.14 |
0.07 |
–0.28; -0.01 |
0.09 |
0.04 |
0.02; 0.16 |
| 12 |
44% |
0.31 |
0.07 |
0.18; 0.44 |
–0.02 |
0.11 |
–23; 0.18 |
0.15 |
0.05 |
0.05; 0.25 |
| 13 |
60% |
0.05 |
0.06 |
–0.08; 0.18 |
–0.13 |
0.06 |
–0.26; -0.01 |
0.08 |
0.03 |
0.01; 0.14 |
| 14 |
61% |
0.16 |
0.06 |
0.04; 0.28 |
–0.09 |
0.05 |
–0.19; 0.02 |
0.04 |
0.02 |
0; 0.08 |
| 15 |
89% |
0.06 |
0.04 |
–0.02; 0.13 |
–0.01 |
0.01 |
–0.04; 0.01 |
0 |
0 |
0; 0 |
| 16 |
69% |
0.04 |
0.06 |
–0.07; 0.15 |
0 |
0.06 |
–0.11; 0.11 |
0.04 |
0.02 |
0; 0.08 |
| 17 |
63% |
0.1 |
0.06 |
–0.01; 0.21 |
0.01 |
0.07 |
–0.12; 0.14 |
0.04 |
0.02 |
0; 0.09 |
| 18 |
50% |
0.19 |
0.07 |
0.05; 0.32 |
–0.05 |
0.08 |
–0.2; 0.11 |
0.11 |
0.04 |
0.03; 0.19 |
| 19 |
53% |
–0.11 |
0.07 |
–0.24; 0.02 |
0 |
0.07 |
–0.14; 0.14 |
0.1 |
0.04 |
0.02; 0.18 |
| 20 |
72% |
0.02 |
0.06 |
–0.1; 0.13 |
–0.07 |
0.03 |
–0.13; 0 |
0.03 |
0.02 |
0; 0.07 |
| 21 |
59% |
–0.12 |
0.06 |
–0.23; -0.01 |
0.08 |
0.07 |
–0.06; 0.22 |
0.04 |
0.02 |
0; 0.08 |
| 22 |
59% |
–0.15 |
0.06 |
–0.27; -0.04 |
–0.08 |
0.07 |
–0.22; 0.06 |
0.07 |
0.03 |
0.01; 0.14 |
| 23 |
60% |
0.09 |
0.06 |
–0.04; 0.21 |
–0.03 |
0.06 |
–0.14; 0.09 |
0.07 |
0.03 |
0.01; 0.14 |
| 24 |
65% |
–0.04 |
0.05 |
–0.14; 0.07 |
0.13 |
0.05 |
0.03; 0.23 |
0.02 |
0.01 |
0; 0.04 |
| 25 |
65% |
0.08 |
0.06 |
–0.04; 0.2 |
–0.02 |
0.04 |
–0.1; 0.05 |
0.05 |
0.02 |
0; 0.09 |
| 26 |
58% |
0.2 |
0.07 |
0.07; 0.33 |
–0.07 |
0.07 |
–21; 0.06 |
0.12 |
0.06 |
0.01; 0.23 |
| 27 |
44% |
0.13 |
0.07 |
–0.01; 0.27 |
–0.11 |
0.08 |
–0.28; 0.05 |
0.15 |
0.05 |
0.05; 0.26 |
| 28 |
83% |
0 |
0.04 |
–0.08; 0.08 |
0 |
0.02 |
–0.05; 0.05 |
0 |
0 |
0; 0.01 |
| 29 |
44% |
0.02 |
0.07 |
–0.1; 0.15 |
0.12 |
0.07 |
–0.02; 0.26 |
0.19 |
0.06 |
0.07; 0.31 |
| 30 |
33% |
0.02 |
0.07 |
–0.12; 0.15 |
0 |
0.08 |
–0.16; 0.16 |
0.22 |
0.07 |
0.09; 0.35 |
PA: Percent Agreement; RC: Relative Concentration; RP: Relative Position; RV: Relative Rank variance; SE: Standard Error; CI: Confidential Interval
Significant values are given in bold
Table 4: The European Organization for Research and Treatment of Cancer (EORTC) QLQ-C30 questionnaire. Association between baseline and follow-up.
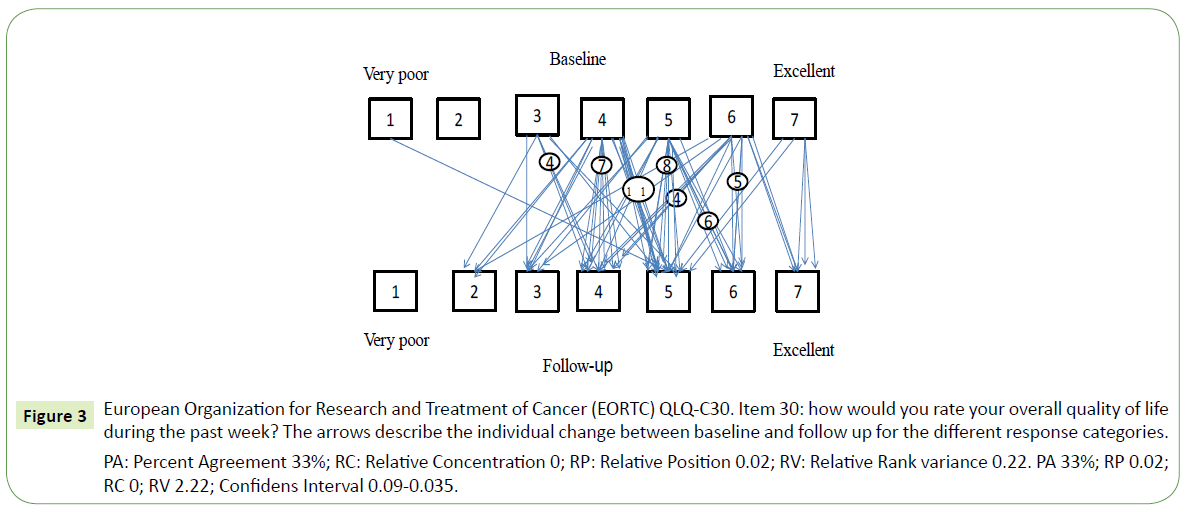
Figure 3: European Organization for Research and Treatment of Cancer (EORTC) QLQ-C30. Item 30: how would you rate your overall quality of life during the past week? The arrows describe the individual change between baseline and follow up for the different response categories.
PA: Percent Agreement 33%; RC: Relative Concentration 0; RP: Relative Position 0.02; RV: Relative Rank variance 0.22. PA 33%; RP 0.02; RC 0; RV 2.22; Confidens Interval 0.09-0.035.
Discussion
The present study assessed, with the perspective of cancer disease, the existence of sleep disturbances over a 3-month period during treatment. The role of somatic symptoms possibly caused by treatment alternatively the disease suggest that its’ negative impact is important in preventing good sleep. The side effects such as anxiety, nausea, pain, diarrhea and tiredness were reported both at baseline and follow-up. Those somatic symptoms could increase sleep disturbances in the patients. Sleep is an important element of HRQoL in patients with cancer [18,19]. Anxiety as one classified problem of disturbed sleep was similar in both measurements, which agrees with findings from other studies [8-11]. The time patients were sleeping was largely considered enough, although it was interrupted in many patients by frequent nocturia and other symptoms as revealed through the answers to the open-ended questions. Nausea as a problem was reported with a small variability (EORTC QLQ C30 questionnaire). Coping strategies are effective ways of dealing with difficult situations such as long-term illness [20,21]. In the case of cancer, coping can make the patient regard the disease as a part of life [22]. In this study the disease as a cause of sleep disturbance was of less importance at follow-up compared to base line. However, this was not enough to regain a healthy sleep pattern as patients continued to report insufficient sleep even at follow-up.
Alcohol consumption is known to give sleep disturbance [23]. In the current study, 70% of the patients report that they use alcohol. However, we do not have specific data on the total quantity, only the frequency. Nor did we correlate the results to alcohol consumption.
From the perspective of data analysis, the strength of the study is that the use of two different instruments, one for examining sleep quality (MOS) and the other examining the HRQoL (EORTC QLQ C30) in connection with the start or replacement of systemic oncological treatment was of importance in this study. The problem could be seen on a validated basis. Additionally, although many patients did not respond to all questions in their entirety, the open-ended questions provided an advantage in that sleep problems were identified using the patient’s own terms. The “Svensson method” is found to be robust even in small samples. The method not only analyze if there is a change, in contrast to the McNemars method [24], but also describes the size and direction of a change.
One limitation was that many patients did not answer the openended questions. With a higher response rate for the study-specific questions the results might have been different. The fact that it was a relatively small study may partly explain the heterogeneous image we found between the different instruments used. However, this could also be interpreted as different aspects of sleep. In the MOS scale, 42% stated that the sleep was acceptable but not perfect while 58% regarded their sleep as unacceptable.
We could see that sleep disturbances exist. The question is what we can do to diminish the problem as we know that sleep is something the body needs to recuperate energy as well as being an important component to have HRQoL. It is important to profile a robust evidence base for the progress as well as a proper and dynamic intervention or managing program personalized to cancer patients.
Conclusion
The perception of good sleep is individual. The cancer disease itself and anxiety seem to be the most common reasons for sleep disturbance among cancer patients undergoing treatment. Disease as a cause for sleep disturbances was reduced at follow-up, probably due to the patients establishing coping strategies. However, it was replaced by nocturia. As such, the cancer treatment does not seem to worsen nor improve the perception of the sleep disturbance. As sleeping disturbances is a major problem, this should be of concern in the clinical care for the patients. Information associating the validated surveys to genetic and biochemical information of the involvement of the circadian clock would be a valid next step of research in order to more thoroughly establish robust methods for analyzing sleep quality and its effects on the cancer patient.
Acknowledgements
We want to thank the staff of the open ward of the department of oncology for the inclusion and collection of questionnaires as well as the Futurum-Academy for Health and Care, Region Jönköping County, Sweden and all the patients who answer and made this study possible.
Conflict of Interest
The authors declare that they have no conflicts of interest.
24168
References
- Mukai M, Komori K, Oka T (2018) Mechanism and management of cancer chemotherapy-induced atherosclerosis. J Atheroscler Thromb 25: 994-1002.
- Ji YB, Bo CL, Xue XJ, Weng EM, Gao GC, et al. (2017) Association of inflammatory cytokines with the symptom cluster of pain, fatigue, depression and sleep disturbance in Chinese patients with cancer. J Pain Symptom Manage 54: 843-852.
- Tantoy IY, Cooper BA, Dhruva A, Cataldo J, Paul SM, et al. (2018) Changes in the occurrence, severity, and distress of symptoms in patients with gastrointestinal cancers receiving chemotherapy. J Pain Symptom Manage 55: 808-834.
- Chen D, Yin Z, Fang B (2018) Measurements and status of sleep quality in patients with cancers. Support Care Cancer 26: 405-414.
- Innominato PF, Giacchetti S, Bjarnason GA, Focan C, Garufi C, et al. (2012) Prediction of overall survival through circadian rest-activity monitoring during chemotherapy for metastatic colorectal cancer. Int J Cancer 131: 2684-2692.
- Dierickx P, Van Laake LW, Geijsen N (2018) Circadian clocks: From stem cells to tissue homeostasis and regeneration. EMBO Rep 19: 18-28.
- Aguilar-Arnal L, Sassone-Corsi P (2015) Chromatin landscape and circadian dynamics: Spatial and temporal organization of clock transcription. Proc Natl Acad Sci USA 112: 6863-6870.
- Savard J, Morin CM (2001) Insomnia in the context of cancer: A review of a neglected problem. J Clin Oncol 19: 895-908.
- Savard J, Ivers H, Villa J, Caplette-Gingras A, Morin CM (2011) Natural course of insomnia comorbid with cancer: An 18-month longitudinal study. J Clin Oncol 29: 3580-3586.
- Fiorentino L, Ancoli-Israel S (2007) Sleep dysfunction in patients with cancer. Curr Treat Options Neurol 9: 337-346.
- Savard J, Ivers H, Savard MH, Morin CM (2015) Cancer treatments and their side effects are associated with aggravation of insomnia: Results of a longitudinal study. Cancer 121: 1703-1711.
- Flynn KE, Shelby RA, Mitchell SA, Fawzy MR, Hardy NC, et al. (2010) Sleep-wake functioning along the cancer continuum: Focus group results from the Patient-Reported Outcomes Measurement Information System (PROMIS((R))). Psychooncology 19: 1086-1093.
- Clevenger L, Schrepf A, Degeest K, Bender D, Goodheart M, et al. (2013) Sleep disturbance, distress, and quality of life in ovarian cancer patients during the first year after diagnosis. Cancer 119: 3234-3241.
- Allen RP, Kosinski M, Hill-Zabala CE, Calloway MO (2009) Psychometric evaluation and tests of validity of the Medical Outcomes Study 12-item Sleep Scale (MOS sleep). Sleep Med 10: 531-539.
- Michelson H, Bolund C, Nilsson B, Brandberg Y (2000) Health-related quality of life measured by the EORTC QLQ-C30--reference values from a large sample of Swedish population. Acta Oncol 39: 477-484.
- Oken MM, Creech RH, Tormey DC, Horton J, Davis TE, et al. (1982) Toxicity and response criteria of the eastern cooperative oncology group. Am J Clin Oncol 5: 649-655.
- Avdic A, Svensson E (2010) Svenssons method (Version 1.1). Örebro. Interactive software supporting Svenssons method.
- Schwartz AL, De Heer HD, Bea JW (2017) Initiating Exercise Interventions to Promote Wellness in Cancer Patients and Survivors. Oncology (Williston Park) 31: 711-717.
- Cramer H, Lauche R, Klose P, Lange S, Langhorst J, et al. (2017) Yoga for improving health-related quality of life, mental health and cancer-related symptoms in women diagnosed with breast cancer. Cochrane Database Syst Rev 1: CD010802.
- Mkanta WN, Chumbler NR, Richardson LC, Kobb RF (2007) Age-related differences in quality of life in cancer patients: A pilot study of a cancer care coordination/home-telehealth program. Cancer Nurs 30: 434-440.
- Browall M, Persson LO, Ahlberg K, Karlsson P, Danielson E (2009) Daily assessment of stressful events and coping among post-menopausal women with breast cancer treated with adjuvant chemotherapy. Eur J Cancer Care (Engl) 18: 507-516.
- Shim M, Mercer KLM, Roberts LJ, Gustafson DH (2015) Communication competence, psychological well-being, and the mediating role of coping efforts among women with breast cancer: A cross-sectional and longitudinal evidence. Women Health 55: 400-418.
- Colrain IM, Nicholas CL, Baker FC (2014) Alcohol and the sleeping brain. Handb Clin Neurol 125: 415-431.
- Fleiss JL, Levin B (1988) Sample size determination in studies with matched pairs. J Clin Epidemiol 41: 727-730.