Keywords
National HIV/AIDS guidelines and policies; PMTCT; CTC; 90-90-90 HIV goals; Exploratory data analysis
Introduction
Exploration of HIV datasets is an important component of HIV/AIDS Management as it can create a basis for assessing the relevance of the existing HIV monitoring and management programmes, guidelines and/or policies. The proper and effective HIV/AIDS management can be achieved when all stakeholders are well informed on the various aspects related to HIV care, treatment and prevention and are capable of making informed decisions based on the statistical evidences drawn from the analysis of the actual HIV and AIDS data. The aim of this study is to explore the HIV data regarding the implementation of the PMTCT and CTC guidelines in Kilimanjaro region in Tanzania so as to gain insights on the progress that have been made so far in managing the HIV/AIDS in the region and towards the attainment of the 90-90-90 global HIV/AIDS target. The obtained insights can be used to evaluate the effectiveness of the policies related to HIV Prevention, cure and treatment in Tanzania and address the methodological challenges related to HIV data analysis. The Exploratory Data Analysis (EDA) has been employed to maximize insights into a data set and uncover its underlying structure and extracting important determinants for HIV management. As commented the graphical approach in EDA helps researcher to understand not only what is in the data but also what is not in the datasets [1].
Various scholars insisted on the usefulness of EDA in cases where the datasets are heavily censored like in HIV studies whereby the use of the commonly known statistical techniques can lead to inaccurate conclusions or unrealistic estimation. In analyzing the policy related data, it can be hard to decide in advance on the appropriate statistical models for describing the existing situations or the probability distributions that characterizes the collected datasets. Sometimes it may be even harder to assume the values of parameters for the assumed distributions and it is in such scenario that EDA serves to know the basics of the datasets [1-5].
HIV management policies and guidelines in Tanzania
Since 2001 the Government of Tanzania in collaboration with various stakeholders have established several policies and guidelines [6-10], for managing the HIV and AIDS disease through minimizing the new infections while suppressing the viral loads in HIV positive patients. Among those policies are the National HIV and AIDS policy, National Policy Guidelines for Collaborative TB/HIV Activities, Tanzania HIV/AIDS Prevention and Control Act No 28 of 4 April 2008 and the National Guidelines for the Management of HIV and AIDS, fifth edition. These guidelines and policies aimed at creating and sustaining an increased awareness of HIV AIDS through targeted advocacy, information, education and communication for behavior change at all levels by all sectors. They also aimed at safe blood donation procedures, promoting safe sex, early and effective treatment of sexual transmitted diseases and early diagnosis of HIV infection through voluntary counseling and testing. In caring for People Living with HIV/AIDS (PLHAs), the policies insisted on the provision of adequate treatment and medical care through an improved health care system while combating stigma to enhance the general quality of life for HIV/AIDS patients. A good example is the national HIV Prevention Operational Plan (2016-18) which aimed at reducing stigma by 40% through enhancing institutional capacities to promote non-stigma and discriminations interventions.
Guidelines on HIV testing for women under reproductive age
HIV statistics in Tanzania identifies Mother to Child transmission as the main source of HIV infection among children. The guidelines on HIV testing for women under reproductive age requires all pregnant women and their partners who are not aware of their HIV status to be counseled and tested for HIV infection during their first antenatal Clinic (ANC) visit. The guidelines requires those who are found to be HIV positive to start treatment immediately and those who tests negative to conduct at least one more test during their second and third trimester or at labor and delivery. Likewise, the breastfeeding women who are not sure of their HIV status are supposed to be counseled and tested for HIV status during their breast feeding period. For those who are tested during their third trimester or at labor and delivery should repeat the HIV test at the 6-month post-partum. Also viral load test for all pregnant and breast feeding women who are already on the ART should be checked during their first ANC clinic and review their results in two weeks’ time. For those with viral load greater than 1000 copies/mL should retest after three months. The newly diagnosed HIV patients are supposed to be tested again after three months and if their viral load will be less than 1000 (copies/mL) they have to retest 6 months after the initiation of ART. For those whose viral load is greater than 1000 (copies/mL) are supposed to be managed as possible treatment failure and have to retest after three months.
Guidelines on HIV testing for children born with HIV positive mothers
For children born with HIV positive mothers, the guidelines require the healthcare givers to perform a HIV DNA Polymerase Chain Reaction (PCR) test at their 6th week of age. The guidelines also recommends for Cotrimozole Preventive Therapy (CPT) to be given to all HIV positive children less than five years of age regardless of their CD4 and WHO stage and to all HIV–infected infants aged 4-6 weeks.
Guidelines on laboratory tests for HIV and AIDS
The national HIV/AIDS policies and guidelines propose several HIV tests for both children and adults. Among them are tests for the diagnosis of HIV infection (EIA-Enzyme Immunoassays), tests for determining HIV progression stage (CD4 cells count), tests for monitoring responses to ART (Viral loads), tests for monitoring the toxicity of ART and its severity, tests for diagnosis of opportunistic infections and resistance tests to determine the best ARV regime for each patient. People who test negative at their first HIV test are required to retest after four weeks, and thereafter make a routine testing every six months. For those whose first test is positive are also required to retest using the same testing strategy and algorithm before enrolling into Care and initiating ART. The guidelines also recommend on the use of viral loads test records to monitor the effectiveness of ART whereby a HIV patient should be tested for his/her viral load at 6th and 12th months after initiation of treatment and thereafter-yearly if the patient’s viral load is suppressed. For any adolescent and adult HIV patient whose viral load is greater than 1000 copies/ml the guideline recommend them to be managed as ‘possible treatment failure’ and therefore give them enhanced adherence counseling and repeat Viral load test after three months. It is also recommended to test for the CD4 Tlymphocytes at baseline to determine the immunological stage and establish an appropriate treatment option for a particular patient. However, the guidelines state that in settings where the Viral Load monitoring is not available or not possible, then the CD4 count test should be done at the baseline for all clients and repeat the test after every six months. This study provides significant insights related to HIV and AIDS management and how the insights gained may be used to strengthen implementation of HIV and AIDS policies in Tanzania.
Materials and Methods
Study area
The study was confined to Kilimanjaro region, in which nine (9) health facilities offering HIV Care and Treatment services (CTC) and Prevention of Mother to Child Transmission (PMTCT) clinics were visited. We used Two Stage sampling (Sub sampling) approach to select the districts to be involved in the study and thereafter selected subjects from the sampled districts as shown in Figure 1. This sampling approach helped us to create a balance in terms of time, cost and precision for the problem under study.
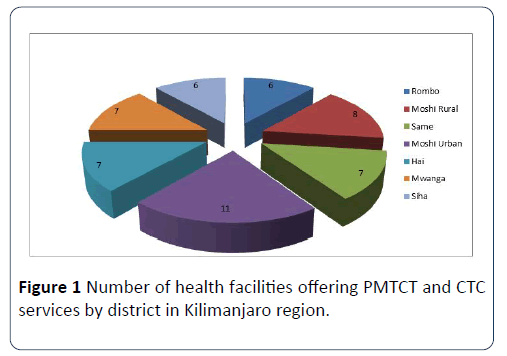
Figure 1: Number of health facilities offering PMTCT and CTC services by district in Kilimanjaro region.
Data and variables
We selected nine (9) health facilities purposely by considering the number of patients who were enrolled in PMTC and CTC services in those facilities. A total of 114 women and 54 youths were consulted and collect data from them through interviews and Questionnaires. Also, in one facility twenty eight (28) youths and children patients’ files were accessed to observe the recorded patients’ information. Basically the collected information involved patients’ demographic information, their HIV testing experiences, the time interval between HIV diagnosis and initiation of ART, parental livelihood, pregnancy decisions after HIV diagnosis as well as the HIV positive women’s awareness on their partner’s HIV status. With focus on the implementation of the key directives that are described in the HIV/AIDS policies and guidelines the study assessed the implementation of the guidelines at facility level by conducting interviews with the medical officers in charge, CTC and PMTC officers in charges, Data managers and health care givers in some selected health facilities. Responses from such interviews enabled the researcher to explore the practicability of the suggested guidelines in the hospital settings. Data processing, presentation, analysis and interpretation were conducted through exploratory data analysis approach with the aid of STATA and MINITAB computer packages.
Results and Discussion
This section presents the main findings of our study and the general discussion.
Demographic information
The study used a sample of 82 youths and children as well as 114 women who were all confirmed to be HIV positive and who were receiving PMTCT and CTC services in different health facilities in Kilimanjaro region. Questionnaire and interview methods were used to gather demographic data and other information related to their HIV status. The number of males respondents in the first category of sample involved children and youths who 35(43) % of them were males and 47 (57.4%) were females. Their ages ranged from 10-24 years with a mean of 17 years and majority of them (55.6%) were in the age group 15-19 years. Also 51 (62.7%) of the respondents were secondary school students and 27 (33.2%) were in primary schools. The mean age at HIV confirmation for females and males were 7.19 and 8.4 years respectively. This difference in age at HIV infection relates to the findings reported by THIS report which showed a wide disparity in HIV prevalence among young females and males. However, a two sample test which was conducted on youth and children dataset indicated that the difference in mean age to HIV confirmation for males and females was not statistically significant.
The second category of the sample involved 114 HIV positive women who were mostly in their reproductive age. The mean age of these women was 35 years and their mean weight was 61 kg. In terms of their marital status 75 (65.8%) were married, 19 (16.7%) were single, 16 (14%) were divorced and 4 (3.5%) were widows. 83 (72.8%) had primary education while 26 (22.8%) had attained secondary education and the remained 5 (4.4%) has either college or university education. These education levels were reflected in the kind of occupations that these women were involved in as 75 (65.8%) of them were farmers, 35 (32.1%) were doing business in small scale and 4 (2.1%) were employed as office workers. The total number of children born by each woman under the study ranged from 0 to 8 children though majority 27 (23.68%) had three children.
HIV testing experiences among children and youths under study
Almost all respondents under this category 53 (98.1%) said that they had tested for HIV infection only once in their lifetime and claimed to have been infected by their mothers either during birth or when breastfeeding. However, there was still a big gap of the time between birth and age at which these adolescents were either confirmed to be HIV positive or started to use antiretroviral therapy. This tells us that most of the respondents were not sure whether they were infected at birth or sometimes later. The feedback which were recorded from their questionnaires indicated that 25.9% of the respondents claimed to have been confirmed at age interval 5 to 8 years, 22.2% at age interval 9-12 years and 20.4% said that they were confirmed to be HIV positive when they were 16 years old or above. Only 16.7% of the respondents said that they were confirmed to be HIV positive when they were still infants. This shows a considerable amount of time between the HIV infection and HIV confirmation dates. It is important to know that, the time at HIV infection in many cases is not the same as time at HIV diagnosis or confirmation. Although we may not put our whole trust on these data given by children, we cannot also completely ignore its implication in our communities if at all that was the true scenario. The delays in HIV confirmation imply more HIV transmission risks to other adolescents when they are at home and also at schools. It also have a negative impact on the monitoring, care and treatment of these HIV positive adolescents and youths especially in efforts to suppress their viral loads and general HIV/AIDS complications. Therefore, while keeping some possibilities that these adolescents and youth might have limited information about their HIV infection history, we still count this finding as a necessary input towards the attainment of HIV eradication target. It calls for better HIV testing services for adolescents born with HIV positive women in order to facilitate early detection and early treatment for those adolescents who will be diagnosed with HIV.
The graphical summary report for the age at HIV confirmation among the youths is presented in Figure 2. The minimum and maximum age at HIV confirmations for respondents were one (1) and twenty one (21) years respectively and their mean age at HIV confirmation were 7.8 years. The summary statistics of the data indicates a standard deviation of 5.147 and the variance of 26.489 which shows the extent to which our data set or distribution is scattered around the mean.
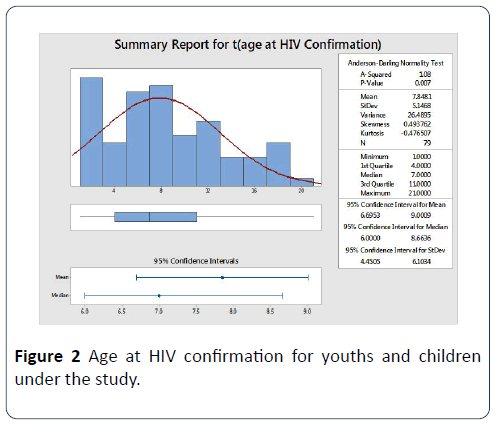
Figure 2: Age at HIV confirmation for youths and children under the study.
Looking at the graph and by assessing the mean and median values we conclude that the age at HIV confirmation among youths was negatively skewed. Since our dataset display a kurtosis statistic which is negative (-0.476507) and its graph is somehow flat peaked we may conclude that the data comes from a non-normal population. The box plot drawn at the lower part of the graph and its related five numbers summary indicates that the first quartile (Q1), median (Q2) and third quartile (Q3) of ages at HIV confirmation are 4, 7 and 11 respectively.
Normality test on youths and children datasets
Data collected on children and youths were both categorical and continuous. We carried a normality tests on age at HIV confirmation which was considered as continuous data. We used three different normality tests namely Anderson Darling, Ryan Joiner and Kolmogorov-Smirnov tests to check whether the children, youth and adolescents age at HIV Confirmation data was normally distributed. Anderson Darling statistic measures the area between the fitted line (based on chosen distribution) and the nonparametric step function (based on the plot points). It is presented as a squared distance that is weighted more heavily in the tails of the distribution. The obtained AD statistic was 1.085 and the p-value was 0.007 confirming that the given dataset does not follow a normal distribution. A Ryan-Joiner is closely related to Shapiro-Wilk normality test and it helps to test the normality of a given data by assessing the strength of correlation between the collected data and the normal scores of the data. A researcher can conclude that his/her dataset is from a normal population if the correlation coefficient is closer to 1 or if it falls below the appropriate critical value. A Ryan-Join (RJ) value for our dataset was 0.993 and the p-value was less than 0.001, and thereby concludes that the sample came from a normal distribution. The reason behind this mismatch can be the tendency of RJ test of avoiding rejecting normality due to rounding of data. Kolmogorov–Smirnov normality test compares the empirical cumulative distribution function of the sample data with the distribution expected if the data were normal.
The graphical summary shows that the p value for the Kolmogorov Smirnov test was 0.032 and the KS test was 0.108 so we reject the null hypothesis. From the results obtained in all normality tests above, we concluded that the HIV dataset for youth and adolescents was drawn from a non-normal population so in analyzing these data we should select statistical techniques that do not assume normality of data unless we normalize them through statistical transformation.
Distribution of youths and children’s age at HIV confirmation
We used MINITAB package to draw probability plots in order to determine the best distribution fit for the age at HIV confirmation for children and youths under the study. We fitted the datasets in different distributions like lognormal, logistic, Weibull, exponential, log logistic, gamma, smallest extreme value and largest extreme value. For Weibull, gamma and exponential we checked for two and three parameters distributional fits basing on their historical parameters. We also calculated the cumulative distribution function (cdf) and associated confidence intervals based on parameters estimated from our HIV datasets for youth and children. We compare all possible distributions and select the one with the smallest Anderson Darling statistic as our best fit. With MINITAB commands we generated an adjusted Anderson- Darling, or non-adjusted AD, statistic which uses the nonparametric step function based on the Kaplan-Meier method of calculating plot points. A thorough examination of the parameters associated with each of the fitted distribution showed that the best distribution fit for the children and youth data was the logistic with location with scale parameters of 7.466 and 2.973, respectively. The best distributional plot and the cumulative distribution function plot for youths and children’s age at HIV confirmation is shown in Figures 3 and 4.
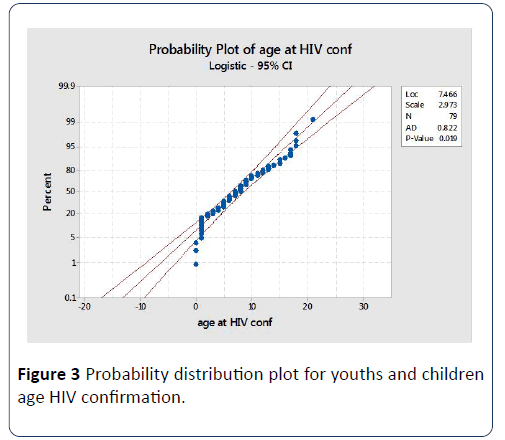
Figure 3: Probability distribution plot for youths and children age HIV confirmation.
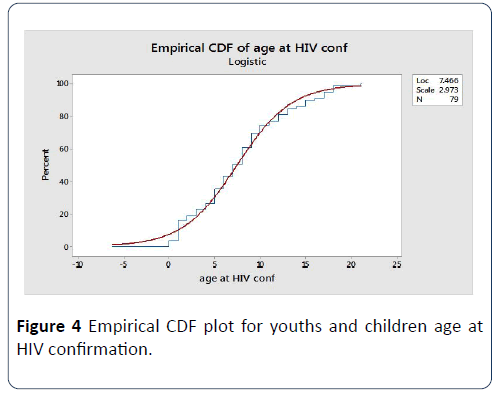
Figure 4: Empirical CDF plot for youths and children age at HIV confirmation.
Livelihood and occupation status of parents
We summarized information regarding the parental livelihood and occupation status of the children and youths who filled the questionnaire and found that 24 (44%) of these adolescents had already lost their fathers while 18 (33%) had already lost their mothers by the time this study was conducted. This implies more than 50% of the children and youths had lost at least one parent. These Figures are too high, considering that majority of these adolescents are less than 18 years old, so losing their parents at such young age will have a lot of impacts on their lives. It was also noted that 15 (28.6%) of these youths and children were double orphans (have lost both parents). This calls for more campaigns on the use of ARVs for parents who are HIV positive so as to extend their survivorship and be able to take care of their children. The data also shows that majority of the parents who are still alive are working as business men or women and farmers. Although these adolescents were sampled randomly, other occupations didn’t seem to be much affected by HIV. However, more investigation is needed to find out whether the other occupations have lesser HIV patients or it is because they have not tested for HIV.
Experiences of opportunistic diseases
We inquire from the children and youths whether they had experienced any opportunistic infection since their HIV diagnostics. Their responses on the type of opportunistic infection that they had experienced are summarized in Table 1. It was very encouraging to see that 45.2% had experienced none of the common infections for HIV patients. This could be a result of good adherence to antiretroviral therapy and good care from their caregivers.
| Type of opportunistic disease experienced |
No of cases |
% of cases |
| Skin infection |
6 |
11.3 |
| Chest problems |
9 |
17 |
| Pneumonia |
6 |
11.3 |
| Both skin infection and chest problems |
5 |
9.4 |
| Both Pneumonia and chest problems |
2 |
3.8 |
| Skin infection, chest problems and pneumonia |
2 |
3.8 |
| None of the diseases mentioned above |
24 |
45.2 |
| Total |
53 |
100 |
Table 1 Experiences of opportunistic diseases.
Distribution of age at HIV confirmation data for women under study
Using MINITAB package, we performed the normality tests to find out the distributional fit of the age at HIV confirmation for women. To determine whether these data come from a normal population, we plotted the data and assessed the Anderson–Darling, Ryan–Joiner, and Kolmogorov Smirnov statistics for normality test. The summary statistics obtained from the plots are shown in Table 2.
| Normality Test |
Test statistic and Value |
p-value |
| Anderson-Darling |
AD=1.1555 |
<0.005 |
| Ryan- Joiner |
RJ=0.965 |
<0.010 |
| Kolmogorov Smirnov |
KS=0.126 |
<0.010 |
Table 2 Normality tests for age at HIV confirmation in women dataset.
All the p-values of the tests were less than the chosen critical level of 0.05, suggesting that the population from which we draw our sample data is non-normal. The probability and empirical cumulative distribution plots were used to determine the distribution that characterizes our sample data and evaluate how well those distributions fit the datasets. The plotted graphs in Figures 4-6 indicated that our data closely fit a two parameter log logistic distribution with location and scale parameter of 3.345 and 0.1213 respectively. A random variable is considered to follow a log logistic distribution if the logarithm of that particular variable is logistically distributed. The log logistic distribution is often used by the biostatisticians and economists to solve problems related to growth curves or in studies which require binary responses. Unlike other distribution, the log logistic has no shape parameter and it is described by its scale, location, and threshold (for 3 parameter model) parameters. In other words, its probability density function has only one shape. We therefore defined the probability density function of the age at HIV confirmation for women data as
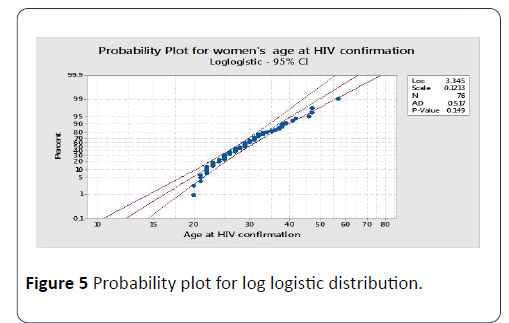
Figure 5: Probability plot for log logistic distribution. Figure
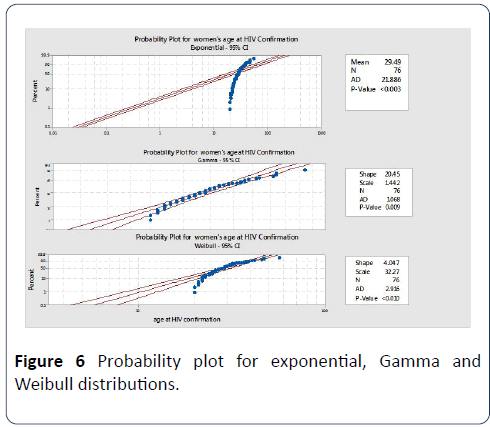
Figure 6: Probability plot for exponential, Gamma and Weibull distributions.

where α and β are scale and location parameters respectively
Probability plots for other distributions like exponential, Weibull and gamma did not fit well the data as shown in Figure 7.
Empirical cumulative distribution plots for women’s age at HIV confirmation
The empirical cumulative plot for women’s age at HIV confirmation also indicates that the log logistic distribution is the best fit unlike Weibull, exponential and Gamma. The estimated location and scale parameters of the fitted log logistic distribution are 3.3445 and 0.1213 respectively as indicated in Figure 7.
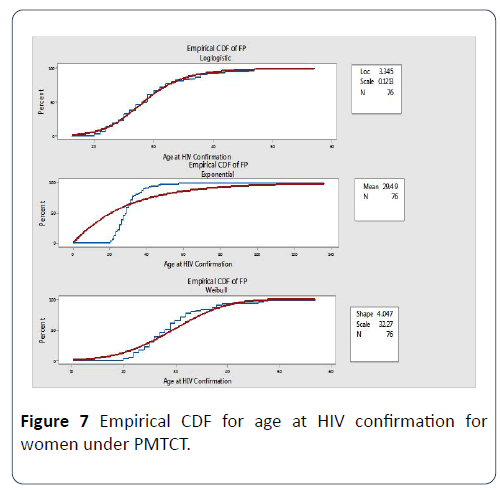
Figure 7: Empirical CDF for age at HIV confirmation for women under PMTCT.
Time interval between HIV Diagnosis and Initiation of the ARVs
Although the HIV/AIDS management policies and guidelines in Tanzania require whoever diagnosed with HIV infection to start treatment immediately, we noticed a wide gap between HIV diagnosis and the starting of ARV use. The lowest interval was 1 year while the largest interval was 17 years. The mean interval between HIV diagnosis and the starting of ARV was 2.2 years. The summary statistics of mean age at initiation of ARV shows that the women who had primary school education started ARVs almost seven (7) years later after HIV diagnosis while those with secondary education started ARVs 4 years after diagnosis. This indicates that education level had an influence on the time to start ARV after diagnosis.
Success stories on the implementation of PMTCT in Kilimanjaro region
Among the very pleasing findings obtained by this study is the large proportion of HIV free children who were born by HIV positive mothers in the region. This study found that 88 children were born by women who were already confirmed to be HIV positive and 70 (68.6%) of these children were HIV free while 18 (17.8) were infected with HIV either during labor or through breastfeeding. Although the global PMTCT goal was to eliminate MTC infection by 2015, the efforts that have been made so far by the government through its Ministry of Health and Social welfare is commendable and worthy mentioned. However, since our data were collected from one region in Tanzania, there is a need to conduct similar study in other regions to find out whether situation is the same. Another success story was on the proper adherence to ART which enabled more than 79% of the HIV positive women involved in our study to be in a good functional status and healthy enough to continue with their normal routines. Only 24 (20.3%) women reported to have experienced a serious opportunistic disease like skin and chest problems since their HIV/AIDS diagnosis.
The biggest challenge that we noticed from these women under the study was the unwillingness of their partners or husbands to test for HIV. Thirty-eight 38 (35.5%) of these women said that they were not aware of the HIV status of their husbands/partners by the time of this study. They added that most men are not ready to test for HIV even when they know the HIV status of their wives or female partners. We found that only 51 (47.7%) of women under the study were aware that their partners were also HIV positive and are on treatment. Surprisingly, we also found 19 (16.8%) of women under this study who reported that their husband had tested and retested for HIV and still be confirmed to be HIV negative.
Women’s awareness on their partner’s/ husbands HIV status
We realized that 38(36%) of women who participated in this study were not aware of their husbands’ or partners’ HIV status. This calls for more efforts in convincing all pregnant women to attend clinics with their partners or husbands in order to know their HIV status and start the medication immediately if found positive. However, the main reason that was pointed by these women was the unwillingness of their male partners to test for HIV and even when they test; they are not willing to share their test results with their wives or partners. Therefore, it is necessary for all stakeholders to find better ways of convincing men to change their attitudes towards HIV testing.
Attitudes towards voluntary HIV testing and retesting during pregnancy
The findings from the interview with health care givers showed that some pregnant women and their partners still have poor attitudes towards HIV testing and retesting. The response from one of the health caregivers in the visited facility regarding the readiness of the pregnancy women to test and retest for HIV infection showed that most of pregnant women start their clinic visits very late and once they are tested for the first time and found to be HIV negative they rarely retest.
Discussion and Conclusion
This study presents an exploration of HIV datasets collected from nine (9) health facilities in Kilimanjaro region in Tanzania. We first reviewed various guidelines and policies that have been in place since 2001 related to HIV and AIDS Management in Tanzania to familiarize ourselves on what is expected by the various stakeholders in managing the HIV epidemic. Our datasets were in main two categories, one for youths and children and the second category for women who were attending PMTCT and CTC clinics during our data collection process. From the youth and children's dataset we found several issues which are worth presented here as insights. Among them was the distributional fit of the age at HIV confirmation for youth and children (logistic distribution) that of women (log logistic distribution). Therefore, the probability function, survival and hazards functions were defined under the assumptions of the identified distributions. Another important observation was the issue of delay in HIV confirmation and ARV initiation for the youths and children who had HIV vertical transmission. We noticed a quite long period from HIV diagnosis to the initiation of ARV in most of the patients. This delay may have a big impact on the survival of these patients and on the HIV transmission rates. We also noticed a significant difference in HIV infection rates between male and female youths and children. Though we could not come up with the possible reason for that, we felt it is worth stated and measures should be taken to address such imbalance as a strategy to achieve a 90-90-90 goal in HIV management.
In order to promote children and youths awareness on HIV/ AIDS issues, the 2001 guidelines suggested the inclusion of reproductive health education in our primary and secondary school curricula to inform our children on how to protect themselves against HIV infection. It also suggested the establishment of youth’s sessions in various social settings to expose them with HIV and AIDS education. We recommend an extension of this study to assess the extent to which primary and secondary school students are informed about HIV/AIDS issues. In terms of parenthood status, the study found a large number of children who had already lost their parents and we felt this could be associated with the inappropriate and poor adherence to antiretroviral therapy among the HIV positive adults. We suggest that more efforts should be made to ensure the longer survival of HIV positive parents so that they may take care of their children. Another observation was on the issue of access to HIV data and its quality. In all health facilities that we visited, we failed to access enough and reliable patients’ information especially on last negative and first positive HIV test results from the hospital databases. We were informed that once a patient is diagnosed with HIV, there is no a tendency of tracking back when he/she was infected. Therefore, all patients’ information started from the day they were tested or diagnosed with HIV. This was the main factor that led us to change the approach of data collection from documentary analysis to Interview and questionnaire. This study recommends that the health care should try to inquire the possible infection time and hopefully the possible source of HIV infection for each newly diagnosed patient. Men’s reluctance to test for HIV is another big challenge as it affects the government efforts to reduce Mother to Child infections and increases the risks of new HIV infections in our society. Many HIV positive women claimed to be unaware of their husbands or partners’ HIV status. This roadblock towards the achievement of 90-90-90 HIV goal as the transmission rates will continue to be higher. We also noticed that most of the women do not abide to the HIV testing guidelines which require them to test for HIV at the first visit to clinic and repeat the test if the first test gives negative results. Majority of them reported that they did not retest especially after found HIV negative at their first clinic visit. We recommend that all stakeholders, especially the health care givers to ensure that all pregnant women and their partners abide to this policy in order to minimize the HIV transmission rates in Tanzania.
Acknowledgement
This study formed part of PhD programme of the main author, which was supported by the Organization for Women in Science in Developing Countries (OWSD). The authors gratefully acknowledge this support.
24265
References
- Glymour C (2017) Exploratory research is more reliable than confirmatory research.
- James J, Heckert A (2013) Exploratory data analysis. In NIST/SEMATECH, e-Handbook of statistical methods.
- Jelle JA (2011) Multiple testing for exploratory research. Statistical Science 26: 584-597.
- Kimmelman JMJ (2014) Distinguishing between exploratory and confirmatory preclinical research will improve translation. PLoSBiol 12: e1001863.
- Yang LF, Jiang H, Gu F (2014) Exploratory research of the equipment maintenance strategy analysis method in design stage of nuclear power plants. Scientific Net 1051: 1068-1073.
- Tanzania UR (2015) National guidelines for the management of HIV and AIDS. (4th edn.), Dares Salaam: Ministry of Health and Social Welfare.
- Tanzania UR (2001) National Policy on HIV/AIDS. Dares Salaam: Prime Minister's Office.
- Tanzania UR (2016) National HIV prevention operational plan 2016-2018. Dares salaam, Tanzania: Prime Minister's Office.
- Tanzania UR (2008) National Policy Guidelines for Collaborative TB/HIV Activities. Dares Salaam: Ministry of Health and Social Welfare.

