Keywords
Body weight; Sleeping hours; Eating habits; Working hours; Physiological activities; Srikakulam District
Introduction
Human body is having the different physiological activities, each and every activity will follow the perfect timings except eating, sleeping and working habits [1]. These activities have to follow by the man time to time in order to maintain all other activities perfect. These kind of people are very less now a days, Nobody is following the perfect timings. Today in the world most of the people are facing the overweight problems, High blood pressure and cardiac problems they all are because of stress and not following the proper timings for the food, sleep and etc. Coming to the eating habits most of the people in this world were all are following the junk foods rather than the healthy foods [2-8], Some people work less hours and sleep more hours or work more hours and sleep less hours this trend is leading to either fat deposition or causing stress [10,11], this was the trend going on now, Because of this there is the chance of all the cholesterol related problems. Normal sleeping hours for an individual is 6-7 hours [12] and coming to the food habits fruits, vegetables, leafy vegetables etc. everyone knows which one is good and what are the benefits they get if they eat the particular foods, So eating the healthy food time to time in a day, sleeping in time and working hours in time along with all these exercise or yoga etc. if they add into your daily habits it will leads to the perfect day and keeps you healthy.
There is no specific treatment and permanent treatment until and unless if the individuals will not follow the healthy way of living.
Aim
The main aim of this sstudy is to make the analysis of the data related to the body weights basing upon their eating, sleeping and working habits and to show the effect of them on basis of sex, age.
Methodology
This work was done in and around the Srikakulam district, Data was collected from 126 individual person basing upon their age, sex, weight, working hours, sleeping hours and eating habits (Table 1). Statistical analysis was done and show in the form of tables, graphs according to the data.
Table 1: Above chart shows the standard values for age and body weight.
| Height |
20 Yrs |
25 Yrs |
30 Yrs |
35 Yrs |
40 Yrs |
45 Yrs |
50 Yrs |
| Cm |
Feet/Inch |
| 147 |
4.15 |
45.4 |
47.2 |
48.8 |
50.4 |
52.2 |
53.6 |
54 |
| 150 |
4.11 |
46.3 |
48.1 |
49.5 |
50 |
53.1 |
54.5 |
55 |
| 152 |
5 |
47.2 |
49 |
50.9 |
52.7 |
54.5 |
55.9 |
58.3 |
| 155 |
5.1 |
48.6 |
50 |
51.8 |
54 |
55.4 |
56.8 |
57.2 |
| 158 |
5.2 |
49.5 |
51.3 |
53.8 |
55 |
56.6 |
57.1 |
58 |
| 160 |
5.3 |
50.9 |
53.2 |
54.5 |
56.3 |
58.1 |
59.5 |
60.4 |
| 163 |
5.4 |
52.2 |
53.6 |
55.9 |
57.7 |
59.4 |
61.3 |
61.8 |
| 165 |
5.5 |
53.6 |
55 |
57.2 |
59.5 |
61.3 |
62.7 |
63.1 |
| 168 |
5.6 |
55 |
58.1 |
60.4 |
60.9 |
62.7 |
64 |
65 |
| 170 |
5.7 |
56.3 |
58.7 |
61.4 |
62.7 |
64.5 |
65.9 |
66.8 |
| 173 |
5.8 |
58.1 |
60 |
62.2 |
64.5 |
66.3 |
67.7 |
69 |
| 175 |
5.9 |
60 |
61.8 |
64.5 |
66.8 |
68.6 |
70 |
71.3 |
| 178 |
5.1 |
61.8 |
63.6 |
66.3 |
68.6 |
70.4 |
71.8 |
73.1 |
| 180 |
5.11 |
63.6 |
65 |
68.6 |
70.9 |
72.7 |
74 |
75.4 |
| 183 |
6 |
67.7 |
70.4 |
72.7 |
75.4 |
77.7 |
79 |
80 |
Results
According to the above table (Table 2) most of the individuals were age of 15 – 30 found Overweight nature after then wards 30-45 age group people were coming next in the overweight zone (Figure 1). It is basing upon the standard data sheet.
Table 2: Total no. of individuals according to their age and bodyweights.
| S.No |
Age Range |
No of Individuals |
0 – 10 kg |
11 – 20 kg |
21 - 30 kg |
31 – 40 kg |
41 – 50 kg |
51 –60 kg |
61 –70 kg |
71 – 80 kg |
81 – 90 kg |
| 1 |
0 – 15 |
11 |
1 |
4 |
3 |
1 |
2 |
- |
- |
- |
- |
| 2 |
15 – 30 |
82 |
- |
- |
1 |
5 |
24 |
30 |
14 |
5 |
- |
| 3 |
30 – 45 |
21 |
- |
- |
- |
- |
2 |
10 |
7 |
1 |
1 |
| 4 |
45 – 60 |
7 |
- |
- |
- |
- |
- |
3 |
4 |
- |
- |
| 5 |
60 – 75 |
5 |
- |
- |
- |
- |
- |
2 |
3 |
- |
- |
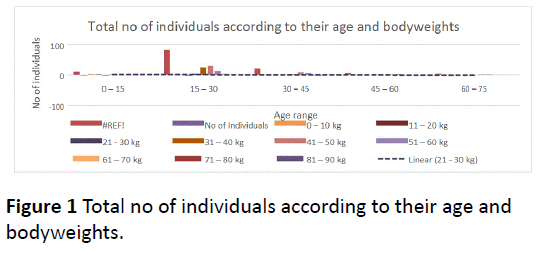
Figure 1: Total no of individuals according to their age and bodyweights.
This table (Table 3) show the number of ma le and female population in the collected data and no of people in the different age range in both of them (Figure 2).
Table 3: Determination of body weights by sex wise according to the survey study.
| No of Males |
No of people according to the body weight |
No of females |
No of people according to the body weight |
| |
Weight range |
Count |
|
Weight range |
Count |
| |
0 – 10 |
1 |
|
0 – 10 |
0 |
| |
11 – 20 |
2 |
|
11 – 20 |
2 |
| |
21 – 30 |
2 |
|
21 – 30 |
2 |
| |
31 – 40 |
1 |
|
31 – 40 |
5 |
| 66 |
41 – 50 |
8 |
60 |
41 – 50 |
21 |
| |
51 - 60 |
22 |
|
51 - 60 |
24 |
| |
61 – 70 |
24 |
|
61 – 70 |
5 |
| |
71 – 80 |
5 |
|
71 – 80 |
1 |
| |
81 - 90 |
1 |
|
81 – 90 |
0 |
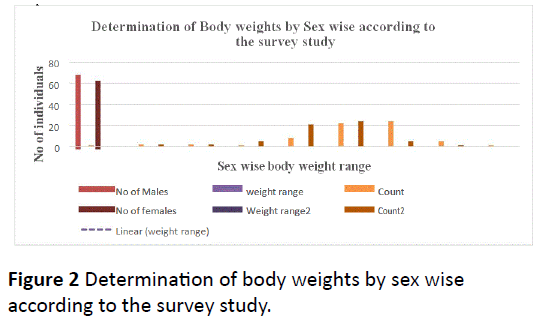
Figure 2: Determination of body weights by sex wise according to the survey study.
In this we find that among the 126 total data more no of people were found that they are eating junk foods maximum (56.3%) than healthy foods (Table 4 and Figure 3).
| Total No of Population |
No of People Having Junk Food |
No of People Having Healthy Foods |
| 126 |
71 |
55 |
Table 4: Determination of eating habits from the total population
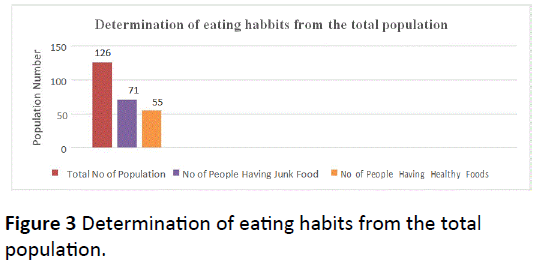
Figure 3: Determination of eating habits from the total population.
From the above table (Table 5) the data shows that more no of people were found sleeping (65%) more than the normal hours and their working hours is found to be normal (Figure 4).
Table 5: Determination of sleeping and working hours range from the total population.
| Total No of Population |
No of People according to their sleeping hours range |
No of People according to their working hours range |
| |
Sleep Range |
Count |
Work Range |
Count |
| |
5-7 |
13 |
3-6 |
14 |
| 126 |
7-9 |
82 |
6-9 |
83 |
| |
9-11 |
29 |
9-12 |
27 |
| |
11-13 |
2 |
12-15 |
2 |
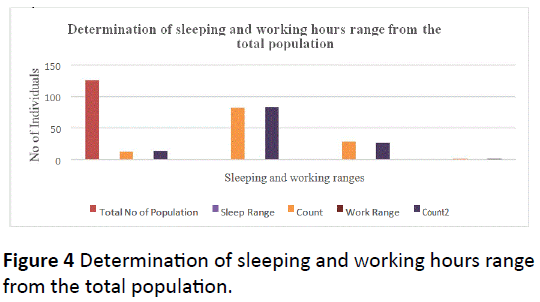
Figure 4: Determination of sleeping and working hours range from the total population.
Except in the 0 – 15 age group people remaining all age groups average body weights of junk food eaters are more than the healthy food eaters average body weight (Table 6), Even the 0 – 15 age group people the junk food eaters average body weight (18.2%) was near to the healthy food eaters average body weight (36%) (Figure 5).
Table 6: Comparison of junk food and healthy food eaters average body weight according to the age range.
| Age Range |
Junk food eaters average body weight |
Healthy food eaters average body weight range |
| 0-15 |
23 |
45 |
| 16-30 |
55 |
55 |
| 31-45 |
55.1 |
54 |
| 46-60 |
56 |
54.3 |
| 61-75 |
0 |
54.5 |

Figure 5: Comparision of junk food and healthy food eater’s average body weight according to the age range.
According to the age group dependence on either junk or healthy food both of them were found higher in this age group 16 – 30 but the highest rate dependence on food was found in junk food (Table 7 and Figure 6).
| Age Range |
No of junk food eaters |
No of healthy food eaters |
| 0-15 |
9 |
2 |
| 16-30 |
43 |
26 |
| 31-45 |
6 |
8 |
| 46-60 |
1 |
6 |
| 61-75 |
0 |
5 |
Table 7: Determination of junk food and healthy food eaters according to the age range.

Figure 6: Determination of junk food and healthy food eaters according to the age range.
According to the sex wise dependence on food males are found more dependence on junk foods However females were found equal in both of them (Table 8 and Figure 7).
| No of Males |
Junk food eaters |
Healthy food eaters |
No of Females |
Junk food eaters |
Healthy food eaters |
| 66 |
41 |
25 |
60 |
30 |
30 |
Table 8: Determination of junk food and healthy food eaters by sex wise.
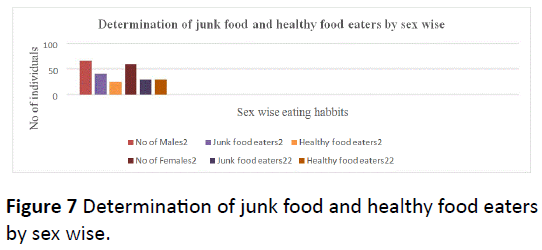
Figure 7: Determination of junk food and healthy food eaters by sex wise.
Discussion
The above results are showing that the most of the people are now a days depending on junk food and no maintenance of time level for sleeping etc. Most of the people are found in the age group of 15 – 30 that is mainly because some of them will go for the study purpose to the another country or state and some of them will go for the job purpose to another country or state, So after going there no body will be there for to stop them for eating purposes and gatherings, parties etc. these are all the factors which will cause them to effect of food, sleeping and finally to the overweight. This overweight will leads to the cardiac problems, obesity etc.
The only solution for this is to be in our limits and have to follow the timings for everything and being cautious in the sense of food sleeping, working will prevent and protect the body from the overweight problems, nutrition problems and timing problems etc gastric, ulcers.
Conclusion
According to the collected data by the tabular and graphical analysis among the 126 individuals most of the today population were depending on junk foods rather than the healthy foods and it was found mostly in the males according to the sex wise and in the age range of 16 – 30 according to the age, Even the average body weights were also found more in the junk food eaters comparing to the healthy food eaters, according to the aim of the project and the data collected the sleeping and working hours of the individuals are also collected most of them were found to be sleeping above than normal hours and also working hours found to be normal. Also according to the weights gathered the overweight nature was found in the age group of 15 – 30.
9497
References
- Kushner RF (2007) Treatment of the Obese Patient (Contemporary Endocrinology). Totowa, NJ: Humana Press, New Jersey, United States. pp: 158.
- Adams JP, Murphy PG (2000) Obesity in anaesthesia and intensive care. Br J Anaesth 85: 91–108.
- Imaz I, Martínez-Cervell C, García-Alvarez EE, Sendra-Gutiérrez JM, González Enríquez J (2008) Safety and effectiveness of the intragastric balloon for obesity. A meta-analysis. ObesSurg 18: 841–846.
- https://www.naturalhealthcure.org/general-health/causes-of-obesity-effects-and-naturalcures
- Wang X, Ouyang Y, Liu J, Zhu M, Zhao G, et al. (2014) Fruit and vegetable consumption and mortality from all causes, cardiovascular disease, and cancer: systematic review and dose-response meta-analysis of prospective cohort studies. BMJ Clinic Res 349: g4490.
- Executive Summary (2010) Policy and Action for Cancer Prevention Food, Nutrition, and Physical Activity. p1.
- Bingham R,Sejnowski T, Siegel J,Dyken ME,Czeisler C (2007) "Waking Up To Sleep" (Several conference videos) The Science Network.
- https://www.ninds.nih.gov/disorders/brain_basics/understanding_sleep.htm
- Hobson JA, Pace-Scott EF, StickgoldR (2000) Dreaming and the brain: Toward a cognitive neuroscience of conscious states.Behav Brain Sci 23: 793- 842.

