Guosong Wu1,2*, Jingfu Mao1, Lu Zhao1, Yang Li3, Siwen Li4 and Qunhong Wu1
1College of Public Health, Harbin Medical University, Harbin, China
2Department of Community Health Sciences, University of Calgary, Calgary, Canada
3First Affiliated Hospital of Harbin Medical University, Harbin, China
4Harbin Children`s Hospital, Harbin, China
- *Corresponding Author:
- Qunhong Wu
157 Baojian Road, Harbin
Heilongjiang, China
Tel: +86 (0451) 87502860
E-mail: wuqunhong@163.com
Received date: September 12, 2019; Accepted date: October 25, 2019; Published date: November 02,
2019
Citation: Wu G, Mao J, Zhao L, Li Y, Li S , et al. (2019) The Association of Patient Safety Culture with Hospital Safety Performance: A Cross-sectional Survey. Health Sci J 13:6.
Keywords
Patient safety; Safety culture; Medical errors; Performance measures
Introduction
The theme of patient safety has been extensively studied since the publication of two landmark reports “To Err is Human” and “Crossing the Quality Chasm” in which the authors advocated creating a culture of safety could substantially avoid the adverse events and medical errors in health care system [1,2]. In 2009, World Health Organization (WHO) ranked patient safety culture as the as the third most popular topic of fifty global top-priority research topics. The concept of safety culture refers to “the product of individual and group values, attitudes, perceptions, competencies, and patterns of behaviour that determine the commitment to, and the style and proficiency of, an organization’s health and safety management” [3]. Although hospitals strive in pursuing high quality and safety of health services, evidence suggests the urgency of enhancing a culture of safety. The measure of patient safety culture is the first necessary step to improve the culture of safety within a clinical setting. A successful initiative conducted by AHRQ in measuring patient safety culture is the development of Hospital Survey on Patient Safety Culture (HSOPSC), this led the measurement of safety culture literature and has been widely applied due to its high reliability and validity [4]. The survey questionnaire contains ten dimensions of safety culture and two dimensions of patient safety outcome [3]. Leveraging this measurement, Hansen LO and collegues` research indicated hospitals with a higher overall safety culture score associated with a decrease of hospital readission rate [5]. The education background and work enviroment of health workers were positively associated with patient safety outcomes [6]. The impact of staff safety behaviour on patient sfaety outcomes was consider in Neal and Griffin`s study in 2002 [7]. They catagrized safety behavior into two types: compliance and participation behavior. Their results indicated that a culture of safety can promote safety behavior among health workers. Studies revealed patient safety culture was associated with patient outcomes. However, the current literature of exploring the association of patient safety culture and hospital safety performance was limited in one specific department [8,9] or one specific group of population [10,11]. The safety behavior might be an important knot between patient safety culture and hospital safety performance. Published researches’ definition of safety performance is limited to negative indicators (e.g., readmission rate, adverse events, medical error) [12,13], positive indicators are barely used in previous studies. Literature evidence in assessing the association of patient safety culture and safety performance remains unclear and inconsistent in developing countries. To address this literature gap, we conducted this study with an aim of establishing the association of patient safety culture and hospital safety performance in five tertiary hospitals in northern China. We proposed the following research theoretical model and hypothesis (Figure 1).
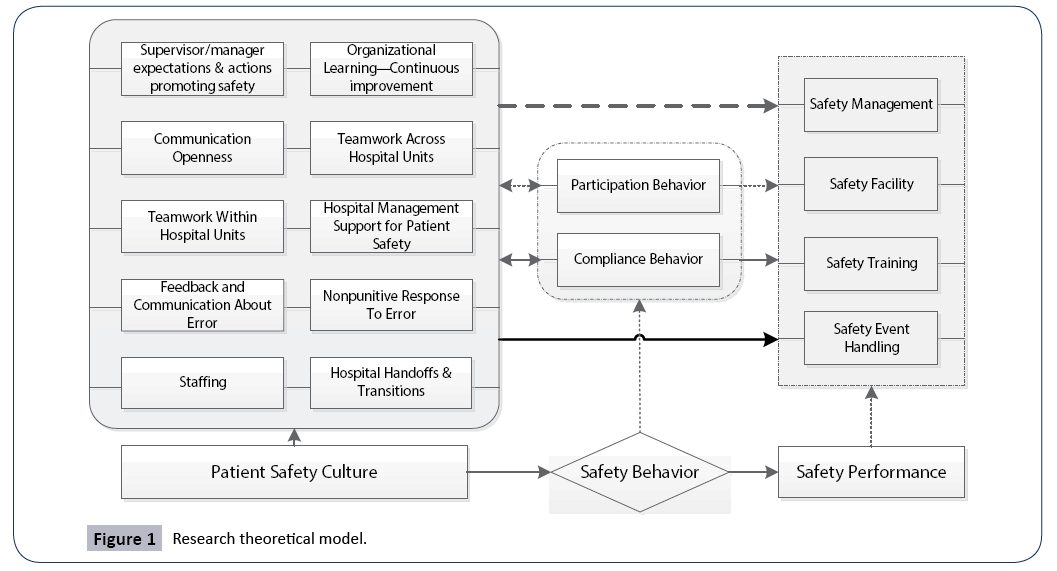
Figure 1: Research theoretical model.
Hypothesis 1: Patient safety dimensions positively associated with the safety performance.
Hypothesis 2: Staff safety behavior exerts positive effects on safety performance.
Methods
Development of survey questionnaire
Two translators translated the original HSOPSC into Chinese. Staff safety behavior was categorized as compliance behavior and participation behavior. We defined hospital safety performance as all measurable results that acquired from health care delivery. It includes four dimensions: safety management: the organizations and principles developed in purpose of safety management; safety facility: the facilities used to avoid harm to patients and staff; safety training: training that hospital provided for staff and patients to ensure care safety; and safety events: the number of errors reported and the disposal procedure when error occurs. Discrepancies in the development of questionnaire were solved through group discussion involved senior health service researchers, doctors, nurses and translators. The finalized survey questionnaire has 16 dimensions (Table 1) and the answers followed the 5-point Likert scale of agreement/frequency (Strongly Disagree/Never =1; Strongly Agree/Always=5). We conducted a pilot study to test the reliability and validity of this questionnaire and the results indicated a good performance. This on-site cross-sectional study recruited a convenience sample of five tertiary hospitals with over 1000 beds respectively in Harbin, China. Purposive sampling was applied during the hospital unit selection in order to cover all important clinical departments in hospital. Under the agreement of the research team and participated hospitals, a group of trained investigators distributed the questionnaires in each department during the morning meeting. The attending staff voluntarily and anonymously participated in this survey. A small gift was distributed to participants when the questionnaire was returned to ensure the questionnaire answer quality and maximize response rates.
Table 1 Survey questionnaire dimensions.
| Patient safety culture |
Supervisor/Manager Expectations and Actions Promoting Safety |
4 items |
| Organizational Learning—Continuous improvement |
3 items |
| Teamwork Within Hospital Units |
4 items |
| Communication Openness |
3 items |
| Feedback and Communication about Error |
3 items |
| Nonpunitive Response to Error |
3 items |
| Staffing |
4 items |
| Hospital Management Support for Patient Safety |
3 items |
| Teamwork Across Hospital Units |
4 items |
| Hospital Handoffs and Transitions |
4 items |
| Safety behavior |
Participation Behavior |
5 items |
| Compliance Behavior |
5 items |
| Safety performance |
Safety Management |
7 items |
| Safety Facility |
5 items |
| Safety Training |
6 items |
| Safety Event Report |
6 items |
Statistical Analysis
Descriptive statistics (proportions, medians and interquartile range or means and standard deviations as appropriate) were employed to describe the participants’ characteristics. Cronbach’s alpha was calculated to describe the reliability of survey questionnaire. Logistic regression was used to establish the association of patient safety culture and hospital safety performance adjusted for the staff age, gender, education background, tittle, work hours per week and health professional years. Stepwise regression was used to refine the logistic model (Alpha-to-Enter=0.1, Alpha-to-Remove=0.2). Odds ratios (OR) and 95% confidence intervals (CI) was employed to summarize measures of association. P value of 0.05 was considered as significant level. Statistical analysis was performed using Stata SE 13.1 (Stata Corp. LP, College Station, TX, USA).
Ethical approval
Local ethics board approved this study and all hospitals were informed prior to the survey. All participated staff was informed of the research purpose through a cover letter of the questionnaire and voluntarily joined the investigation. We are unable to disseminate research results to any participants due to our anonymous procedure.
Results
Sample and response statistics
Five tertiary hospitals with over 1000 beds respectively agreed to participated in this survey. We distributed 600 questionnaires and 507 of them were returned and analyzed. Overall response rate was 84.5%. Demographic characteristics of survey participants were summarized in Table 2. The participants were physicians and nurses from Internal Medicine/non-surgical (147, 29%), Surgery Department (138, 27%), Psychiatry/mental health (91, 18%), Intensive care unit (70, 14%), Obstetrics (20, 4%) and others (41, 8%). There were 115 physicians and 382 nurses, and among them, 81% was female. About 60% of the participants were around 30 years old. They had about 3 to 9 years of health professional experience (42.5%). Specifically, most of them (45.2%) had 3 to 9 years of experience in their hospital unit or work area. About 80% of them have bachelor’s degrees and master’s degrees. Workload is critical: 57% of the participants worked more than 40 hours per week. Stratify analysis indicated that 83.5% doctors and 49.7% nurses worked more than 40 hours a week.
Table 2 Demographic characteristics of participants.
| |
Overall (n/%) |
Physician (n/%) |
Nurse (n/%) |
| Hospital Type |
|
|
|
| Teaching |
334 (65.88) |
87 (26.05) |
247 (73.95) |
| Nonteaching |
173 (34.12) |
28 (16.18) |
145 (83.82) |
| Gender |
|
|
|
| Male |
96 (18.93) |
64 (55.65) |
32 (8.16) |
| Female |
411 (81.07) |
51 (44.35) |
360 (91.84) |
| Age |
|
|
|
| 18-25 |
65 (12.82) |
4 (3.48) |
61 (15.56) |
| 25-35 |
303 (59.77) |
58 (50.43) |
245 (59.76) |
| 35-45 |
107 (21.1) |
39 (33.91) |
68 (21.1) |
| ≥45 |
32 (6.31) |
14 (12.17) |
18 (6.31) |
| Title |
|
|
|
| Assistant |
275 (54.24) |
32 (27.83) |
243 (61.99) |
| Associate |
163 (32.15) |
39 (33.91) |
124 (31.63) |
| Vice professor |
44 (8.68) |
29 (25.22) |
15 (3.83) |
| Professor |
13 (2.57) |
9 (7.83) |
4 (1.02) |
| Else |
12 (2.36) |
6 (5.22) |
6 (1.53) |
| Education |
|
|
|
| Undergraduate |
100 (19.72) |
0 |
100 (25.51) |
| Graduate |
407 (80.28) |
115 (100) |
292 (74.49) |
| Work Hours Per Week |
|
|
|
| £40 |
216 (42.6) |
19 (16.52) |
197 (50.26) |
| > 40 |
291 (57.4) |
96 (83.48) |
195 (49.74) |
| Current Area/Unit work experience (year) |
|
|
|
| £2 |
133 (26.28) |
37 (32.17) |
96 (24.55) |
| 3-10 |
224 (44.27) |
41 (35.65) |
183 (46.8) |
| 10-20 |
100 (19.76) |
24 (20.87) |
76 (19.44) |
| ≥20 |
49 (9.68) |
13 (11.3) |
36 (9.21) |
| Current Hospital work experience (year) |
|
|
|
| £2 |
107 (21.23) |
27 (23.48) |
80 (20.57) |
| 3-10 |
228 (45.24) |
44 (38.26) |
184 (47.3) |
| 10-20 |
109 (21.63) |
27 (23.48) |
82 (21.08) |
| ≥20 |
60 (11.9) |
17 (14.78) |
43 (11.05) |
| Healthcare work experience (year) |
|
|
|
| £2 |
95 (18.89) |
24 (20.87) |
71 (18.3) |
| 3-10 |
214 (42.54) |
39 (33.91) |
175 (45.1) |
| 10-20 |
127 (25.25) |
29 (25.22) |
98 (25.26) |
| ≥20 |
67 (13.32) |
23 (20) |
44 (11.34) |
Positive response rate
We calculated the positive response rate for each dimension. The numerator is defined as the number of positive responses (“Strongly agree/Agree,” or “Always/Most of the time) to the items in the dimension, and the denominator is the total number of responses to the items (positive, neutral, and negative) in the dimension. The positive response rate of patient safety culture part in this study was compared with the response rate of the AHRQ 2016 report. The internal validity was assessed with Cronbaha Alpha. Most dimensions of this survey showed a good validity with a Cronbaha Alpha over 0.6. And overall, the survey questionnaire reached an internal validity of 0.94. A comparison of our validity test results with HSOPSC were listed in Table 3.
Table 3 Positive response rates (PPR) and Cronbaha Alpha for survey questionnaire. *Pearson's chi-squared test p value NA, Not associated.
| Dimensions |
PPR |
Cronbaha Alpha |
| China (507) |
US (128479) |
p* |
China (507) |
US (128479) |
p* |
| Supervisor/Manager Expectations and Actions Promoting Safety |
78% |
77% |
0.783 |
0.72 |
0.75 |
0.12 |
| Organizational Learning-Continuous Improvement |
86% |
72% |
0.000 |
0.72 |
0.76 |
0.04 |
| Teamwork Within Units |
88% |
80% |
0.000 |
0.88 |
0.83 |
0.00 |
| Communication Openness |
36% |
62% |
0.000 |
0.58 |
0.72 |
0.00 |
| Feedback and Communication About Error |
73% |
67% |
0.008 |
0.77 |
0.78 |
0.55 |
| Nonpunitive Response to Error |
29% |
42% |
0.000 |
0.51 |
0.79 |
0.00 |
| Staffing |
46% |
49% |
0.234 |
0.38 |
0.63 |
0.00 |
| Management Support for Patient Safety |
36% |
68% |
0.000 |
0.51 |
0.83 |
0.00 |
| Teamwork Across Units |
66% |
58% |
0.000 |
0.61 |
0.80 |
0.00 |
| Handoffs and Transitions |
51% |
44% |
0.003 |
0.73 |
0.80 |
0.00 |
| Participation Behavior |
78% |
NA |
NA |
0.83 |
NA |
NA |
| Compliance Behavior |
71% |
NA |
NA |
0.74 |
NA |
NA |
| Safety Management |
64% |
NA |
NA |
0.85 |
NA |
NA |
| Safety Facility |
70% |
NA |
NA |
0.70 |
NA |
NA |
| Safety Training |
69% |
NA |
NA |
0.82 |
NA |
NA |
| Safety Event Handling |
66% |
NA |
NA |
0.65 |
NA |
NA |
| Over ALL GRADE |
60% |
NA |
NA |
0.94 |
NA |
NA |
Analysis of the association
Logistic regression was utilized to analysis the association of patient safety culture, staff safety behavior and hospital safety performance. Multivariable-adjusted analyses of hospital safety performance were summarized in Table 4. In our final logistic regression models, after controlling for the physician/nurse factors (age, gender, education background, professional, work hours per week and healthcare working experience in years), we found patient safety culture dimensions were associated with hospital safety performance. The team work within/ across hospital units were significantly associated with safety management, with odds ratio of 0.3, 95% CI (0.15-0.61) and 0.53, 95% CI (0.34-0.84), respectively. Staff safety participation and compliance behavior were protective factors for hospital safety management, OR=0.23, 95% CI (0.13-0.40) and OR=0.51, 95% CI (0.29-0.87). Safety facility was associated with Feedback and Communication about Error OR=0.47, 95% CI (0.23-0.96) and Hospital Handoffs and Transitions OR=2.52, 95% CI (1.02- 6.26). Patient safety training was significantly associated with Teamwork Across Hospital Units. Staff safety behavior exerts positive impacts on hospital safety performance. The participation behavior was positively associated with safety management OR=0.23, 95% CI (0.13-0.40) and patient safety training OR=0.21, 95% CI (0.11-0.38). The compliance behavior was associated with safety management OR=0.51, 95% CI (0.29- 0.87), safety facility OR=0.13, 95% CI (0.07-0.26) and patient safety training OR=0.30, 95% CI (0.17-0.51). Patient safety event handling was associated with Supervisor/manager expectations and actions promoting safety OR=1.80, 95% CI (1.06-3.05), Organizational Learning OR=0.51, 95% CI (0.27-0.96), Teamwork Across Hospital Units OR=0.47, 95% CI (0.28-0.80), participation behavior OR=0.42, 95% CI (0.42-0.73) and compliance behavior OR=0.48, 95% CI (0.27-0.83). Patient safety event report was significantly associated with Hospital Handoffs and Transitions OR=5.36, 95% CI (1.87-15.33).
Table 4 Multivariable analysis of hospital safety performance. OR: Odds Ratio, CI: Confidence interval.
| Variable |
Adjusted OR (95% CI) |
P |
| Safety management |
| Gender |
2.59 (1.38-4.88) |
0.003 |
| Professional |
0.50 (0.27-0.93) |
0.027 |
| Work hours per week |
1.61 (1.04-2.47) |
0.031 |
| Teamwork Within Hospital Units |
0.30 (0.15-0.61) |
<0.001 |
| Teamwork Across Hospital Units |
0.53 (0.34-0.84) |
0.006 |
| Hospital Handoffs and Transitions |
0.54 (0.33-0.87) |
0.012 |
| Participation Behavior |
0.23 (0.13-0.40) |
<0.001 |
| Compliance Behavior |
0.51 (0.29-0.87) |
0.013 |
| Safety facility |
|
|
| Gender |
7.51 (3.07-18.38) |
<0.001 |
| Tittle |
0.30 (0.13-0.67) |
0.003 |
| Feedback and Communication about Error |
0.47 (0.23-0.96) |
0.039 |
| Hospital Handoffs and Transitions |
2.52 (1.02-6.26) |
0.046 |
| Compliance Behavior |
0.13 (0.07-0.26) |
<0.001 |
| Safety training |
|
|
| Age |
0.57 (0.37-0.9) |
0.015 |
| Gender |
1.75 (1.11-2.76) |
<0.001 |
| Professional |
0.32 (0.16-0.65) |
<0.001 |
| Education |
1.86 (1.08-3.21) |
0.025 |
| Teamwork Across Hospital Units |
0.58 (0.37-0.90) |
0.014 |
| Participation Behavior |
0.21 (0.11-0.38) |
<0.001 |
| Compliance Behavior |
0.30 (0.17-0.51) |
<0.001 |
| Patient safety event handling |
|
|
| Gender |
2.67 (1.40-5.10) |
0.003 |
| Professional |
0.31 (0.16-0.61) |
<0.001 |
| Work hours per week |
1.87 (1.22-2.86) |
0.004 |
| Supervisor/Manager Expectations and Actions Promoting Safety |
1.80 (1.06-3.05) |
0.029 |
| Organizational Learning-Continuous improvement |
0.51 (0.27-0.96) |
0.037 |
| Teamwork Across Hospital Units |
0.47 (0.28-0.80) |
0.006 |
| Participation Behavior |
0.42 (0.42-0.73) |
0.002 |
| Compliance Behavior |
0.48 (0.27-0.83) |
0.009 |
| Tittle |
0.4 (0.18-0.91) |
0.03 |
| Hospital Handoffs and Transitions |
5.36 (1.87-15.33) |
<0.001 |
Discussion
This multicenter cross-sectional study found that patient safety culture was associated with safety performance. Staff safety behavior exerts positive effects on safety performance. The Teamwork Within and Across Hospital Units, Hospital Handoffs and Transitions should be used as a target for future quality and safety improvement initiatives to reduce medical errors. The sample of this study covered most of the hospital departments (e.g., Internal Medicine, Surgery, Pharmacy, Psychiatry, ER, ICU, Gynecology, Anesthesiology, etc.). The investigated physicians and nurses contributed a high response rate of 84.5%. Our survey tool was validated prior to this investigation. Our survey questionnaire showed a similar validity compare to the HSOPSC user guide. Our results indicated patient safety culture dimensions had a positive impact on hospital safety performance. For example, good teamwork within/across hospital units lead to a better safety performance. The results are consistent with current literature. Previous studies found that improve the communication between members could decrease the mortality within a critical care unit [10]. A systematic review work also suggested that patient safety culture was associated with patient outcomes in nursing environment [14]. However, those studies were limited to single department/population. The findings in our study closed the knowledge gap and provided comprehensive evidences in establishing the association between patient safety culture and outcomes. The staff safety behavior was introduced in this particular study to measure its impact on safety performance. It demonstrated in our results as a significant protective factor for safety performance. The staff safety behavior includes compliance behavior and participation behavior. Neal and Griffin indicated that safety culture could promote staff safety behavior [7]. Our results showed, staff safety behavior is significantly associated with hospital safety performance, which means, staff safety behavior is the media of patient safety culture and hospital safety performance. Improving staff safety behavior may lead to both positive changes in safety culture and hospital safety performance. This might be an efficient route for future quality improvement iniciatives. The definition of hospital safety performance in this study not only included the hospital/patient safety outcomes, but also the hospital management of safety, facilities and trainings for safety, which we believe is a better way of understanding the essencials of hospital performance. Following factors should be considered when interpreting our results. First, the accuracy of health professionals` self-reported data is a known issue. The sampling bias may occur due to our convenient sampling method. Second, this study measured the association of patient safety culture and hospital safety performance with a cross-sectional design, therefore, causal inference is not applicable. Third, the external validity of this study was slightly impacted since the healthcare policy and resource allocation may different in other jurisdictions.
Conclusions
This study indicated that patient safety culture was associated with safety performance and staff safety behavior exerts positive effects on safety performance. The Teamwork Within and Across Hospital Units, Hospital Handoffs and Transitions could be targeted as a prioritization for future quality and safety improvement initiatives to optimal hospital safety performance.
Competing Interests
No competing interests reported.
24761
References
- Donaldson MS, Corrigan JM, Kohn LT (2000) To err is human: building a safer health system. National Academies Press.
- Institute of Medicine (2001) Crossing the Quality Chasm: A New Health System for the 21st Century. Washington, DC: The National Academies Press.
- Sorra J, Gray L, Streagle S. AHRQ Hospital Survey on Patient Safety Culture: User’s Guide.
- Hospital Survey on Patient Safety Culture. Content last reviewed August 2018. Agency for Healthcare Research and Quality, Rockville, MD.
- Hansen LO, Williams MV, Singer SJ (2011) Perceptions of hospital safety climate and incidence of readmission. Health services research 46:596-616.
- Ausserhofer D, Schubert M, Engberg S, Blegen M, De G, et al. (2012) Nurse-reported patient safety climate in Swiss hospitals: a descriptive-explorative substudy of the Swiss RN4CAST study. Swiss Med Wkly 20:142.
- Neal A, Griffin MA (2002) Safety climate and safety behaviour. Australian journal of management 27:67-75.
- Ballangrud R, Hedelin B, Hall-Lord ML (2012) Nurses perceptions of patient safety climate in intensive care units: a cross-sectional study. Intensive and Critical Care Nursing 28:344-354.
- Kirwan M, Matthews A, Scott PA (2013) The impact of the work environment of nurses on patient safety outcomes: a multi-level modelling approach. International journal of nursing studies 50:253-263.
- Diya L, Van den Heede K, Sermeus W, Lesaffre E (2012) The relationship between in‐hospital mortality, readmission into the intensive care nursing unit and/or operating theatre and nurse staffing levels. Journal of advanced nursing 68:1073-1081.
- Schubert M, Ausserhofer D, Desmedt M (2013) Levels and correlates of implicit rationing of nursing care in Swiss acute care hospitals—a cross sectional study. International Journal of Nursing Studies 50:230-239.
- Singer S, Lin S, Falwell A, Gaba D, Baker L (2009) Relationship of safety climate and safety performance in hospitals. Health services research 44:399-421.
- Olds DM, Aiken LH, Cimiotti JP, Lake ET (2017) Association of nurse work environment and safety climate on patient mortality: A cross-sectional study. International journal of nursing studies 74:155-161.
- DiCuccio MH (2015) The relationship between patient safety culture and patient outcomes: a systematic review. Journal of patient safety 11:135-142.

