Keywords
Trend; Associated factors; Maternal death; Ethiopia
Introduction
Maternal mortality ration (MMR) globally has fallen by 45% from 523,000 (380/100,000) in 1990 to 289 000 (210/100,000) in 2013 yielding an average annual decline of 2.6%. It is one of the statistics showing the largest degree of disparity between developed and developing countries. It clearly highlights the huge gap between developed and developing countries [1-5]. In 2013, Developing countries account for 99% (286,000) of the global maternal deaths, of thoses sub-Saharan Africa region alone accounting for 62% (179,000) followed by Southern Asia (69,000). Oceania is the region with the fewest maternal deaths at 510. The MMR in developing regions was 14 times higher than developed regions. All regions experienced a decline of 37% or more in MMR between 1990 and 2013. The highest reduction in the 23-year period was in Eastern Asia (65%). In Africa there is 47% reduction in MMR between 1990 and 2013 from 870 to 460 per 100,000. The highest reduction in Africa is experienced in North Africa which is (57%) [6,7].
In general in SSA there is 49% reduction from 990 to 510 per 100,000, but eastern Africa reduces MMR by 57% from 1000 to 440 per 100,000 which are highest in SSA. Ethiopia decreased maternal death from 1400 to 420 per 100,000 MMR between 1990 and 2013 which is making progress to achieve MDG 5 by 2015 [2,3,7].
The majority of maternal deaths in developing countries are due to five major direct obstetric complications: hemorrhage, infection, unsafe abortion, hypertensive disorders of pregnancy, and obstructed labor. 70–80% is due to direct obstetric causes (complications of pregnancy, labor, delivery or the postpartum period). Indirect causes of maternal death account for women who die from any other disease during the maternal period (pregnancy and up to 42 days postpartum or post abortion). Indirect causes represent a varying spectrum of the burden of maternal deaths [7].
Societies that have achieved the lowest level of maternal mortality through preventing pregnancies, reducing incidence of certain pregnancy complications, and having adequate facilities and well trained staff to treat the complications [8-12].
Ethiopia is making progress to achieve MDG 5a by reducing MMR by 69% from 1990 MMR, even though there are inconsistencies between figures at international, national level and different regional data’s. Between1st July 2010 to 30th June 2012 there were an increase of MMR in public hospitals of Tigray regional state. The 2011 EDHS (676/100,000) shows that there is bit increment of MMR from 2005 EDHS (673/100,000), even though the 95 % CI is coinciding. 2005 EDHS report (673/100,000) and joint estimation by WHO, UNICEF, UNFPD and world bank in same year (740/100,000) have wide variation [7,13-16].
Although our country reduces the maternal death from previous times as the report of international organizations, still the number of death that occurs currently is high as WHO maternal death classification. In contrary, some hospital based study in our country shows inconsistency in death trend. So the need of further study is unquestionable to identify trend and factors affecting maternal death. Particularly institutions based study is important to observe the trend, and associated factors of maternal death.
Methods
Study area and period
The study was conducted in Mizan-Tepi university teaching & Bonga general hospital. Which are located southwest, Ethiopia. The hospitals provide care for south-western Ethiopia with a catchment population of about 5 million. Internal medicine, surgery, obstetrics and gynecology and pediatrics are the major departments. Institution based case control study design was used from 2011 – 2015 charts.
The source Population of the study was all charts of mothers who visited Mizan-Tepi university teaching & Bonga general hospital for maternal health service utilization. Whereas the Study Population for case was all charts of mothers who were passed away during pregnancy, delivery and 42 days after delivery in Mizan-Tepi university teaching & Bonga general hospital between 2011 to 2015, cases was ascertained based on the information of chart. If death was reported on the chart, it has been taken as a case. While, all charts of mothers who visited Mizan-Tepi university teaching & Bonga general hospital for maternal health service utilization from 2011 to 2015 were Controls.
The sample population was randomly selected cards of cases and controls during the study period. Cases that fulfill the standard definitions of maternal mortality given by ICD – 10 and controls which came for maternal health service utilization were included. But cases that were registered on the log book but whose charts’ were missed and Charts that didn’t include the assessment of admission and status of mother (dead or alive) during discharge were excluded.
Sample size was determined using epi-info version 7 by taking the following assumptions: 95% CI, and 90% power, odds ratio of 0.27 (odds of women having less than 24 labour length over odds of women having greater than 24hr labour length) from study done in Tigray region, case to control ratio 1:4 and the prevalence of exposure among controls were 97.6% (proportion of controls delivered in less than 24hr) taken from unmatched case control study done in Tigray regional state [14]. A total of 975 charts, 195 cases and 780 controls were planned to include in the study. But due to poor registration and shortage of sample, we included 595 samples, 119 cases and 476 controls [15,16].
Records of both cases and controls were selected from delivery ward, operation theatre, PNC ward; gynecologic ward which full fills the inclusion and exclusion criteria of the study [17-20].
First cases were identified from log book or registration book, which were found in the study period, from respective wards then sampling frame was prepared in both hospitals. Then after, 119 cases were proportionally allotted for each hospital. After identifying the cases included in the sample the time of admission was identified for each selected cases [21,22]. For each case, four controls were selected, which were admitted immediately preceding or following a case. Selected 119 maternal death and 476 controls charts were reviewed. Maternal death charts which were included in the sample but missed charts were replaced by random selection from charts which were not included in the sample. When maternal death charts were replaced the controls were also replaced together with case [23-26].
Data collection instrument was adapted from Maternal Death Surveillance and Response Technical Guideline of Ethiopia [27]. The checklist consists of socio-demographic data, obstetric and delivery history, presence of co morbidities, cause of death, antenatal and intranatal risks and presence of complications. Three midwives were recruited and trained for two days. The training was cover about the contents of the tool, ethical considerations and way of extraction of necessary information from chart. Two public health supervisors were monitored and followed data collection while the principal investigator supervised the overall data collection process.
To assure the quality of data, data collectors were trained until they became well familiar with the instrument. Every day filled checklist was reviewed and checked for completeness and relevance by supervisors and principal investigator.
After data collection, each filled checklist was given a unique code by the principal investigator. Then the data was entered in to epi-info version 3.5.1 after that exported to SPSS version 21 for analysis. Frequencies were used to check for entry errors, missed values and outliers. Any identified error was corrected with the revision of the original data using the code numbers.
Multiple imputations were considered if there is greater or equal to 0.001% of missing values. The maximum number of missing values allowed for multiple imputations was 30%. If there was more than 30% missing values the chart was replaced by random selection from available charts. Missed charts and charts which don’t include the final assessment of admission and status during discharge were replaced by random selection from cases which were not included in sample together with controls.
Bivariate analysis was used to determine the association between different factors and the outcome variable. Variables that have p value less than or equal to 0.05 was entered into multivariate binary logistic regression to identify independent predictors of maternal mortality. Confidence interval of 95% was used to see the precision of the study and the level of significance was taken at p value ≤ 0.05. The adjusted odds ratio with the 95% CI was reported. Graphical presentation such as tables, line graphs and pie charts was used to present the result findings of the study.
Maternal mortality trend was done using the total number of cases occurred in the study period. Trend was shown using MMRatio. The total MMRatio in five year and each year MMR was calculated using the following formula:
Prior to data collection, ethical clearance was obtained from Research and Ethics committee of the College of Health sciences, Mizan-Tepi University. Written permission letter was also received from Mizan-Tepi university teaching & Bonga general hospital CEO. In order to establish anonymous linkage only the codes, not the names of the participant from the chart, was registered on the questionnaire.
Result
A total of 119 cases (dead women) and 476 controls (survived women) were included in the study. Variables such as, ethnicity, educational status, marital status, occupation, and income were incomplete in 99% of charts: As a result, they were excluded from analysis.
Age distribution
Majority, 397 (66.7%) of women in this study were in the age group of 20-34 years. While the least age group was age greater or equal to 35 years old. More than 22% of females died from the age group of 20 – 34 years old (Figure 1).
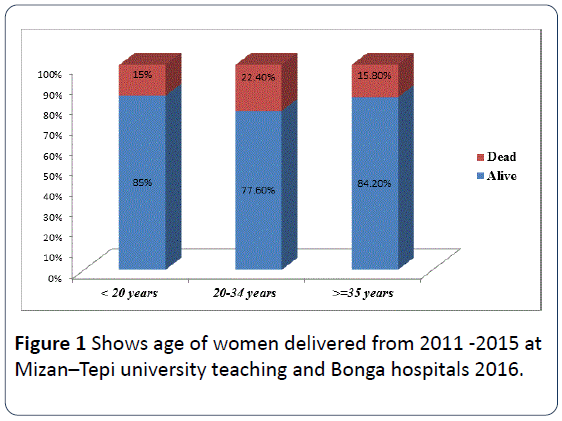
Figure 1: Shows age of women delivered from 2011 -2015 at Mizan–Tepi university teaching and Bonga hospitals 2016.
Obstetric and delivery history
Regarding to obstetric and delivery history around 393 (66.1%) were gravid 1-2 and 480 (80.7%) were in parity 0-2. Majority, 413 (69.4%) were attending ANC. of those 187 (45.2%) were attended 4 times and more. From the total women, 227 (38.2%) were come to the hospitals through referral due to different complication. Two hundred thirty seven (39.8%) of the women were developed labor abnormality. However, 245 (41.8%) of women were delivered by spontaneous vaginal delivery (SVD). More than half, 341 (57.3%) of the births were attended by midwifery. From women who had 3 – 4 gravidity, 3 – 4 parity, and women who don’t have ANC were 26%, 27%, and 63% were died respectively (Table 1).
| Status of the women |
| Variables |
Alive |
Dead |
| Gravidity |
| 1-2 |
321(81.7%) |
72(18.3%) |
| 3-4 |
89(73.6%) |
32(26.4%) |
| >=5 |
66(81.5%) |
15(18.5%) |
| Parity |
| 0-2 |
388(80.8%) |
92(19.2%) |
| 3-4 |
55(72.4%) |
21(27.6%) |
| >= 5 |
33(84.6%) |
6(15.4%) |
| Attending ANC |
| Yes |
360(87.2%) |
53(12.8%) |
| No |
116(63.7%) |
66(36.3%) |
| Number of visit |
| 1 visit |
44(74.6%) |
15(25.4%) |
| 2 visit |
54(85.7%) |
9(14.3%) |
| 3 visit |
90(86.5%) |
14(13.5%) |
| 4 & above visit |
172(92.0%) |
15(8.0%) |
| Place of ANC visits |
| Health post |
42(77.8%) |
12(22.2%) |
| Health center |
139(82.7%) |
29(17.3%) |
| Hospital |
176(93.6%) |
12(6.4%) |
| Private clinic |
3(100%) |
0 |
| Length of labor |
| Less than 24hrs |
382(85.8%) |
63(14.2%) |
| >=24hrs |
94(62.7%) |
56(37.3%) |
| Labor abnormality |
| Yes |
154(65%) |
83(35%) |
| No |
322(89.9%) |
36(10.1%) |
| Birth attendant |
| Doctors |
55(43.0%) |
73(57%) |
| Midwives |
312(91.5%) |
29(8.5%) |
| MSc surgery & obstetrics |
109(86.5%) |
17(13.5%) |
| Is referred? |
| Yes |
162(71.4%) |
65(28.6%) |
| No |
314(85.3%) |
54(14.7%) |
| Mode of delivery |
| SVD |
218(89%) |
27(11%) |
| Vaginal assisted (instrumental, episo..) |
126(89.4%) |
15(10.6%) |
| C/S |
126(64%) |
71(36%) |
| Destructive delivery |
6(50%) |
6(50%) |
Table 1: Shows obstetric and delivery history among women who gave birth from 2011 -2015 in Mizan –Tepi university teaching and Bonga hospitals 2016.
About, 37% and 35% of women were died from women who had length of labour greater than 24 hrs more and who had labor abnormality respectively. From all women who undergo destructive delivery procedures, half of them were died (Table 1). Pertaining to mode of delivery, 197 (33.6%) of women were delivered by C/S. while, 245 (41.8%) were delivered by spontaneous vaginal delivery (SVD) (Figure 2).
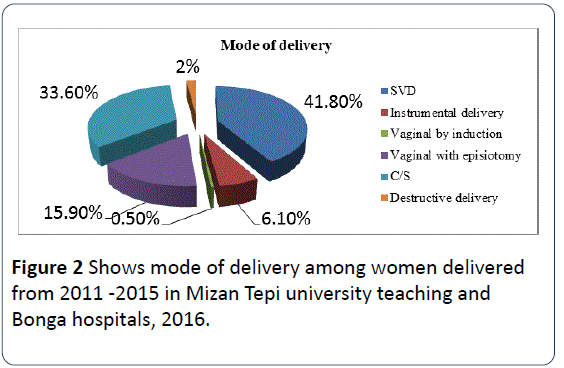
Figure 2: Shows mode of delivery among women delivered from 2011 -2015 in Mizan Tepi university teaching and Bonga hospitals, 2016.
Obstetric complications
Thirty two (94.6%) of women had co morbidity, of those anemia and HIV/AIDs accounts 15 (46.9%) each. Whereas, 25 (4.2%) were developed abnormal puerperium. Of which, PPH was the most common that accounts 17 (68%) (Table 2).
| Variables |
Status of the women |
| Presence of co morbidities |
Alive |
Dead |
| Yes |
21(65.6%) |
11(34.4%) |
| No |
455(80.8%) |
108(19.2%) |
| Types of co morbidity |
| Anemia |
7(46.7%) |
8(53.3%) |
| HIV/AIDs |
12(80%) |
3(20%) |
| Malaria |
0 |
3(100%) |
| Other morbidities |
3(50%) |
3(50%) |
| Abnormal puerperium |
| Yes |
5(20%) |
20(80%) |
| No |
471(82.6%) |
99(17.4%) |
| Types of abnormalities* |
| PPH |
2(11.8%) |
15(88.2%) |
| Puerperal sepsis |
3(100%) |
0 |
| Wound infection |
2(20%) |
8(80%) |
| Presence of antenatal risks |
| No |
435(82.5%) |
92(17.5%) |
| Yes |
41(60.3%) |
27(39.7%) |
| Types of antenatal risks* |
| Placenta previa |
9(33.3%) |
18(66.7%) |
| Previous C/S |
6(50%) |
6(50%) |
| Multiple gestation |
18(85.7%) |
3(14.3%) |
| Abruption placenta |
4(40%) |
6(60%) |
| Others |
6(100%) |
0 |
| *more than one response |
Table 2: Obstetric complications, co morbidity, abnormal puerperium and maternal death in among women delivered from 2011-2015 at Mizan –Aman and Bonga hospitals, 2016.
Taking into account, risk during antenatal period 68 (11.4%) of the women’s were presented with different antenatal risks (placenta previa, multiple gestation, & abruption placenta). Of those, more than half of them were died. From total women who had abnormal puerperium only 20% of them were survived (Table 2).
Trends of maternal death
The maternal mortality was higher in 2013 and lower in 2015. The number of live birth more or less has an increasing pattern which was having highest number of live births in 2015 and lowest number of live birth in 2011. The maternal mortality was higher in MTU teaching hospital 1002/105 than Bonga hospitals (Figure 3).
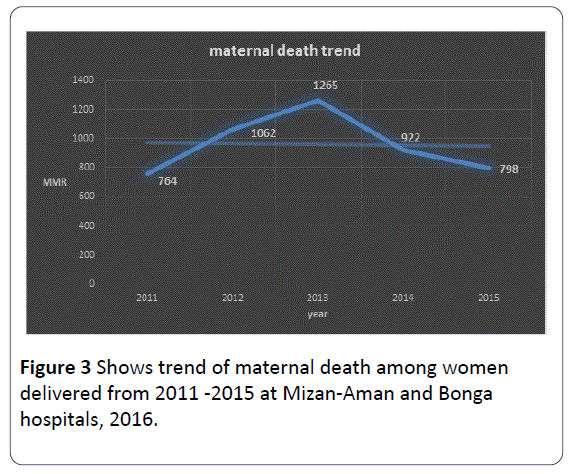
Figure 3: Shows trend of maternal death among women delivered from 2011 -2015 at Mizan-Aman and Bonga hospitals, 2016.
Factors associated with maternal mortality
The result of binary logistic regression analysis in relation to maternal mortality, attending ANC, length of labor, labor abnormality, presence of obstetric complications, hemorrhage, uterine rupture, abortion, presence of co-morbidity, anemia, abnormal puerperium, antenatal risks, birth attendant, and mode of delivery had significant association. But the result of multiple logistic regression analysis showed that attending ANC, length of labor, Presence of obstetric complications, uterine rupture, abortion, abnormal puerperium, antenatal risks, and mode of delivery were found to be significantly associated with maternal mortality as clearly described on table (Table 3).
| Variable |
Maternal status |
COR,95%CI |
AOR,95% CI |
| Live |
dead |
| Attending ANC |
| No |
116 |
66 |
3.9(2.55, 5.87)* |
2.4(1.19, 4.83)* |
| Yes |
360 |
53 |
1 |
1 |
| Length of labor |
| Less than 24hrs |
382 |
63 |
1 |
1 |
| >= 24hrs |
94 |
56 |
3.6(2.36, 5.52)* |
4.0(1.86,8.74)* |
| Labor abnormality |
| No |
322 |
36 |
1 |
1 |
| Yes |
154 |
83 |
4.8(3.18, 7.45)* |
0.6(0.23,1.33) |
| Presence of obstetric complications |
| No |
397 |
21 |
1 |
1 |
| Yes |
79 |
98 |
23.4(13.81, 39.83)* |
7.2(3.08,16.72)* |
| Hemorrhage |
| No |
471 |
95 |
1 |
1 |
| Yes |
5 |
24 |
23.8(8.86,63.94)* |
3.3(0.76,14.62) |
| Uterine rupture |
| No |
465 |
66 |
1 |
1 |
| Yes |
11 |
53 |
33.9(16.87, 68.27)* |
11.4(4.27,30.41)* |
| Abortion |
| No |
473 |
107 |
1 |
1 |
| Yes |
3 |
12 |
17.7(4.90, 63.75)* |
33.5(4.98,224.98)* |
| Presence of co-morbidity |
| No |
455 |
108 |
1 |
1 |
| Yes |
21 |
11 |
2.21 (1.03, 4.71)* |
0.12(0.01,1.08) |
| Anemia |
| No |
469 |
111 |
1 |
1 |
| Yes |
7 |
8 |
4.8(1.72, 13.59)* |
2.9(0.23,35.59) |
| Abnormal puerperium |
| No |
471 |
99 |
1 |
1 |
| Yes |
5 |
20 |
19.0(6.98, 51.92)* |
10.9(1.96,59.97)* |
| Antenatal risks |
| No |
435 |
92 |
1 |
1 |
| Yes |
41 |
27 |
3.1(1.82,5.32)* |
3.8(1.64,8.61)* |
| Birth attendant |
| Doctors |
55 |
73 |
14.3(8.52, 23.95)* |
1.1(0.29,4.26) |
| MSc in surgery & obs. |
109 |
17 |
1.7(0.89, 3.17) |
0.23(0.05,1.09) |
| Midwives |
312 |
29 |
1 |
1 |
| Mode of delivery |
| SVD |
218 |
27 |
1 |
1 |
| Vaginal assisted delivery (induc,epi) |
126 |
15 |
0.96(0.49, 1.87) |
0.57(0.19,1.69) |
| C/S |
126 |
71 |
4.6(2.78, 7.46)* |
1.5(0.37,6.24) |
| Destructive delivery |
6 |
6 |
8.1(2.43, 26.81)* |
10.9(2.13,56.2)* |
| N.B: * Shows variable that are significantly associated |
Table 3: Bivariate and multivariate logistic regression analysis of factors associated with maternal mortality in Mizan- Tepi university teaching and Bonga hospitals town (n=595), May 2016.
There is strong association between attending ANC and maternal mortality. That is women who were not attending ANC were 2.4 times more at risk for death than those who attend (AOR=2.4, 95% CI 1.19-4.83). And those who develop prolonged labor or whose labor greater than 24hrs were 4 times more at risk for death than labor less than 24 hrs (AOR=4, 95% CI. 1.86-8.74).
Similarly presences of obstetric complications were significantly associated with maternal mortality. Women who develop different obstetric complications were 7.2 times more at risk for death compared to counterparts (AOR=7.2, 95% CI 3.08, 16.72). In addition, uterine rupture was other determinant for maternal mortality. Women who develop uterine rupture were 11.4 times more at risk when compared to their counter parts (AOR=11.4 95% CI 4.27, 30.41).
There is also statistically significant association between abnormal puerperium and maternal mortality. That is those who had abnormal puerperium were 10.9 times more at risk for death than those who had not developed (AOR=10.9, 95% CI 1.96,59.97). Again, those who had antenatal risks ( placenta previa, Abruption placenta, Previous C/S & Multiple gestation) were 3.8 times more likely to die than their complements (AOR= 3.8, 95% CI 1.64, 8.61).
Strong association was also found between mode of delivery and maternal mortality. That is women who delivered with destructive delivery were 10.9 times more at risk for death than who delivered spontaneous vaginal delivery (SVD) (AOR=10.9, 95% CI 2.13, 56.2) (Table 3).
Discussion
Maternal death in our country has a decreasing trend as depicted by different reports and reviews. As, 2013 combined reports of WHOM, UNICEF, the World Bank and UNFPD, Ethiopia shows a decreasing pattern of maternal death. However, the general MMR in these hospitals was 960/105. It has a fluctuation pattern from 764 to 1265/105. It was highest in 2013 with 1265/105 and lowest in 2015 with 764/105 than other study periods in the study period. But, Review of different community and hospital based studies by Ahmed Abdela shows a decreasing pattern of maternal death. Review made in jimma hospital before 15 years back and in Ambo hospital before 5 years back shows fluctuation of MMR from 671-3986 per 105 but it was higher in general than the current of our finding. Review of maternal death from 2002–2006 in JUSH also shows a decreasing pattern with total MMR of 888/105 [7,18,28–30]. Decrease in occurrences of death from previous years in these hospitals particularly after 2010 might be because of increasing awareness of community about institutional delivery, organizational and policy factors. Organizational factors might be service expansion and human power expansion, increasing availability and accessibility of health institution. The other factor might be after 2010 in our country there was country wide mobilization to decrease death of mother with slogan of “no mother should die while she gave birth.” In the other extreme it might be because of under reporting of death due to fear of bad criticism and captivity of health professionals and health facility. These things might be the reason.
Factors affecting maternal death
The study revealed that maternal death was significantly different among women who did not attending ANC and those who attend ANC. Women who did not attend ANC were 2.4 times more at risk for death than those who attend (AOR = 2.4, 95%CI 1.19 -4.83). This finding was in line with study done in china and Kenya , those who have not attended ANC were more likely at risk of death (AOR, 22.3; 95% CI, 4.3-116.0) and AOR 4.1, 95% CI 1.6-10.4) respectively. Attending ANC as a protective factor from death is observed in public hospital of Tigray [AOR= 0.26, 95% CI (0.12-0.57)]. Similarly study done in Ambo shows that maternal death were higher among women who did not attend ANC (11% had ANC Vs 38% had no ANC) [14,18,20,25]. In ante natal care there are many things performed like provisions of iron, folate and other health promotive and preventive activities. In addition ANC attendance makes the women to prepare for birth and for complication readiness. These activities prevent death of mothers. That is why not attending ANC is a risk factor or attending ANC become a protective factor.
In this study, the likelihood of maternal death increases as length of labor increase. Those whose labor length greater than 24hrs were 4 times more at risk of death than women who had labor length less than 24 hrs (AOR= 4, 95% CI. 1.86-8.74). This finding is consistent with study conducted in public hospital of Tigray, which reveals that Women who had labor length less than 24 hours was protected from maternal death than women who had labor length more than 24 hours [AOR=0.27, 95% CI (0.07-0.89)]. Research finding from Nigeria maternity hospital AOR - 2.86 and 95% CI (1.39, 5.9) shows prolonged labour was the major risk factor for maternal death [14,21]. Most (70%) of women who had obstructed labour (OL) had prolonged labour. The other reason might be unnecessary delay from patient side or HI which is evidenced by 40% of referred women has prolonged labour. This in turn results uterine rupture. Presences of obstetric complications were also significantly associated with maternal mortality. Women who develop different obstetric complications were 7.2 times more at risk for death than their counterparts (AOR =7.2, 95% CI 3.08, 16.72). The obstetric complications like malpresentation, post term pregnancy, and PROM are some of the complications included in this category. These complications increase the risk of dying in different ways. Malpresentation prolongs labour in intrapartum period. Prolonged labour will in turn expose the women for infections and hemorrhage. It might be explained by fatigued uterus. That is if pregnancy is post term, most of the time labour is initiated by induction which results in fatigue uterus which exposes the women for post partum hemorrhage.
In addition uterine rupture was other determinant for maternal mortality. Women who develop uterine rupture were 11.4 times more at risk to die than their counter parts (AOR= 11.4 95% CI 4.27, 30.41). In Senegal women who had uterine rupture were 28 times more likely to die than their counter parts AOR=28.07 95% CI (11.34 69.51) [31,32]. The reason might be uterine rupture is the major source of concealed and revealed hemorrhage that finally leads to death.
Those who had ante or intranatal risks (placenta previa, Abruption placenta, Previous C/S & Multiple gestation) were 3.8 times more likely to die when compared to their counterparts (AOR= 3.8, 95% CI 1.64,8.61). These risks are the sources of uterine rupture and hemorrhage which are the most prominent cause of death.
Conclusion and Recommendation
The number of maternal death has a fluctuation pattern over the year. Women who do not have ANC follow up; presence of obstetric complications, women who had ante or intra natal risks and women who had prolonged labour are more at risk for maternal death. Based on the findings from this study the following recommendations are made. Health professionals including HEWs should have to work in strengthen approach to improve awareness of the community about pregnancy, its complication and co morbidities, and ANC uptake. Academicians and researchers should dig out alternative solution for maternal death.
Competing interests
We declare that we do not have any conflict of interests. This study was funded by Mizan-Tepi University.
Authors' contributions
Tegene Legese, Kebadnew M and Tensay K conceived the study, involved in the study design, data analysis, drafting the manuscript and critically reviewing the manuscript. All authors read and approved the final manuscript.
Authors' information
All authors are academicians. TL has MPH in reproductive health, KM has MPH in Epidemiology and Biostatics and TK has MSc in Reproductive and Maternal health Nursing.
Acknowledgements
We are grateful to Mizan-Tepi University for funding the study and other supports. We would like to acknowledge MTU teaching and Bonga hospitals for their cooperation in conducting this study. We would also like to express our deepest gratitude to data collectors for their hard work and sincere contribution.
17355
References
- WHO (2010) International statistical classification of diseases and related health problems instruction manual. (10th revision), Geneva, Switzerland.
- Baden S (1996) Challenges to women’s reproductive health: maternal mortality. 44: 38.
- World bank (2004)The millennium development goals for health to rising the challenges.
- Ronsmans C, Campbell O (2011) Quantifying the fall in mortality associated with interventions related to hypertensive diseases of pregnancy. BMC Public Health 11:S8.
- Kassebaum NJ, Bertozzi-villa A, Coggeshall MS, Shackelford KA, Steiner C, et al. (2014) Global, regional, and national levels and causes of maternal mortality during 1990–2013: A systematic analysis for the global burden of disease study 2013. 6736:1–25.
- WHO (2013)World bank, UNFPA U and U. Trends in maternal mortalityÃÂÃÂÃÂâÂÂÃÂâÂÂÃÂâÃÂÃÂââ¬Ã
¡ÃÂâââ¬Ã
¡ÃÂìÃÂÃÂââ¬Ã
¡ÃÂâÂÂÃÂï: 1990 to 2013.
- Nieburg P (2012) Improving Maternal Mortality and Other Aspects of Women’s Health.
- Ye F, Wang H, Huntington D, Zhou H, Li Y, et al. (2012) The immediate economic impact of maternal deaths on rural chinese households.7: 6.
- Reed HE, Koblinsky MA, Mosley WH (2000) The consequences of maternal morbidity and maternal mortality.
- Bryce J, Victora C, Berman P, Lawn J, Mason E, et al. (2014) Fulfilling the health agenda for women and children the 2014 report ER.
- BS Garg,SMZ (2006)Safe motherhoodÃÂÃÂÃÂâÂÂÃÂâÂÂÃÂâÃÂÃÂââ¬Ã
¡ÃÂâââ¬Ã
¡ÃÂìÃÂÃÂââ¬Ã
¡ÃÂâÂÂÃÂï: social , economic , and medical determinants of maternal mortality women.
- Koblinsky M, Tain F, Tesfaye S (2010) Reducing maternal mortality and increasing use of skilled birth attendance: Ethiopia and MDG 5.4: 1.
- Gidey G (2013) Patterns of maternal mortality and associated factors; a case-control study at public hospitals in tigray region, Ethiopia. Int J Pharm Sci Res 4:1918–1929.
- Central Statistical Agency [Ethiopia] and ICF International(2011) Ethiopia Demographic and Health Survey 2011.
- Central Statistical Agency [Ethiopia] and ORC Macro (2005) Ethiopia Demographic and Health Survey Preliminary Report.
- WHO (2004) Reviewing maternal deaths and complications to make pregnancy safer Beyond the Numbers.
- Garomssa H, ADD (2008) Maternal mortality in Ambo Hospital: a five year retrospective review. Ethiop J Reprod Heal. 2:2–13.
- You F, Huo K, Wang R, Xu D, Deng J, et al. (2012) Maternal Mortality in Henan Province , ChinaÃÂÃÂÃÂâÂÂÃÂâÂÂÃÂâÃÂÃÂââ¬Ã
¡ÃÂâââ¬Ã
¡ÃÂìÃÂÃÂââ¬Ã
¡ÃÂâÂÂÃÂï: Changes between 1996 and 2009. PLoS ONE 7:1–7.
- Devi, Devi KP, ManglemCSSR (2012) Maternal Mortality and Its Causes in a Tertiary Center. J ObstetGynecol India. 62:168–171.
- Olopade FE,Lawoyin T (2008) Maternal Mortality in a Nigerian Maternity Hospital. African J Biomed Res11:267–273.
- Yaya Y, Eide KT, Norheim OF, Lindtjørn B (2014) Maternal and Neonatal Mortality in South-West EthiopiaÃÂÃÂÃÂâÂÂÃÂâÂÂÃÂâÃÂÃÂââ¬Ã
¡ÃÂâââ¬Ã
¡ÃÂìÃÂÃÂââ¬Ã
¡ÃÂâÂÂÃÂï: Estimates and Socio-Economic Inequality. PLoS ONE 9: e06294.
- Evjen-olsen B, Hinderaker SG, Lie RT, Bergsjø P, Gasheka P, et al. (2008) Risk factors for maternal death in the highlands of rural northern TanzaniaÃÂÃÂÃÂâÂÂÃÂâÂÂÃÂâÃÂÃÂââ¬Ã
¡ÃÂâââ¬Ã
¡ÃÂìÃÂÃÂââ¬Ã
¡ÃÂâÂÂÃÂï: a case-control study. BMC Public Heal.
- Zhang J, Zhang X, Qiu L, Zhang R, Hipgrave DB, et al. (2014) Maternal deaths among rural – urban migrants in ChinaÃÂÃÂÃÂâÂÂÃÂâÂÂÃÂâÃÂÃÂââ¬Ã
¡ÃÂâââ¬Ã
¡ÃÂìÃÂÃÂââ¬Ã
¡ÃÂâÂÂÃÂï: a case – control study. 14:1–7.
- Yego F, Este CD, Byles J, Williams JS, Nyongesa P (2014) Risk factors for maternal mortality in a Tertiary Hospital in KenyaÃÂÃÂÃÂâÂÂÃÂâÂÂÃÂâÃÂÃÂââ¬Ã
¡ÃÂâââ¬Ã
¡ÃÂìÃÂÃÂââ¬Ã
¡ÃÂâÂÂÃÂï: a case control study. BMC Pregnancy Childbirth. 14: 38.
- Bank TW, Nations U, Division P, Mortality M, Group EI (2013) Maternal mortality in 1990-2013 WHO, UNICEF, UNFPA, The World Bank, and United Nations population division maternal mortality estimation inter-agency group.
- Federal democratic republic of ethiopia ministry of health (2012) Maternal death surveillance and response (MDSR) Technical Guideline.
- Abdella A (2010) Maternal mortality trend in Ethiopia. Ethiop J Heal dev. 24: 115 - 122.
- Berhan Y, Berhan A (2014)Review of maternal mortality in EthiopiaÃÂÃÂÃÂâÂÂÃÂâÂÂÃÂâÃÂÃÂââ¬Ã
¡ÃÂâââ¬Ã
¡ÃÂìÃÂÃÂââ¬Ã
¡ÃÂâÂÂÃÂï: A story of the past 30 years. Ethiop J Heal Sci. 2014: 3–14.
- Negussie D, Mesfin N (2009) Review of maternal death in jimmauniveristy specialized hospital. Ethiop J Heal Sci 19:9–12.
- Asamoah BO, MoussaKMMS, GM (2011) Distribution of causes of maternal mortality among different socioeconomic status. BMC Public Health 11: 159.
- Garenne M, Mbaye K, Bah MD, Correa P (1997) Risk factors for maternal mortality control study in dakarÃÂÃÂÃÂâÂÂÃÂâÂÂÃÂâÃÂÃÂââ¬Ã
¡ÃÂâââ¬Ã
¡ÃÂìÃÂÃÂââ¬Ã
¡ÃÂâÂÂÃÂï: A case- hospitals (Senegal). Afr J Reprod Heal 1: 14–24.

