Keywords
Demographic; Socio-economic; Determinants; Under-five mortality; Somali region
Abbreviations
CI: Confidence Interval; CSA: Central Statistical Agency; EDHS: Ethiopian Demographic Health Survey; DF: Degree of Freedom; HR: Hazard Ratio; SAS: Statistical Analysis Software; SDGs: Sustainable Development Goal; SPSS: Statistical Package for Social Science; U5D: Under-Five Death; U5M: Under-Five Mortality
Introduction
Back Infant and child mortality rates are important indicators of societal and national development as they serve as key markers of health equity and access [1,2]. Child mortality rates also reflect a country’s level of socio-economic development and quality of life and are used for monitoring and evaluating population, health programs and policies. In the past few decades there is decline in under-five mortality in almost all countries of the world, regardless of initial levels, scio-economic circumstances and development strategies. In spite of this substantial drop in global child mortality rate, about 5.9 million children still die every year before their fifth birthday worldwide which implies 16000 under-five children die each day [3].
Identifying determinants of under-five mortality (U5M) is important for formulating appropriate health programmes and policies in order to meet the United Nations the sustainable development goal (SDGs) (i.e., aiming to reduce under-five mortality to at least as low as 25 per 1000 live births by 2030). Several studies have been conducted to identify the determinants of U5M. Studies have identified strong associations between maternal factors and childhood mortality. Birth interval has been identified by numerous studies as a major determinant of childhood mortality [4,5]. Studies have also shown that children of educated mothers will survive better than children of non-educated mothers [6-8].
There are huge differences in child mortality among low and middle income countries and the industrial world with Sub- Saharan Africa and South East Asia carrying the highest burden of under-five mortality [9,10]. The highest rates of child mortality are still in Sub-Saharan Africa-where 1 in 8 children dies before age 5, more than 17 times the average for developed regions (1 in 143)-and Southern Asia (1 in 15) [11]. Ethiopia being one these country under five mortality still remain high, 88/1000 live birth, [12]. In Ethiopia, mainly in the Somali region under-five mortality were well above the national average [12-14] also there are limited studies that focused on the association between determinant factors and under-five mortality.
Objectives
General objective
To identify and analyze socioeconomic, demographic and environmental factors that may have a significant influence on under-five mortality in Ethiopian Somali regional state.
Specific objectives
To estimate the survival time of under-five children.
To show the pattern of under-five mortality in the region.
To identify factors tend to be the most influential in explaining the observed high under-five mortality.
Materials and Methods
Study area
This regional level research was conducted in Ethiopian Somali regional state. Ethiopian Somali Regional State is the second largest region in the country next to Oromia and covers a total area of 350,000 km square. It is located in the east and southeast of the country and lies between 4 and 11 degrees north latitude and 40 and 48 degrees east longitude. The Region has 11 administrative zones consisting of 93 woredas (districts). The zones are Dhaawe, Erer, Fafan, Siti, Liban, Afder, Shabelle, Korahe, Dolo, Jarar and Nogob. It shares borders with Somalia to the east and southeast, Kenya to the south and Djibouti to the north. To the northwest and west, it borders with Afar and Oromia Regions, respectively [15]. According to central statistics agency the population was projected at 5.7 million in 2017. Of the total, 46% and 54% are females and males respectively [16].
Source of data
Data obtained from complete registration of births and deaths often provide the best basis for the direct estimation of child mortality. Unfortunately, most African countries lack functioning vital registration systems for health and other data. Estimates of childhood mortality in these countries are, therefore, largely based on cross-sectional surveys that collect complete birth histories from respondents. This study was based on a database that has been compiled as part of the 2000, 2005, and 2011 EDHS. The data set consists of a national representative sample of household level data.
Study design
The study design was a retrospective study design.
Variables in the Study
The response (dependent) variable
Under-five child mortality is defined as mortality from the age of 1 month to the age of 59 months. Therefore, the dependent variable in this study is “the risk of death occurring in an age interval in the 1–59 month period”. The outcome variable was thus survival time in months of the children under the age of five.
Explanatory (covariates) variables
Based on [16] the following covariates: Child’s sex (SEX) (1=Male, 2=Female); Type of birth (BTYPE) (0=Single birth, 1=Multiple birth); Mother’s age at first birth (MAGEB) (0 ≤ 16 years, 1 ≥ 16 years); Family size (FSIZE) (0=1-3 members, 1=4-6 members, 2 ≥ 7members); Breastfeeding status (BFDINGS) (0=No, 1=Yes); Preceding birth interval (PBITVAL) (0 ≤ 2 years, 1=2 -3 years, 2 ≥ 3 years); Birth order (BORD) (1st order, 2-4 order, >4 order); Mother’s education (MEDU) (0=No education, 1=Primary and above); Father’s education (FEDU) (0=No education, 1=Primary and above); Area of residence (ARISD) (1=Urban, 2=Rural); Literacy of a women (LTRCY) (0=able to read, 1=can’t read at all); Marital status (MSTAT) (0=Married, 1=Not married); Source of drink water (SDWTR) (0=Pipe, 1=others); and Toilet facility (TOLF) (0=No, 1=Yes) were considered in this study.
Method of Data Analysis
The data analysis is done using SPSS 20, STATA and SAS statistical (software) packages. In this study survival analysis is conducted to find out the determinants of under-five mortality in Ethiopian Somali region state, eastern Ethiopia.
Results
Descriptive analysis of the survival data
After removal of observations with missing values, a total number of live births considered for this study were 515, 563 and 729 with 98 (19.03%), 103 (18.29 percent), and 104 (14.27%) of under-five deaths occurred during the preceding five years of the study periods (1996-2000, 2001 -2005, 2006-2011), respectively. Of the total live birth, 54 (22.2%), 44 (16.2%), 55 (18.5%), 48 (18.0%), 63 (15.9%), and 41 (12.3%) of under-five death have occurred for male and female, respectively. Regarding mothers’ age at birth, 246 (47.77%), 164 (29.13%), 200 (27.43%), of children were from mothers of age less than 16 years while the remaining 269 (52.23%), 399 (70.87%), 529 (72.57%) were from mothers with age 17 years and above. When we come to education of mothers, the under-five mortality was 91 (18.5%), 101 (19.3%), 88 (14.0%) and 7 (30.4), 2 (5.0%), 16 (15.8%) for children whose mothers have no education and primary and above education, respectively. Of the total of 515, 563 and 729 children included 444 (86.21%), 477 (84.72%) and 554 (75.99%) were born in rural part of Ethiopian Somali region and 154 (29.90%), 188 (33.39%) and 449 (61.59%) were breastfed. Among the mothers of under-five children, 501 (97.28%), 553 (98.22%) and 695 (95.34%) were married. There were 48, 16, and 28 households of size 1-3 members, 244, 283, and 288 had household size 4-6 and 223, 264 and 413 of households had more than 6 members. In addition, 55 (10.68%), 26 (4.62%), and 130 (17.83%) households had piped water while 460 (89.32%), 537 (95.38%), and 599 (83.17%) used water from unprotected source of water. Finally, children with preceding birth interval shorter than 2 years are subject to higher risk of under-five mortality (19.9, 28.2 and 13.5%) during the preceding five years of the study periods (1996-2000, 2001-2005, 2006-2011), respectively (Table 1).
Table 1 Trends in proportion of under-five survival/deaths and associated factors in preceding five years of 2000, 2005, and 2011.
| |
|
For the previous five years period before 2000 |
For the previous five years period before 2005 |
For the previous five years period before 2011 |
| Covariates |
Categories |
Censored |
U5D |
Total |
Censored |
U5D |
Total |
Censored |
U5D |
Total |
| |
| Child’s sex |
1(Male) |
189 |
54 |
243 |
242 |
55 |
297 |
333 |
63 |
396 |
| 2(Female) |
228 |
44 |
272 |
218 |
48 |
266 |
292 |
41 |
333 |
| Mother’s age at 1st birth |
0(≤ 16) |
191 |
55 |
246 |
130 |
34 |
164 |
173 |
27 |
200 |
| 1(>16) |
226 |
43 |
269 |
330 |
69 |
399 |
452 |
77 |
529 |
| Breastfeeding status |
0(No) |
294 |
67 |
361 |
288 |
87 |
375 |
239 |
41 |
280 |
| 1(Yes) |
123 |
31 |
154 |
172 |
16 |
188 |
386 |
63 |
449 |
| Birth order |
0(1storder) |
48 |
13 |
61 |
110 |
28 |
138 |
103 |
17 |
120 |
| 1(2-4 order) |
66 |
12 |
78 |
164 |
46 |
210 |
194 |
33 |
227 |
| 2(> 4order) |
303 |
73 |
376 |
186 |
29 |
215 |
328 |
54 |
382 |
| Family Size |
0(1-3size) |
31 |
17 |
48 |
6 |
10 |
16 |
25 |
3 |
28 |
| 1(4-6size) |
200 |
44 |
244 |
218 |
65 |
283 |
247 |
41 |
288 |
| 2(≥7size) |
186 |
37 |
223 |
236 |
28 |
264 |
353 |
60 |
413 |
| Preceding birth interval |
0(≥2 years) |
161 |
40 |
201 |
204 |
80 |
284 |
269 |
42 |
311 |
| 1(2-3 years) |
100 |
55 |
308 |
154 |
18 |
172 |
197 |
28 |
225 |
| 2 (≥ 3 years) |
153 |
6 |
|
102 |
5 |
105 |
159 |
34 |
193 |
| Type of birth |
0(Single birth) |
411 |
94 |
505 |
456 |
95 |
551 |
614 |
100 |
714 |
| 1(Multiple birth) |
6 |
4 |
10 |
4 |
8 |
12 |
11 |
4 |
15 |
| Mother education |
0(No Education) |
401 |
91 |
492 |
422 |
101 |
523 |
540 |
88 |
628 |
| 1(Primary and above) |
16 |
7 |
23 |
38 |
2 |
40 |
85 |
16 |
101 |
| Father Education |
0(No Education) |
366 |
86 |
452 |
416 |
91 |
507 |
416 |
72 |
488 |
| 1(Primary and above) |
51 |
12 |
63 |
44 |
12 |
56 |
209 |
32 |
241 |
| Mother’s working status |
0(No) |
297 |
69 |
366 |
356 |
83 |
439 |
531 |
92 |
623 |
| 1(Yes) |
120 |
29 |
149 |
104 |
20 |
124 |
94 |
12 |
106 |
| Marital status |
0(Married) |
405 |
96 |
501 |
454 |
99 |
553 |
593 |
102 |
695 |
| 1(Others) |
12 |
2 |
14 |
6 |
4 |
10 |
32 |
2 |
34 |
| Literacy |
0(Can't read at all) |
396 |
90 |
486 |
444 |
103 |
547 |
543 |
96 |
630 |
| 1(Able to read at all) |
21 |
8 |
29 |
16 |
0 |
16 |
91 |
8 |
99 |
| Area of residence |
1(Urban) |
58 |
13 |
71 |
68 |
18 |
86 |
145 |
30 |
175 |
| 2(Rural) |
359 |
85 |
444 |
392 |
85 |
477 |
480 |
74 |
554 |
| Source of drinking water |
0(Pipe) |
41 |
14 |
55 |
22 |
4 |
26 |
112 |
18 |
130 |
| 1(Others) |
376 |
84 |
460 |
438 |
99 |
537 |
513 |
86 |
599 |
*U5D: Under-Five Death
The probability of survival of a child is 65%, 54%, and 79% with a standard error of 0.045, 0.37, and 0.038 during the preceding five years of the study periods (1996-2000, 2001 -2005, 2006-2011), respectively for the follow-up period of time. In addition, the result of the over all of Kaplan Meier estimation indicate that most child death occurs at the earlier months and then gradually declined to as the age of child advanced to 60 month (Figure 1).
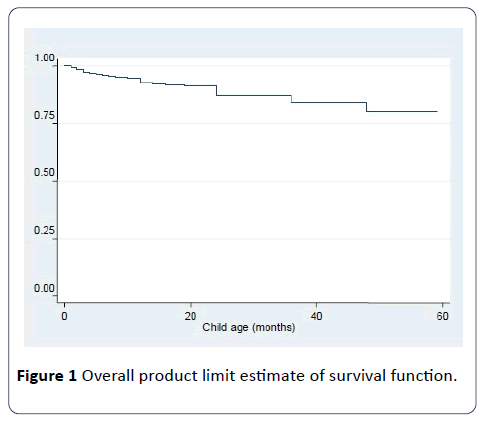
Figure 1: Overall product limit estimate of survival function.
The log-rank test was performed to see if there is a significant difference among survival experience of two or more groups of the covariates (Table 2).
Table 2 Result of log-rank test of equality of survival distribution for the different categorical covariates.
| |
For the previous five years period before 2000 |
For the previous five years period before 2005 |
For the previous five years period before 2011 |
| Covariates |
Chi-square |
Df |
p-value |
Chi-square |
Df |
p-value |
Chi-square |
Df |
p-value |
| Preceding birth interval |
48.384 |
2 |
0.000 |
32.522 |
2 |
0.000 |
6.958 |
2 |
0.031 |
| Family size |
24.982 |
2 |
0.000 |
46.233 |
2 |
0.000 |
9.444 |
2 |
0.000 |
| Type of birth |
11.388 |
1 |
0.000 |
79.87 |
1 |
0.000 |
8.853 |
1 |
0.003 |
| Breastfeeding status |
10.076 |
1 |
0.000 |
34.648 |
1 |
0.000 |
9.266 |
1 |
0.000 |
| Source of drinking water |
14.993 |
1 |
0.000 |
24.427 |
1 |
0.000 |
8.049 |
1 |
0.004 |
| Mother education |
0.196 |
1 |
0.567 |
5.127 |
1 |
0.024 |
2.116 |
1 |
0.146 |
| Literacy of mother |
21.921 |
1 |
0.000 |
4.466 |
1 |
0.026 |
0.641 |
1 |
0.423 |
| Area of residence |
9.098 |
1 |
0.001 |
8.844 |
1 |
0.003 |
4.568 |
1 |
0.033 |
| Father education. |
0.197 |
1 |
0.557 |
2.217 |
1 |
0.137 |
1.021 |
1 |
0.312 |
| Mother's age at first birth |
9.123 |
1 |
0.005 |
0.000 |
1 |
0.000 |
11.018 |
1 |
0.000 |
| Marital status |
11.236 |
1 |
0.000 |
12.832 |
1 |
0.000 |
7.220 |
1 |
0.009 |
| Birth order |
12.986 |
2 |
0.000 |
12.767 |
2 |
0.000 |
12.946 |
2 |
0.000 |
| Sex of child |
5.586 |
1 |
0.085 |
0.033 |
1 |
0.855 |
0.029 |
1 |
0.865 |
| Toilet facility |
3.536 |
1 |
0.232 |
3.721 |
1 |
0.054 |
2.256 |
1 |
0.133 |
| Mother working status |
3.974 |
1 |
0.143 |
0.233 |
1 |
0.629 |
0.503 |
1 |
0.478 |
According to the above Table 2 the variables were found to be statistically significant difference in experiencing death event were: preceding birth interval, family size, type of birth, breastfeeding status, source of drinking water, literacy of mother, area of residence, mother's age at first birth, marital status and birth order during the preceding five years of the study periods (1996-2000, 2001-2005, 2006-2011), respectively.
Bivariate and multivariate analyses
We start with fitting univariable Cox proportional hazards regression model. The following Table 3 summarizes result obtained from SAS and SPSS output of univariable Analysis.
Table 3 Results of the univariable proportional hazards Cox regression model.
| |
For the previous five years period before 2000 |
For the previous five years period before 2005 |
For the previous five years period before 2011 |
| Covariates |
Sig. |
Exp(Β) |
Sig. |
Exp(Β) |
Sig. |
Exp(Β) |
| BORD (1st order) |
0 |
|
0 |
|
0 .000 |
|
| 2-4 order |
0.007 |
1.575 |
0 |
1.053 |
0.043 |
1.477 |
| > 4 order |
0.001 |
1.934 |
0 |
1.973 |
0.021 |
2.004 |
| PBITVAL (≤ 2 years) |
0 |
|
0 |
|
0 |
|
| 2-3 years |
0 |
0.812 |
0 |
0.704 |
0 |
1.17 |
| ≥ 3 years |
0 |
0.517 |
0 |
0.504 |
0 |
0.96 |
| FSIZE (1-3) |
0 |
|
0 |
|
0 |
|
| 04-Jun |
0.01 |
1.449 |
0 |
0.496 |
0.005 |
1.905 |
| ≥ 7 |
0.04 |
2.226 |
0.008 |
1.4 |
0.034 |
2.056 |
| BTYPE (single birth) |
0 |
4.751 |
0 |
4.364 |
0.007 |
4.043 |
| MAGEB (>16 yrs) |
0.005 |
1.368 |
0 |
1.2 |
0.002 |
1.028 |
| BFDINGS (yes) |
0 |
1.037 |
0.033 |
1.8 |
0.001 |
1.906 |
| SDWTR (pipe) |
0.001 |
1.805 |
0 |
1.723 |
0.04 |
1.054 |
| MSTAT (married) |
0 |
2.574 |
0.002 |
5.204 |
0.008 |
1.72 |
| ARSID (urban) |
0.001 |
1.328 |
0.004 |
2.152 |
0.052 |
1.526 |
| TOLF (has a facility) |
0.232 |
1.013 |
0.062 |
0.946 |
0.177 |
1.765 |
| LITRACY (Able to read) |
0 |
1.433 |
0.029 |
1.048 |
0.455 |
1.758 |
| SEX (male) |
0.085 |
0.704 |
0.865 |
0.967 |
0.876 |
1.032 |
| MWORK (yes) |
0.143 |
1.719 |
0.639 |
1.128 |
0.513 |
0.817 |
| MEDU(primary and above) |
0.567 |
0.398 |
0.047 |
1.238 |
0.175 |
1.451 |
| FEDU (primary and above) |
0.557 |
0.804 |
0.171 |
1.527 |
0.353 |
1.221 |
From Table 3 we can identify candidate covariates to be considered for the multivariable model. Including preceding birth interval, birth order, family size, type of birth, breastfeeding status, source of drinking water, literacy of mother, area of residence, mother's age at first birth, marital status and birth order (1996-2000), preceding birth interval, birth order, family size, type of birth, breastfeeding status, source of drinking water, literacy of mother, area of residence, mother educational level (2001-2005), and preceding birth interval, birth order, family size, type of birth, breastfeeding status, source of drinking water, marital status (2006-2011), respectively, in the model, one at a time, result in a significant reduction in p-value. Also the covariates toilet facility, sex of a child and mother educational level, father educational level (1996-2000), toilet facility, father educational level (2001-2005), and area of residence, toilet facility, mother education level (2006-2011), are significant at the 25% level of significance, respectively. Hence, all these covariates are considered in the multivariable Cox regression model (Table 3).
Discussion
In survival analysis the measure of effect is the hazard ratio. It is interpreted in the same way as the odds ratio. The higher the hazard ratio the lower is the survival probability, and vice versa.
For the previous five years period before 2000
Mortality risk of child increases as size of family increases. The risk of dying for a child born in family of size 4-6 is higher by 45 percent relative to those born in family with size of 1-3 (reference category). Children born in a family with size of seven and above have a significantly higher hazard rate than children born in a family with size of 1-3, i.e., children born in a family of size seven and above have a 2.226 times higher risk of death as compared with children in the reference category. In contrast, a study conducted in Ethiopia by Desta obtained a negative relationship between family size and child mortality (as the family size increased, child mortality becomes lower) [17,18].
Preceding birth interval has a significant negative association with under-five mortality. Children born 2-3 years and more than 3 years after the previous birth have a reduced risk of child mortality by 19 and 48 percent, respectively, relative to children born less than 2 years after the previous birth. This finding is consistent with a study conducted in Ethiopia by Belaineh et al. and Desta [18,19].
Higher birth orders (>4) have the highest mortality risk. Child with these characteristics are 93% more likely to die in infancy relative to the reference group births of order one (HR=1.934, 95% CI: 1.415 to 2.638). Child of order two through four are dying at a rate 57.5% higher than child of order one (HR=1.575, 95% CI: 1.060 to 2.842). The confidence intervals for higher birth order and birth order two through four indicate that the rate could actually be as high as 2.638 and 2.842 and as low as 1.415 and 1.060, respectively. This result is in accordance with study conducted by Samuel [20].
The hazard ratio of a child who was not breastfed as compared to those who were breastfed is 1.037. This means the risk of under-five mortality for children who were not breastfed is about 1.037 times higher than children who were breastfed. The 95% confidence interval also suggests that the risk of death for children who were not breastfed is 1.029 times as low and 2.656 times as large as those who were breastfed. Breastfeeding is positively related with child’s survival chances. In literature most of the studies also suggest positive relation between child health and breastfeeding [6,7,21].
The risk of dying for a child born in a family without access to pipe drinking water is higher by 80.5% relative to those born in a family with access to pipe drinking water. The 95% confidence interval (1.753, 3.524) implies that the risk of death of children whose source of water is not pipe water is 1.753 as low and 3.524 as high as those in the reference group. This result is in accordance with Tibebu [21].
Type of birth (single vs. multiple) is also a significant predictor of under-five mortality. Children of multiple births are 4.751 more likely to die before age 5 relative to the reference group of single birth. The 95% confidence interval (2.086 to 5.714) indicates that the risk of death for a child who is of multiple births is 2.086 times as low and 5.714 times as large as those who were single birth. Several studies also identified birth type to be related with child death as multiple birth is associated with a higher risk of child mortality [18,21].
The reference category for the mother age group is age >16. The estimated hazard ratio for the covariate mother age less than 16 is 1.368. This implies that child who are born to mothers of age group of less than 16 are dying at a rate 37% higher than those who are in the elder age group (age ≥ 16). The confidence interval suggests that the hazard ratios are as low as 1.007 and as high as 1.926. This result is in accordance [21].
The hazard ratio for female is 0.704. Thus, female child’s have a 30% lower risk rate of death than male child’s. The confidence interval indicates that the risk of death for female infants could be as low as 0.015 and as high as 0.980. This result is in accordance with [20,22].
For the previous five years period before 2005
Mortality risk of child increases as size of family increases. The risk of dying for a child born in family of size 4-6 is higher by 6.736 time percent relative to those born in family with size of 1-3 (reference category). Children born in a family with size of seven and above have a significantly higher hazard rate than children born in a family with size of 1-3, i.e., children born in a family of size seven and above have a 7.049 (HR 7.049, 95% CI: 4.586, 11.880) times higher risk of death as compared with children in the reference category. In contrast, Desta obtained in Ethiopia a negative relationship between family size and child mortality (as the family size increased, child mortality becomes lower) [18].
Preceding birth interval has a significant negative association with under-five mortality. Children born 2-3 years and more than 3 years after the previous birth have a reduced risk of child mortality by 66 and 41.4%, respectively, relative to children born less than 2 years after the previous birth. This finding is consistent with Belaineh et al. [19] and Desta [18].
Higher birth orders (>4) have the highest mortality risk. Child with these characteristics are 83% more likely to die in age less than 5 relative to the reference group births of order one (HR=1.832, 95% CI: 1.801 to 6.374). Child of order two through four are dying at a rate 67.5% higher than child of order one (HR=1.675, 95% CI: 1.247 to 12.123). The confidence intervals for higher birth order and birth order two through four indicate that the rate could actually be as high as 6.374 and 12.123 and as low as 1.801 and 1.247, respectively. This result is in accordance with [7].
The hazard ratio of a child who was not breastfed as compared to those who were breastfed is 2.248. This means the risk of under-five mortality for children who were not breastfed is about 2.248 times higher than children who were breastfed. The 95% confidence interval also suggests that the risk of death for children who were not breastfed is 1.584 times as low and 3.007 times as large as those who were breastfed. Breastfeeding is positively related with child’s survival chances. In literature most of the studies also suggest positive relation between child health and breastfeeding [4,6,7].
The risk of dying for a child born in a family without access to pipe drinking water is higher by 53.5% relative to those born in a family with access to pipe drinking water. The 95% confidence interval (1.446, 5.286) implies that the risk of death of children whose source of water is not pipe water is 1.446 as low and 5.286 as high as those in the reference group [18].
Type of birth (single vs. multiple) is also a significant predictor of under-five mortality. Children of multiple births are 1.062 more likely to die before age 5 relative to the reference group of single birth. The 95% confidence interval (1.011 to 3.359) indicates that the risk of death for a child who is of multiple births is 1.011 times as low and 3.359 times as large as those who were single birth. Several studies also identified birth type to be related with child death as multiple births is associated with a higher risk of child mortality [7,18].
The reference category for the mother age group is age >16. The estimated hazard ratio for the covariate mother age less than 16 is 1.008. This implies that child who are born to mothers of age group of less than 16 are dying at a rate 8% higher than those who are in the elder age group (age ≥ 16). The confidence interval suggests that the hazard ratios are as low as 1.001 and as high as 3.720. This result is in accordance with [4,7].
For the previous five years period before 2011
Mortality risk of child increases as size of family increases. The risk of dying for a child born in family of size 4-6 is higher by 1.879 time percent relative to those born in family with size of 1-3 (reference category). Children born in a family with size of seven and above have a significantly higher hazard rate than children born in a family with size of 1-3, i.e., children born in a family of size seven and above have a 2.164 (HR=2.164, 95% CI: 1.987, 8.215) times higher risk of death as compared with children in the reference category. In contrast, Desta obtained in Ethiopia a negative relationship between family size and child mortality (as the family size increased, child mortality becomes lower) [18].
Preceding birth interval has a significant negative association with under-five mortality. Children born 2-3 years and more than 3 years after the previous birth have a reduced risk of child mortality by 31 and 52.5%, respectively, relative to children born less than 2 years after the previous birth. This finding is consistent with [4,6,7].
Higher birth orders (>4) have the highest mortality risk. Child with these characteristics are 2.067 times more likely to die in age less than 5 relative to the reference group births of order one (HR=2.067, 95% CI: 1.098 to 8.256). Child of order two through four are dying at a rate 23.6% higher than child of order one (HR=1.236, 95% CI: 1.031 to 12.199). The confidence intervals for higher birth order and birth order two through four indicate that the rate could actually be as high as 8.256 and 12.199 and as low as 1.098 and 1.031, respectively. This result is in accordance with [6,18].
The hazard ratio of a child who was not breastfed as compared to those who were breastfed is 1.530. This means the risk of under-five mortality for children who were not breastfed is about 1.530 times higher than children who were breastfed. The 95% confidence interval also suggests that the risk of death for children who were not breastfed is 1.006 times as low and 6.568 times as large as those who were breastfed. Breastfeeding is positively related with child’s survival chances. In literature most of the studies also suggest positive relation between child health and breastfeeding [6,7,18].
The risk of dying for a child born in a family without access to pipe drinking water is higher by 76% relative to those born in a family with access to pipe drinking water. The 95% confidence interval (1.421, 9.373) implies that the risk of death of children whose source of water is not pipe water is 1.421 as low and 9.373 as high as those in the reference group. This result is in accordance [4,6].
In conclusion, the finding of this study agreed, to great extent, with the finding of the studies discussed above. However, in this study mother educational level is not found as a determinant factor- a result is not in line with literature. Moreover finding discussed above about family size opposite when it comes to Desta [18].
Conclusion
Our study suggests that family size, preceding birth interval, birth order, breastfeeding status, and source of drinking water were significant determinants of under-five mortality in the region. Community-based intervention is required and should focus on child spacing, feeding breast milk, improve access to safe/pipe drinking water and poverty eradication programs, particularly in rural areas, to reduce avoidable under-five mortality in Somali region.
Ethics Approval and Consent to Participate
Ethical considerations. The protocol for the EDHS was approved by the Ethiopia Health and Nutrition Research Institute Review Board, National Research Ethics Review Committee (NRERC) at the Federal Democratic Republic of Ethiopia Ministry of Science and Technology, the Institutional Review Board of ICF Macro, and the Centers for Disease Control and Prevention (CDC) in Atlanta.
Availability of Data and Materials
The raw dataset is available from the corresponding author on reasonable request.
Competing Interests
The authors declare that they have no competing interests.
Funding
This study was made possible by the generous support of the Jigjiga University.
Authors' Contributions
SG and FG have contributed from initial to final stage of the study equally. Moreover, SG participated in the data analysis. FG involved on critically reviewed the manuscript. All authors read and approved the manuscript.
Acknowledgments
The researchers want to acknowledge Jig-jiga University which provided the funds that were used in this study.
19426
References
- Bhutta ZA, Chopra M, Axelson H, Berman P, Boerma T, et al. (2015) Countdown to 2015 decade report (2000-10): Taking stock of maternal, newborn and child survival. Lancet 375:2032-2044.
- Marmot M (2007) Achieving health equity: from root causes to fair outcomes. Lancet 370:1153-1163.
- World Health Organization Report (2015) Global health observatory (GHO) data 2015.
- Becher H, Muller O, Jahn A, Gbangou A, Kynast-Wolf G, et al. (2004) Risk factors of infant and child mortality in rural Burkina Faso. Bull World Health Organ 82:265-273.
- Manda SO (1995) Birth intervals, breastfeeding and determinants of childhood mortality in Malawi. SocSci Med 48:301-312.
- Adlakha AL, Suchindran CM (1985) Factors affecting infant and child mortality. J BiosocSci 17:481-496.
- Bailey M (1989) Individual and environmental influence on infant and child mortality in rural Sierra Leone: A multivariate analysis. Ren Kou XueKan 12:155-185.
- Benefo K, Schultz TP (1996) Fertility and child mortality in Cote d’Ivoire and Ghana. World Bank Econ Rev 10:123-158.
- You D, New JR, Wardlaw T (2014) Report on Levels and trends in child mortality, the United Nations Inter-agency Group for Child Mortality Estimation.
- World Health Organization (2006) Neonatal and perinatal mortality country, regional, and global estimates.
- CSA (2012) Ethiopian demographic and health survey 2011, Addis Ababa, Ethiopia and Calverton, Maryland USA. Ethiopia central statistical agency and ORC macro.
- CSA (2001) Ethiopian demographic and health survey 2000, Addis Ababa, Ethiopia and Calverton, Maryland USA. Ethiopia central statistical agency and ORC macro.
- CSA (2006) Ethiopian demographic and health survey 2005, Addis Ababa, Ethiopia and Calverton, Maryland USA. Ethiopia central statistical agency and ORC macro.
- Federal democratic republic of Ethiopia, Central statistical agency population (2013) Projection of Ethiopia for all regions: At Weredalevel from 2014-2017.
- Mark S (2009) An introduction to survival analysis.Epi Centre, IVABS,Massey University.
- Desta M (2011) Infant and child mortality in Ethiopia: The role of socioeconomic, demographic and biological factors In the previous five years period of 2000 and 2005.
- Belaineh G, Amare D, Fasil T (2007) Determinants of under-five mortality in Gilgel Gibe Field Research Center, Southwest Ethiopia. Ethiop J Health Dev 21:117-124.
- Samuel M (2011) Determination of factors associated with high risk of infant mortality in Ethiopia. M.Sc. Thesis, Addis Ababa University, Addis Ababa.
- Buwembo P (2010) Factors associated with under-5 mortality in South Africa: Trends 1997-2002. University of Pretoria, Pretoria.
- Tibebeu G (2011) Identification of risk factors and regional differentials in under five mortality in thiopia using multilevel count model. M.Sc. Thesis, Addis Ababa University, Addis Ababa.

