Keywords
Quality control process, Graphical assessment, Blood donors
Introduction
The principles of quality control (QC) include procedures designed to detect unusual patterns (i.e. trends and shifts) which may not be of biological origin but may be due to analytical variation [1-5]. Prior to blood donations being accepted for transfusion, the donations are tested for transfusion transmitted infections (TTI). When screening blood donations, it is crucial to use an immunoassay (IA) with high sensitivity because not identifying a contaminated donation has significant implications for the recipients of the donation and for public he alth and sa fety [6-8].
Various factors may affect the test results, including changes of IA reagent batches, variation in the performance of the instrument (if applicable), the operator’s processes and factors contributed by the e nvironment [9-11].
A QC process has been implemented in many blood screening laboratories to monitor the consistency of IAs used to screen for TTI. There is evidence that some of the measures and principles of QC commonly used in clinical chemistry, such as an assumption of commutability of the QC result with the patient’s sample results, may be less relevant in serological testing [12-16].
IAs with high analytical sensitivity, such as the PRISM chemiluminescent immunoassay (PRISM; Abbott Laboratories, Wiesbaden, Germany), are routinely used to screen donor samples for TTI. Like all biological assays, the PRISM IAs are subject to variation due to changes in reagent batches, instrument variability, inconsistencies in operator processes and environmental factors. Over the past decade, NRL (Australia; www.nrl.gov.au) has conducted a QC program for monitoring the performance of serological screening of blood donors for TTI [12,15,16]. This QC program assesses the day-to-day variability of the testing procedure and is based on established methodologies and statistical rules [17-19]. As a result, the QC program has created a large volume of data. Comprehensive analysis of these data may help to establish performance indicators in testing procedures by estimating and/or re-defining the effect that the IA variation has on the donor test results.
Previously, we investigated the clinical relevance of QC monitoring by measuring the impact various sources of variation in QC results has on donor test results obtained from the PRISM HIV- 1/2 and HBsAg IAs [12]. Although QC results showed variations across the reagent batches, donors’ test results remained stable during the study period, implying that, unlike the clinical chemistry experience, proportional changes in the QC results may not have clinically significant effects on the results of serological testing.
In this study, we used a semi-quantitative data assessment tool, quilt-plot (heat-maps), which can convert quantitative results into visual presentations to reveal significant features of data by comparing the change in color intensity [20,21]. Such graphical representation could be useful in monitoring and identifying the significant trends of the data as an instant “snap-shot”. We particularly focused on the changes in QC results due to the different sources of variation in the IA, such as reagent batch changes, different instruments and subchannels, and their impact on the donors’ test results. We also investigated if the highest (or lowest) QC reactivity levels can predict the highest (or lowest) donors’ HBsAg results.
The computer script for this semi-quantitative visual assessment was written using publicly available R 2.15.1 software (submitted as electronic supplementary materials).
Materials and Methods
A total of 177,910 donor samples were tested for HBsAg using the Abbott PRISM HBsAg ChLIA (PRISM HBV). During the same period, 712 QC test results were reported for the same IA. The methodology used has been described in detail elsewhere [12]. Briefly, the samples were tested using the PRISM HBV resulting in a chemiluminescent signal (S) expressed as a quantitative unit. The S unit for each sample was divided by an assay-specific, instrument-derived cut-off (Co) to obtain a test result expressed as a signal to cut-off ratio (S/Co). A total of six PRISM HBV reagent batches and two PRISM instruments (Instrument 1 and Instrument 2) each having two subchannels (A and B) were used in the testing. If the donor’s sample was non-reactive (i.e. S/Co value was <1.0), the result was reported as negative and the donation released for processing. Only results of negative samples were included in the present study because the number of reactive samples was insufficient for analysis in the target population.
During the study period, the laboratory tested a single batch of a multi-marker QC sample, PeliSpy MultiMarker Type 7 (T7; AcroMetrix, Benicia, Ca. USA) in each instrument and each subchannel every 8 hours. The QC test results were submitted to an internet-based QC monitoring program (EDCNet; NRL, Melbourne, Australia: www.nrlqa.net) along with associated testing information. Donors’ test results were extracted from the Abbott PRISM Retest Server into Microsoft Excel. These data were reformatted for further analysis. For each donor, the result fields extracted were date of testing, donor identification number, instrument and subchannel identification, test result (S/Co) and interpretation. For the same period of time, QC test results for T7 were exported into Microsoft Excel from the EDCNet database. These data included the date of testing, instrument and Sub-channel identification, IA reagent batch, test result (S/Co) of the QC sample and whether or not the test run was valid according to the IA manufacturers’ instructions. Only results from valid test runs were analysed in the study.
The two parameters, QC and donors’ test results, were divided into quintiles. The first quintile represented those results in the lowest 20%, while the fifth quintile represented those in the highest 20%.
Semi-quantitative assessment: Quilt-plots/Heat maps
Quilt-plots (also known as heat maps) were created to enhance the interpretation of the data [21]. Briefly, cross-classification of the quintiles of the QC and donors’ test results were presented overall and then stratified by the different source of variation in the IA (i.e. instruments and subchannels).
Theoretically, if the levels of the QC test results and donors’ test results were not associated with each other (i.e., level of one did not change as a function of the other), intensity of the colour would remain unchanged i.e., white across the quintiles. However, if the donor test results did change proportionally with the QC test results, the quilt-plot would be presented as a red colour; the intensity of which would increase with increased association between the two parameters. Using the different shades of red, quilt-plots would reveal differing magnitudes of associations between the quintiles of the QC reactivity and the donors’ test results. These associations may be the indicator for proportional changes while, if the “lighter” shades follows the “darker” shades then follows “lighter” shades (or vice versa), this may be an indicator of non-proportional changes.
Predictors of lowest/highest donor test results
Logistic regression was used to determine whether the lowest/ highest QC test results (first /fifth quintile) were associated with the lowest/highest donor test results.
Odds ratios (ORs) (which measure the associations between the outcome of the interest and exposure variables) and their 95% confidence intervals (CIs) were estimated. Results were presented as both unadjusted as well as adjusted for potential confounders’ effects of the sources of variation of the IA: reagent batches, instruments and subchannels.
Results
The coefficients of variation of the QC and the donors’ test results were estimated to be 13.0 % and 23.9 % respectively (data not shown). The overall mean of the donors’ results, expressed as S/Co, was 0.38 (range: 0.09, 0.99). The overall mean of the QC results, expressed as S/Co, was 2.54 (range: 1.85, 3.48).
Semi-quantitative assessment: Quilt-plots (Heat maps)
QC test results (in quintiles) were compared to the quintiles of the donors’ test results using the quilt-plots overall and then by instruments/subchannels separately (Figures 1 and 2 respectively). Here, associations between the QC and the donors’ test results can be visually examined and interpreted by following the columns from top to bottom or following the rows from left to right. Although, no consistent uniform trend(s) across the quintiles were observed, there were differences regarding the levels of association between the two parameters. For example, in Figure 1, “intense red” in the lowest quintile of the donors’ test results across the first three quintiles of the QC reactivity indicates an association between the lower levels of QC reactivity and the lowest donors’ test results. Relatively small differences were observed between the higher quintiles of the donors’ results and the QC reactivity. There was a notable change in the intensity of the colour i.e. from a pale to a moderate intensity of red, when QC and donors’ test results were both in the highest quintile.
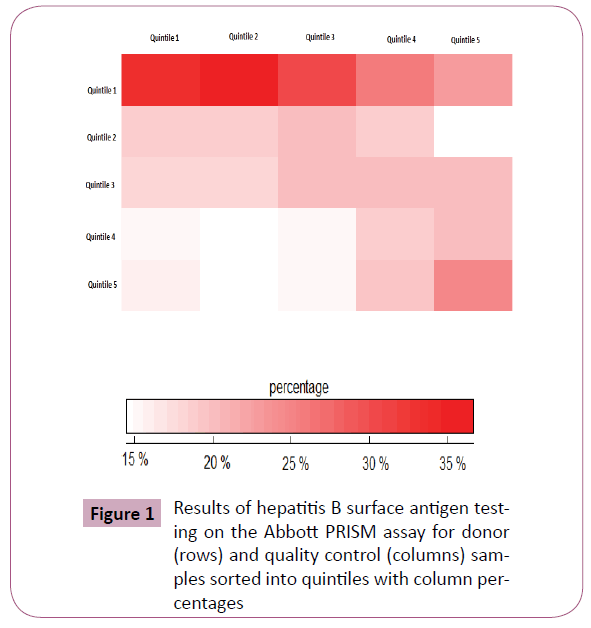
Figure 1: Results of hepatitis B surface antigen testing on the Abbott PRISM assay for donor (rows) and quality control (columns) samples sorted into quintiles with column percentages
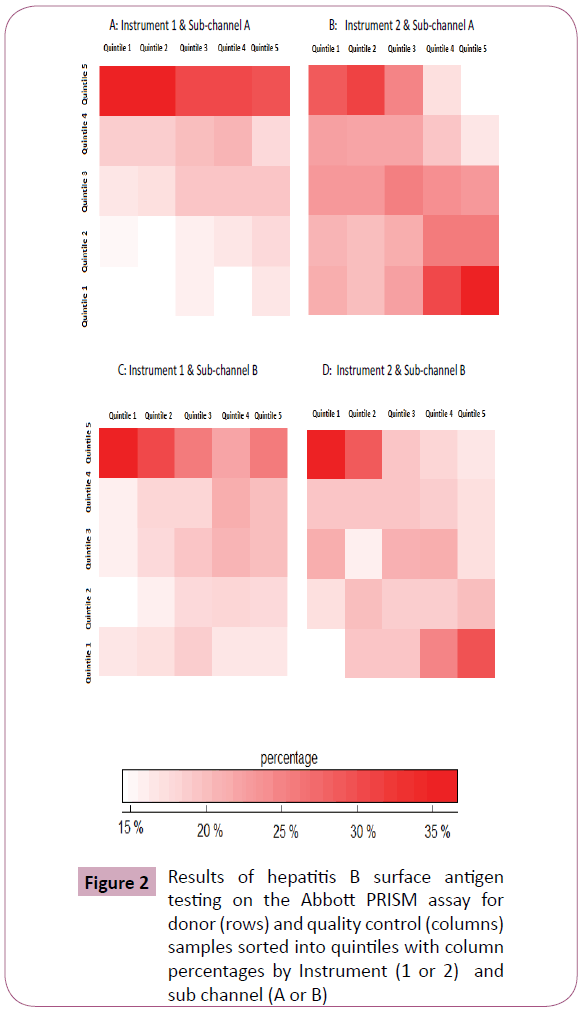
Figure 2: Results of hepatitis B surface antigen testing on the Abbott PRISM assay for donor (rows) and quality control (columns) samples sorted into quintiles with column percentages by Instrument (1 or 2) and sub channel (A or B)
Associations between the two parameters were broadly similar when the quilt-plots were stratified by the instrument type (Figure 2A and 2B) and subchannels (Figure 2C and 2D). Briefly, the QC and donors’ test results did not show particular trend(s) (uniform increases/decreases) regardless of the instruments and subchannels used during the testing procedure; however, intense-red cells in the first quintile of the donors’ results were an indication that they were more likely to be lower when the QC test results were low.
Predictors of lowest/highest donors’ test results
Unadjusted/adjusted ORs and 95% CIs for donor and QC test results are presented in Table 1. QC reactivity levels in the bottom quintile (median=2.17 S/Co) were compared with those in the top quintile (median=3.08 S/Co), with adjustment for the potential confounder effects of the variables. The OR for the lowest donor test results was 1.27 (95% CI: 1.22, 1.32) (Table 1); similar associations were observed when second quintile (median=2.31 S/Co) and third quintile (median=2.47 S/Co) were compared with the top QC reactivity quintile (OR: 1.36, 95% CI: 1.31, 1.41 and OR: 1.12, 95% CI: 1.07, 1.16 respectively). For the fourth quintile, the OR decreased to 0.87 (95% CI: 0.84, 0.91, p<0.001).
| Quality control (QC) reactivity |
| |
Quintile 1 |
Quintile 2 |
Quintile 3 |
Quintile 4 |
Quintile 5 |
| Medianof the signal to cut-off ratio (S/Co) |
2.17 |
2.31 |
2.47 |
2.75 |
3.08 |
| Extreme low HBsAg† |
| Unadjusted model |
1.18 (1.14,1.23) |
1.34 (1.29,1.39) |
1.07 (1.03,1.11) |
0.87 (0.84,0.91) |
1 (referent) |
| Adjusted model‡ |
1.27 (1.22,1.32) |
1.36 (1.31,1.41) |
1.12 (1.07,1.16) |
0.90 (0.86,0.93) |
1 (referent) |
| Extreme High HBsAg†† |
| Unadjusted model |
0.97 (0.93,1.01) |
0.92 (0.89,0.96) |
0.91 (0.88,0.95) |
0.93 (0.89,0.96) |
1 (referent) |
| Adjusted model‡ |
0.92 (0.89,0.96) |
0.91 (0.87,0.94) |
0.89 (0.86,0.92) |
0.91 (0.87,0.95) |
1 (referent) |
† Donors’ results less than lowest 20% of the QC reactivity
†† Donors’ results greater than highest 20% of the QC reactivity
‡ Adjusted for the variables: IA reagent batches, instruments, subchannels
Table 1: kOR and 95% CIs of extreme low† and extreme high†† donors’ result when tested in an immunoassay that detects hepatitis B surface antigen (HBsAg) compared with the median signal to cut-off ratio (S/Co) of the quality control (QC) test results.
The ORs comparing extreme quintiles of the QC reactivity levels and extreme high donor test results are also presented in Table
1. After adjusting for the variables, the QC reactivity in the top quintile compared with that in the bottom quintile was less likely to predict high levels of donor test results (OR: 0.92, 95% CI: 0.89, 0.96). Similar associations were observed when the second, third and fourth quintiles of the QC reactivity were compared to the top quintile (OR: 0.91, 95% CI: 0.87, 0.94; OR: 0.89, 95% CI: 0.86, 0.92; OR: 0.91, 95% CI: 0.87, 0.95 respectively).
We also assessed the sensitivity of the results in randomly selected datasets. For this purpose, a split-sample method was employed to determine 10-equal size sample data sets using Stata 12.0 functions (data not shown). We observed similar associations between the primary outcome of interests (extreme low/high tests results) and the QC reactivity levels as presented in Tables 2 and 3.
| |
Quality control (QC) reactivity |
| |
Quintile 1 |
Quintile 2 |
Quintile 3 |
Quintile 4 |
Quintile 5 |
| Extreme low HBV† |
|
|
|
|
|
| Random Sample # 1 n=17791 (10%) |
|
|
|
|
|
| Unadjusted model |
1.25 (1.15,1.37) |
1.44 (1.33,1.57) |
1.08 (0.99,1.18) |
0.93 (0.85,1.01) |
1 (referent) |
| Adjusted model‡ |
1.37 (1.25,1.50) |
1.48 (1.36,1.61) |
1.14 (1.04,1.24) |
0.96 (0.87,1.05) |
1 (referent) |
| Random Sample # 2 n=17791 (10%) |
|
|
|
|
|
| Unadjusted model |
1.04 (0.96,1.13) |
1.24 (1.15,1.35) |
1.01 (0.93,1.10) |
0.80 (0.73,0.88) |
1 (referent) |
| Adjusted model‡ |
1.11 (1.02,1.21) |
1.26 (1.16,1.37) |
1.05 (0.97,1.15) |
0.82 (0.75,0.90) |
1 (referent) |
| Random Sample # 3 n=17791 (10%) |
|
|
|
|
|
| Unadjusted model |
1.19 (1.10,1.30) |
1.38 (1.27,1.50) |
1.10 (1.00.1.20) |
0.84 (0.76,0.92) |
1 (referent) |
| Adjusted model‡ |
1.27 (1.15,1.38) |
1.40 (1.28,1.52) |
1.14 (1.04,1.24) |
0.86 (0.78,0.94) |
1 (referent) |
| Random Sample # 4 n=17791 (10%) |
|
|
|
|
|
| Unadjusted model |
1.17 (1.07,1.28) |
1.30 (1.20,1.42) |
1.07 (0.98,1.16) |
0.90 (0.82,0.98) |
1 (referent) |
| Adjusted model‡ |
1.25 (1.14,1.37) |
1.33 (1.22,1.45) |
1.11 (1.01,1.21) |
0.92 (0.84,1.01) |
1 (referent) |
| Random Sample # 5 n=17791 (10%) |
|
|
|
|
|
| Unadjusted model |
1.26 (1.16,1.37) |
1.31 (1.21,1.44) |
1.10 (1.01,1.19) |
0.90 (0.83,0.99) |
1 (referent) |
| Adjusted model‡ |
1.39 (1.27,1.52) |
1.36 (1.25,1.48) |
1.16 (1.06,1.26) |
0.94 (0.85,1.03) |
1 (referent) |
| Random Sample # 6 n=17791 (10%) |
|
|
|
|
|
| Unadjusted model |
1.31 (1.16,1.48) |
1.49 (1.32,1.68) |
1.11 (0.98,1.26) |
0.93 (0.82,1.07) |
1 (referent) |
| Adjusted model‡ |
1.42 (1.25,1.61) |
1.52 (1.35,1.72) |
1.17 (1.03,1.33) |
0.96 (0.84,1.10) |
1 (referent) |
| Random Sample # 7 n=17791 (10%) |
|
|
|
|
|
| Unadjusted model |
1.19 (1.06,1.35) |
1.40 (1.24,1.58) |
1.05 (0.92,1.19) |
0.92 (0.81,1.05) |
1 (referent) |
| Adjusted model‡ |
1.32 (1.16,1.49) |
1.43 (1.27,1.61) |
1.11 (0.98,1.27) |
0.95 (0.83,1.10) |
1 (referent) |
| Random Sample # 8 n=17791 (10%) |
|
|
|
|
|
| Unadjusted model |
1.15 (1.02,1.30) |
1.28 (1.14,1.45) |
1.02 (0.90,1.15) |
0.85 (0.74,0.96) |
1 (referent) |
| Adjusted model‡ |
1.22 (1.08,1.38) |
1.30 (1.16,1.47) |
1.05 (0.93,1.20) |
0.86 (0.75,0.98) |
1 (referent) |
| Random Sample # 9 n=17791 (10%) |
|
|
|
|
|
| Unadjusted model |
1.21 (1.07,1.37) |
1.36 (1.21,1.53) |
1.07 (0.95,1.21) |
0.81 (0.71,0.92) |
1 (referent) |
| Adjusted model‡ |
1.29 (1.14,1.46) |
1.37 (1.22,1.54) |
1.12 (0.99,1.27) |
0.82 (0.72,0.94) |
1 (referent) |
| Random Sample # 10 n=17791 (10%) |
|
|
|
|
|
| Unadjusted model |
1.14 (1.05,1.23) |
1.29 (1.20,1.39) |
1.10 (1.02,1.19) |
0.88 (0.81,0.95) |
1 (referent) |
| Adjusted model‡ |
1.21 (1.12,1.32) |
1.32 (1.23,1.43) |
1.14 (1.05,1.23) |
0.89 (0.83,0.98) |
1 (referent) |
Table 2: Quality control (QC) reactivity.
| |
Quality Control (QC) reactivity |
| |
Quintile 1 |
Quintile 2 |
Quintile 3 |
Quintile 4 |
Quintile 5 |
| Extreme High HBV†† |
|
|
|
|
|
| Random Sample # 1 n=17791 (10%) |
| Unadjusted model |
0.89 (0.82,0.97) |
0.90 (0.83,0.98) |
0.91 (0.84,0.99) |
0.88 (0.80,0.95) |
1 (referent) |
| Adjusted model‡ |
0.84 (0.77,0.92) |
0.89 (0.82,0.97) |
0.88 (0.81,0.95) |
0.86 (0.79,0.93) |
1 (referent) |
| Random Sample # 2 n=17791 (10%) |
| Unadjusted model |
1.02 (0.94,1.11) |
0.92 (0.85,0.99) |
0.89 (0.82,0.97) |
0.91 (0.84,0.99) |
1 (referent) |
| Adjusted model‡ |
0.98 (0.90,1.07) |
0.92 (0.84,0.99) |
0.86 (0.79,0.94) |
0.90 (0.82,0.97) |
1 (referent) |
| Random Sample # 3 n=17791 (10%) |
| Unadjusted model |
1.00 (0.93,1.10) |
0.92 (0.85,1.00) |
0.93 (0.86,1.01) |
0.95 (0.87,1.03) |
1 (referent) |
| Adjusted model‡ |
0.98 (0.90,1.10) |
0.92 (0.85,1.00) |
0.91 (0.84,0.99) |
0.94 (0.86,1.02) |
1 (referent) |
| Random Sample # 4 n=17791 (10%) |
| Unadjusted model |
0.94 (0.86,1.02) |
0.88 (0.81,0.96) |
0.90 (0.83,0.98) |
0.96 (0.88,1.04) |
1 (referent) |
| Adjusted model‡ |
0.86 (0.79,0.94) |
0.86 (0.79,0.94) |
0.85 (0.78,0.93) |
0.93 (0.85,1.01) |
1 (referent) |
| Random Sample # 5 n=17791 (10%) |
| Unadjusted model |
0.94 (0.86,1.02) |
0.88 (0.81,0.96) |
0.90 (0.83,0.98) |
0.96 (0.88,1.04) |
1 (referent) |
| Adjusted model‡ |
0.86 (0.79,0.94) |
0.86 (0.79,0.94) |
0.85 (0.78,0.93) |
0.93 (0.85,1.01) |
1 (referent) |
| Random Sample # 6 n=17791 (10%) |
| Unadjusted model |
0.93 (0.87,1.00) |
0.89 (0.83,0.96) |
0.92 (0.85,0.99) |
0.89 (0.82,0.96) |
1 (referent) |
| Adjusted model‡ |
0.88 (0.82,0.95) |
0.89 (0.82.0.95) |
0.88 (0.82,0.95) |
0.87 (0.80,0.94) |
1 (referent) |
| Random Sample # 7 n=17791 (10%) |
| Unadjusted model |
0.87 (0.77,0.97) |
0.91 (0.81,1.02) |
0.91 (0.81,1.03) |
0.88 (0.78,0.99) |
1 (referent) |
| Adjusted model‡ |
0.81 (0.72,0.91) |
0.89 (0.80,1.00) |
0.87 (0.78,0.98) |
0.86 (0.76,0.97) |
1 (referent) |
| Random Sample # 8 n=17791 (10%) |
| Unadjusted model |
0.92 (0.82,1.03) |
0.90 (0.80,1.01) |
0.90 (0.80,1.02) |
0.87 (0.77,0.98) |
1 (referent) |
| Adjusted model‡ |
0.88 (0.78,0.99) |
0.89 (0.79,0.99) |
0.88 (0.78,0.99) |
0.86 (0.76,0.97) |
1 (referent) |
| Random Sample # 9 n=17791 (10%) |
| Unadjusted model |
0.94 (0.83,1.06) |
0.94 (0.84,1.06) |
0.88 (0.78,0.99) |
0.89 (0.79,1.01) |
1 (referent) |
| Adjusted model‡ |
0.91 (0.80,1.02) |
0.93 (0.83,1.05) |
0.86 (0.76,0.97) |
0.88 (0.78,0.99) |
1 (referent) |
| Random Sample # 9 n=17791 (10%) |
| Unadjusted model |
0.91 (0.82,0.99) |
0.91 (0.83,1.01) |
0.92 (0.83,1.01) |
0.89 (0.80,0.98) |
1 (referent) |
| Adjusted model‡ |
0.86 (0.78,0.95) |
0.90 (0.82,0.99) |
0.89 (0.80,0.98) |
0.87 (0.78,0.96) |
1 (referent) |
Table 3: Quality Control (QC) reactivity.
Discussion
The test results obtained from using serological IAs are affected by several sources of variation including changes in reagent batches, instruments, operator and other environmental factors [8-11]. We used a semi-quantitative graphical tool, quiltplots to compare the relative associations between the reactivity of a single QC sample and the donors’ test results overall and stratified by sources of variation. The current study defined high/ low QC reactivity and donor test results based on the distribution of the observed test results (i.e. percentiles). This method can be implemented rapidly and the analysis reported in a visual and intuitive manner. Visual inspections of the quilt-plots (heat-maps) revealed differing relationships between QC reactivity and donors’ test results depending upon the quintiles. In a formal quantitative analysis, the lowest levels of QC reactivity (bottom quintile) were determined to have a statistically significant association with the lowest donor test results (bottom quintile). Consistent with this finding, the highest levels of QC reactivity (top quintile), when compared with the lowest levels (bottom quintile), were less likely to be the predictors of the highest donor test results (top quintile). However, although statistically significant, these small effects were detected due to the high statistical power of the study and therefore their clinical importance and relevance are questionable. These observations were consistent with previous findings where upward/ downward shifts in the QC reactivity were shown to be associated with negligible changes in negative donor test results [12].
Assumptions such as commutability of the QC reactivity and donors’ test results when there is a pre-defined cut-point, for example in clinical chemistry, may not be appropriate in serological testing [10-12]. Specific guidelines have been described and recommended the use of QC programs [17-19]. These guidelines describe important features of QC programs that are relevant for serological IAs including selection of a homogeneous and stable QC sample in which the analyte is present at a clinically relevant concentration.
The current study has several limitations. First of all, this analysis was not an attempt to conduct a comprehensive QC assessment but rather present a simple visual analytical tool that can be used to for quality control. Because of the insufficient number of positive donor test results, only negative donors’ test results were included in the analyses. However, previous investigations show that, “even if the reactivity of positive donor samples changed in proportion with the change in reactivity of the QC sample”, few false-negative donor test results would occur [12].
Conclusion
Although QC programs may analyse the QC test results using statistical charts and related QC rules to monitor the performance of serological IAs, additional information from the testing process, such as changes in reagent batches and instrument identification can be used to further the understanding of the results. Rapid assessment of this information using intuitive graphical presentations such as quilt-plots may bring instant insight into the testing process. Analysis of information from QC databases may provide greater insight and play a key role in determining the expected variation of patient/ donor test results resulting from changes in QC test results.
Acknowledgment
Australian governments fully fund the Australian Red Cross Blood Service for the provision of blood products and services to the Australian Community.
5957
References
- leveyS, Jennings ER (1950) The use of control charts in the clinical laboratory. Am J ClinPathol 20: 1059-1066.
- henryRJ, SegaloveM (1952) The running of standards in clinical chemistry and the use of the control chart. J ClinPathol 5: 305-311.
- Burtis CA, Ashwood ER (1994) Tietz Fundamentals of Clinical Chemistry, (second edition), WB Saunders, Philadelphia.
- Westgard JO, Barry PL. (1986) Cost-effective quality control: managing the quality and productivity of analytical processes. AACC Press, Washington.
- Ross JW, Fraser MD (1980) Analytical clinical chemistry imprecision - state of the art for thirty-one analytes. Am J ClinPathol 74: 521-30.
- Constantine NT, Saville RD, Dax EM (2005) Retroviral testing and quality assurance; essentials for laboratory diagnosis. Med- Mira Laboratories Inc.
- Jacobson R (1996) Principles of validation of diagnostic assays for infectious diseases. In R. Reichard (edn) OIE manual of standards for diagnostic tests and vaccines. Office International des Epizooties 8-15, Paris, France.
- Badrick T (2003) Quality leadership and quality control. ClinBiochem Rev 24: 81-93.
- Dechert J, Case KE (1998) Multivariate approach to quality control in clinical chemistry. ClinChem 44: 1959-1963.
- Petersen PH, Ricós C, Stöckl D, Libeer JC, Baadenhuijsen H, et al. (1996) Proposed guidelines for the internal quality control of analytical results in the medical laboratory. Eur J ClinChemClinBiochem 34: 983-999.
- Westgard JO, Seehafer JJ, Barry PL (1994) Allowable imprecision for laboratory tests based on clinical and analytical test outcome criteria. ClinChem 40: 1909-1914.
- Dimech W, Freame R, Smeh K, Wand H (2013) A review of the relationship between quality control and donor sample results obtained from serological assays used for screening blood donations for anti-HIV and hepatitis B surface antigen. AccredQualAssur 18: 11-18.
- Pham T, Dimech W, Karakaltsas M, Dax EM (2008) Variation in the performance of reagent batches of the Abbott Architect HIV Ag/Ab combo CMIA detected in an international quality control program. In: XXXth International congress of the ISBT, VoxSanguinis, Wiley- Blackwell 95: 56-77, Macao, SAR, China.
- Dimech W, Walker S, Jardine D, Read S, Smeh K, et al. (2004) Comprehensive quality control programme for serology and nucleic acid testing using an internet-based application. AccredQualAssur 9:148-151.
- Dimech W, Smeh K, Walker S, Karakaltsas M (2010) Review of batch-to-batch variation of Pelispy type 7, a multimarker quality control sample used to monitor the performance of Abbott PRISM chemiluminescent immunoassays. In: XXX1st International congress of the international society of blood transfusion, VoxSanguinis, Wiley-Blackwell 99: 301-302, Berlin, Germany.
- Walker S1, Dimech W, Kiely P, Smeh K, Francis B, et al. (2009) An international quality control programme for PRISM chemiluminescent immunoassays in blood service and blood product laboratories. Vox Sang 97: 309-316.
- 20a: US Food and Drug Administration (2001) Guidance for industry: revised recommendations regarding invalidation of test results of licensed and 510(k) cleared bloodborne pathogen assays used to test donors. U.S. Department of Health and Human Services, Food and Drug Administration Center for Biologics Evaluation and Research.
- 20b: CLSI (2006) Statistical quality control for quantitative measurementprocedures: principles and definitions; ApprovedGuidelines, vol 26, 3rd edn. CLSI document
- 20c: CLSI (2011) Laboratory quality control based on risk management, Approved guideline, vol 30 CLSI document EP23-A
- Wand H, Iversen J, Law M, Maher L (2014) Quilt plots: a simple tool for the visualisation of large epidemiological data. PLoS One 9: e85047.