Keywords
Visual function impairment; Road traffic crash; Commercial drivers; Uncorrected refractive error
Introduction
Commercial drivers are considered to be very important, especially in a developing country such as Nigeria, where majority of the people go on public transport. This reliance on public transportation makes operators of commercial vehicles an important component of the socioeconomic development hence the need to ensure its safety. While recent study have shown an increase in the rate of road traffic crash (RTC) globally [1], developing countries like Nigeria are bearing disproportionately high burden of injuries and fatalities.
Ability to see is inarguably a fundamental component of safe driving because driving relies heavily on vision for its successful execution [2]. Research over the past few decades has addressed the role of vision in driving safety (road traffic crash involvement) and in driving performance (both on-road and using interactive simulators in the laboratory) [2]. Vision constitutes about 95% of the sensory requirements for driving [3]. Clear and comfortable vision is important for driving for a number of reasons which includes; to judge distances, in reading of road signs and traffic lights as well as in responding to changes in the environment quickly and efficiently. Impaired visual function may translate to delayed response or failure to perceive potentially dangerous situations exposing the drivers, passengers and other road users to avoidable dangers. Therefore a driver’s vision will largely determine how efficiently he will perform; this may consequently influence the occurrence of road traffic crashes (RTCs).
The relationship between visual function (visual acuity, visual field, colour vision etc.) and RTCs have been equivocal. Some studies have found no association between the impairment of visual function and the occurrence of RTCs [3-8]. Others on the other hand have reported a weak relationship [9-12]. Road traffic crashes (RTCs) have emerged as a major global public health problem of this century and are now recognized as a neglected pandemic [13]. They accounted for 2.1% of total deaths and 21.0% of total injury globally [14], and developing and underdeveloped countries accounted for 80% of these deaths [15]. However many of the studies in Nigeria looked at separate segments of drivers. Therefore our study was motivated by society’s need to preserve public safety on the roadways by studying both intra and intercity commercial drivers together.
In terms of the standard for driving, the maximum distance visual acuity (VA) requirement for driving in Nigeria as set by the Nigerian Federal Road Safety Corps (FRSC) is 6/9 in the better eye and 6/24 in the second eye for commercial drivers [16]. A continuous horizontal binocular visual field of 140° or more and 20° continuous above and below fixation with both eyes open and examined together is recommended for Nigerian drivers. Any visual field less than 110° horizontally should be a contraindication for driving in Nigeria [16,17]. Compliance to this standard is germane to driving since an adequate field of vision is an important panacea to safe driving as well as good visual acuity [1]. Drivers with acuity worse than the required standard are likely to have difficulty reading highway signage (e.g., speed limit signs, stop signs, exit signs on the interstate) at distances deemed safe for making vehicle control decisions. Presently, there is no set standard for color vision in Nigeria.
The purpose of this study was to determine the prevalence of visual function impairment among commercial drivers in a north central state of Nigeria and their relationship with involvement in road traffic crash. The data from this study will provide necessary indigenous information on visual functions among different categories of commercial drivers thereby steering the direction of appropriate policy towards drivers’ screening, licensure and regulations.
Methodology
This cross-sectional descriptive study was carried out in Ilorin, the capital city of Kwara State, in the north central geographical zone of Nigeria. Of the estimated 4,729 commercial drivers who are registered with National Union of Road Transport Workers (NURTW), Road Transport Employers Association of Nigeria (RTEAN), State government owned transport service (Kwara Express) and other private owned motor parks in Ilorin metropolis, 328 consenting drivers were randomly selected into the study. Those eligible for the study were drivers who drive four wheel vehicles and convey passengers both intra and intercity.
An approval for the study was obtained from the Department of Epidemiology and Community Health, University of Ilorin. Informed consent was obtained from each of the selected participants after comprehensive information detailing the study summary was read to them. The study followed the tenets of the declaration of Helsinki.
Participants’ information and data were collected with the use of interviewer administered semi-structured questionnaires in each of the selected motor parks. The questionnaire elicited questions to obtain information concerning respondents’ sociodemographical data, involvement in RTC, ocular history and visual function assessment.
Visual function tests were done by the principal researcher and an assistant at designated spaces in broad daylight at the motor parks with the use of the Snellen’s chart and Illiterate ‘E’ chart to assess the distance VA for those who can read and those who cannot read respectively. The charts were placed 6 metres from the respondents and each eye was tested separately. Pinhole VA testing for each eye was also done for those whose VA was less than 6/6. Colour vision was tested using the Ishihara pseudoisochromatic plates. Visual field was tested by confrontation method using a good contrast test target. External eye examination using a pen torch and an internal eye examination using a direct ophthalmoscope was done. All findings were documented on clinical report sheet at the back of each respondent's questionnaire copy. A developed standard operating procedure (SOP) was strictly adhered to in the course of this study. Respondents who required further evaluation were referred to specialists in secondary and tertiary health facilities in Ilorin.
Data analysis was done using SPSS version 18.0. Appropriate test of significance (chi-square test) was used to test statistics and the level of significance was predetermined at p-value of equal to or less than 0.05 at 95% confidence level.
Results
Sociodemographic data
Three hundred and twenty-eight consenting commercial drivers participated in the study. The age of the respondents ranged from 20 to 70years with a mean age of 46 + 10.13 years. Majority (63.7%) of them were in the age group 40 – 59 years. The respondents were all male. Many of the respondents (44.2%) had primary education while 56 (17.1%) had no formal education. Almost three quarter (73.2%), of the respondents had no other occupation other than driving. Majority (97%) of the respondents were married and their ethnicity were mainly (93.6%) Yoruba (Table 1).
Table 1: Socio-demographic Variables (N=328).
| Variables |
Frequency |
Percentage |
| Age groups |
| 20 – 29 |
15 |
4.6 |
| 30 – 39 |
70 |
21.3 |
| 40 – 49 |
94 |
28.7 |
| 50 – 59 |
115 |
35 |
| 60 and above |
34 |
10.4 |
| Educational Level |
| None |
56 |
17.1 |
| Primary |
145 |
44.2 |
| Secondary |
73 |
22.3 |
| Tertiary |
20 |
6 |
| Quaranic |
32 |
9.8 |
| Vocational Training |
2 |
0.6 |
| Other Occupations |
| None |
240 |
73.2 |
| Artisans |
48 |
14.6 |
| Trading |
18 |
5.5 |
| Self employed |
4 |
1.2 |
| Civil Servant |
5 |
1.5 |
| Farmers |
13 |
4 |
| Marital status |
| Single |
10 |
3 |
| Married |
318 |
97 |
| Religion |
| Islamic |
273 |
83 |
| Christianity |
55 |
17 |
| Others |
0 |
0 |
| Ethnicity |
| Fulani |
3 |
0.3 |
| Hausa |
6 |
1.8 |
| Igbo |
1 |
0.3 |
| Nupe |
5 |
1.6 |
| Yoruba |
307 |
93.6 |
| Others |
6 |
1.8 |
Driving license acquisition
Majority of the respondents (97.9%) possessed a driver’s license. More than two-third had a driving test conducted before obtaining license. Majority (97.8%) renewed their license on expiration. Less than one-third (27.7%) had eye test before obtaining license while 49.4% of them had a repeated eye test during license renewal (Table 2).
Table 2: Possession and Mode of Obtaining License by Respondents.
| Driving license variables |
Yes (%) |
No(%) |
| Possession of driving license (N=328) |
321 (97.9) |
7 (2.1) |
| Driving test conducted (n=321) |
268 (83.5) |
53 (16.5) |
| Eye test conducted (n=321) |
89 (27.7) |
232 (72.3) |
| Renewal of license on expiration (n=321) |
314 (97.8) |
7 (2.2) |
| Repeat of eye test (n=89) |
44 (49.4) |
45 (50.6) |
Driving safety
About one-fifth of the respondents (19.5%) had been involved in RTC in the past 5 years. Only 1 driver has had RTC thrice in the last 5 years.
More than half (62.5%) of the road traffic crashes were without any injury sustained. The cause of the RTC was mainly vehicular factor (76.6%) as shown on Table 3.
Table 3: Road Traffic Crash History among Respondents.
| Variables |
Frequency |
Percentage |
| Involvement in Road Traffic Crash in the Past (N=328) |
| Yes |
64 |
19.5 |
| No |
264 |
80.5 |
| Number of Road Traffic Crash in the Past 5 Years (n=64) |
| None |
32 |
50.0 |
| Once |
25 |
39.1 |
| Twice |
6 |
9.4 |
| Thrice |
1 |
1.5 |
| Seriousness of the Crash (n=64) |
| No injury |
40 |
62.5 |
| Mild to serious injury |
14 |
21.9 |
| Fatal injury |
10 |
15.6 |
| Cause of crash (n=64) |
| Road factor |
4 |
6.3 |
| Vehicular factor |
49 |
76.6 |
| Human factor |
8 |
12.5 |
| Animal |
3 |
4.6 |
More (26.7%) of the respondents with inadequate visual acuity in the better eye has had RTC compared to those with adequate visual acuity at 18.8%. There was a statistically significant association in the adequacy of visual acuity in the better eye and involvement in RTC [p=0.033]. There was no statistically significant association in the visual field and color vision of the respondents and involvement in RTC. [P = 0.113 and 0.981 respectively] (Table 4).
Table 4: Relationship between Visual Function and Involvement in Road Traffic Crash in the last 5 years.
| Visual function |
Involvement in Road Traffic Crash in the last 5 years |
| |
Yes (%) n=64 |
No (%) n=264 |
χ2 |
P |
| Visual Acuity in the Better eye |
| Adequate |
56 (18.8) |
242 (81.2) |
|
|
| Inadequate |
8 (26.7) |
22 (73.3) |
1.076 |
0.033 |
| Visual Acuity in the Second eye |
| Adequate |
53 (18.3) |
237 (81.7) |
|
|
| Inadequate |
11 (28.9) |
27 (71.1) |
2.436 |
0.119 |
| Visual field in the Right eye |
| Normal |
47 (17.8) |
217 (82.2) |
|
|
| Abnormal |
17 (26.6) |
47 (73.4) |
2.517 |
0.113 |
| Visual field in the Left eye |
| Normal |
48 (18.4) |
213 (81.6) |
|
|
| Abnormal |
16 (23.9) |
51 (76.1) |
1.023 |
0.312 |
| Colour vision |
| Normal |
58 (19.5) |
239 (80.5) |
|
|
| Abnormal |
6 (19.4) |
25 (80.6) |
0.001 |
0.981 |
Visual function assessment
Table 5 revealed that almost all the respondents 326 (99.4%) claimed to have good peripheral visual field. Majority of the respondents 320 (97.6%) claimed to have good vision detection ability. A large proportion (98.2%) claimed good ability to recognize road signs and see traffic light at least 6 metres away while driving.
Table 5: Respondents History of Visual function Impairment (N=328).
| Visual History |
Frequency |
Percentage(%) |
| Peripheral visual field perception |
| Yes |
326 |
99.4 |
| No |
2 |
0.6 |
| Distance vision detection ability |
| 6 metres |
320 |
97.6 |
| 3 metres |
7 |
2.1 |
| 1 metre |
1 |
0.3 |
| Distance vision recognition ability |
| 6 metres |
322 |
98.2 |
| 3 metres |
5 |
1.5 |
| 1 metre |
1 |
0.3 |
| Distance vision resolution ability |
| Rarely |
307 |
93.6 |
| Occasionally |
20 |
6.1 |
| Frequently |
1 |
0.3 |
| Glare Disturbance |
| Not at all |
229 |
69.8 |
| Barely |
74 |
22.6 |
| Usually |
21 |
6.4 |
| At all time |
4 |
1.2 |
Visual function examination revealed that majority of the respondents had adequate VA 298 (90.9%) and 290 (88.4%) in the better eye and second eye respectively (Figures 1 and 2)
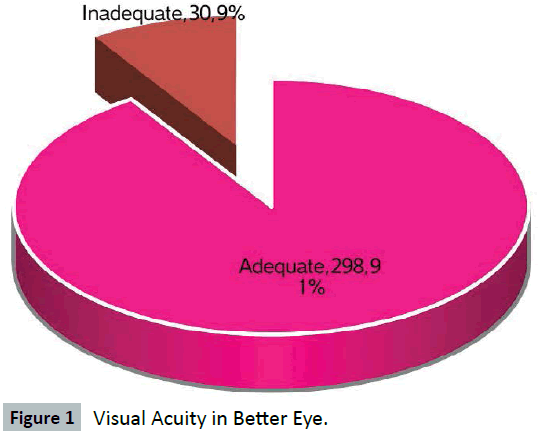
Figure 1: Visual Acuity in Better Eye.
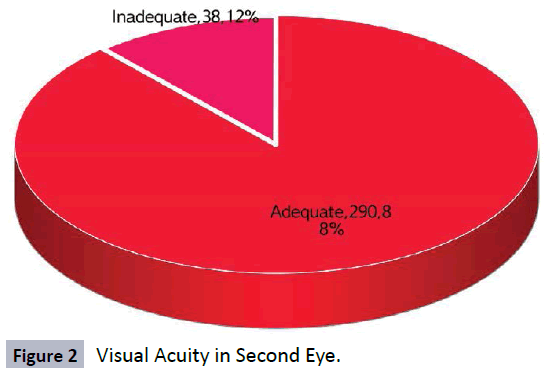
Figure 2: Visual Acuity in Second Eye.
As shown on Table 6, more than two-third of the respondents 264 (80.5%) had normal visual field. Majority of the respondents 297 (90.5%) had normal colour vision.
Table 6: Outcome of visual function tests among respondents.
| Variables |
Frequency(%) |
Frequency(%) |
| Visual acuity |
Better eye |
Second eye |
| Normal |
298 (91) |
290 (88) |
| Abnormal |
30 (09) |
38 (12) |
| Photostress recovery time |
Right eye |
Left eye |
| Normal |
299 (91.2) |
306 (93.3) |
| Abnormal |
29 (8.8) |
22 (6.7) |
| Visual field |
|
|
| Normal |
264 (80.5) |
261 (79.6) |
| Abnormal |
64 (19.5) |
67 (20.4) |
| Color vision |
Both eyes |
|
| Normal |
297 (90.5) |
|
| Abnormal |
31 (9.5) |
|
| External eye segment |
Right eye |
Left eye |
| Normal |
270 (82.3) |
262 (79.9) |
| Abnormal |
58 (17.7) |
66 (20.1) |
| Fundoscopy |
|
|
| Normal |
298 (90.9) |
303 (92.4) |
| Abnormal |
30 (9.1) |
25 (7.6) |
Eye examination
The external right and left eye segments of majority of the respondents 270 (82.3%) and 262 (79.9%) respectively were normal. The fundus of majority of the respondents 298 (90.9%) and 303 (92.4%) of the better eye and second eye respectively were normal (Table 6).
Uncorrected refractive error was highest in percentage (70.0%) in the better eye and 45.0% in the second eye) among the causes of visual function impairment detected (Table 7).
Table 7: Causes of Visual function Impairment.
| Variables |
Better eye (n=30) |
Second eye (n=20) |
| |
Frequency |
Percentage |
Frequency |
Percentage |
| Uncorrected Refractive error |
21 |
70.0 |
9 |
45.0 |
| Cataract |
1 |
3.3 |
3 |
15.0 |
| Glaucoma |
3 |
10.0 |
3 |
15.0 |
| Complications from Cataract Surgery |
3 |
10.0 |
1 |
5.0 |
| Macular Degeneration |
1 |
3.3 |
2 |
10.0 |
| Ocular Toxoplasmosis |
1 |
3.3 |
1 |
5.0 |
| Optic Atrophy |
0 |
0 |
1 |
5.0 |
Discussion
The study revealed that majority (63.7%) falls within the age group 40 - 59 years. This is similar to other studies done in Nigeria [7,10,11]. This could justify the fact that occupation such as commercial driving are usually done by adults who are active enough to hustle around for the demands of the job. Majority (44.2%) of the respondents had primary education, smaller proportion (22.3%) had secondary education, 6% had tertiary education and 9.8% had Quaranic education. As much as 17.1% had no formal education and this may affect their ability to read and interpret road signs. This finding was similar to a study done in Osun State, Nigeria by Oladehinde et al. [10] but not in agreement with a similar study done in Ilorin, Nigeria more than 5 years ago [7]. This reason could be related to the fact that the study in Ilorin was for commercial intercity drivers in Ilorin metropolis and most of them were indigenous people who usually engage in apprenticeship at an early age thereby losing the opportunity to engage in formal education.
A large proportion (73.3%) had no other occupation other than commercial driving. This could portray the relatively lucrative nature of commercial driving as an occupation. This emphasizes the importance of ensuring driving safety among them.
More than two-thirds (83.5%) of the drivers in this study passed through a driving test at first licensing but only a very few (27.7%) had their eyes tested at first licensing and much fewer (13.7%) during license renewal. This is a clear indication that some drivers with poor visual function may be certified as fit for driving even when they are deficient. This poses a very big risk to RTCs and demands the need to address this through an aggressive public awareness campaign, education and enforcement by concerned agencies.
The respondents’ past history of visual impairment revealed that majority (99.4%) of them have good peripheral visual field perception with good distance vision detection ability (97.6% at 6 meteres), good distance vision recognition ability (98.2% at 6 meters) and good distance vision resolution ability (93.6%).
Majority (90.9%) of the respondents in this study had adequate VA for driving based on FRSC VA standard for commercial driving in Nigeria [11,16-27]. The prevalence of visual function impairment of 9.1% found in this study was exactly the same with the findings of the study done by McMoli and Ogunmekan [28] with a definition of VA less than or equal to 6/9 in the better eye. This also compares favorably with the findings of a previous study in Ilorin in which same standard was used [7]. In another study by Nwosu, a prevalence of 3.1% was found with a definition of visual impairment as VA 6/18 or less in the better eye [11].
Visual acuity better or equal to 6/9 in the better eye and 6/24 in the second eye is the only parameter currently recommended for measurement by FRSC in Nigeria before issuance of license [10]. This rule is applied but in very rare occasions. Licenses are being issued locally in most instances without any measure of VA [11].
Research to date, showed that there is an association between visual acuity and involvement in RTC, though claimed to be a weak association [22]. One important consideration in this regard is that visual acuity-related driving performance decrements do not translate into reduced safety. This therefore implies that visual acuity-related driving skills such as sign recognition may not be crucial to the safe operation of a vehicle. Reading signage may be important for route planning or maintaining regulatory compliance with the “rules of the road”, but it may not be critical for crash avoidance [1]. Visual acuity tests were originally designed for the clinical diagnosis and monitoring of eye disease, and do not by themselves reflect the visual complexity of the driving task. Driving a vehicle along a roadway and through intersections involves the simultaneous use of central and peripheral vision and requires monitoring of primary and secondary tasks, all in the midst of a visually cluttered environment where critical events occur with little or no advance warning [1]. Visual acuity tests do not generally include these stimulus features, and in fact seek to minimize distractions and secondary task demands. Acuity is typically evaluated under high contrast and luminance conditions, whereas driving encompasses wide ranging contrast and luminance levels. Another consideration is the fact that stationary visual acuity test targets do not represent the motionbased driving environment. There are other factors that must be considered when rectifying the seemingly illogical conclusion that visual acuity, the widespread measure for granting driving privileges, is not or is weakly associated with involvement in RTC [1]. One such factor is directly related to state licensing restrictions by ensuring that drivers with severe visual acuity impairment are out of the road. This would be particularly feasible in states that require vision re-screening at the time of license renewal. Another factor is the fact that drivers with vision impairment may voluntarily restrict or stop driving. A population-based cohort study in Maryland reported that reduced visual acuity was associated with reduced mileage and cessation of driving in unfamiliar places [23]. Results from the same study failed to observe an association between visual acuity impairment and overall driving cessation after adjustment for contrast sensitivity and visual field impairment, both of which showed significant associations [24]. These seemingly contradictory results point to the fact that while visual acuity may be associated with modifications in driving habits, it may play less of a role when ultimately deciding to stop driving altogether.
A continuous horizontal binocular visual field of 140° or more and 20° continuous above and below fixation in both eyes is recommended for Nigerian drivers before issuance of drivers’ license [16]. As important as this parameter is, it is yet to be incorporated as part of routine test before issuance of license. In a study by Emem et al., there was no statistically significant association between RTC and visual acuity but there was statistically significant association between RTC and visual field defect (P=0.037) [29]. This study reported no significant association (P> 0.05). Nwosu [11] in Nigeria, reported a prevalence of 3.9% visual field defect amongst drivers in Ibadan, but found no significant association with RTC. Okafor [30] and Effiong [31] also found no significant association between RTC and visual field defect in their studies. Some works done outside Nigeria however found significant association between visual field defect and RTC [32,33]. The difference in observation could not be explained based on the type of tools used for the test. In the other studies reported in Nigeria, the confrontational method was used which is same with this study except the study of Oladehinde et al. [10]. that employed the use of automated perimeter (more sensitive) like most of the works done outside the country [32,33]. Visual field testing with automated perimeter stands out as a limitation in this study. Availability of it for comparison with confrontation method finding may have explained the reason for the different conclusions by other studies. If the examination of visual field is to be effectively incorporated into the visual requirement for driving, then appropriate instrument must be made available with trained personnel to operate the equipment.
Visual field testing is used by many states for licensing purposes and like visual acuity, the specific visual field requirements are highly variable and the rationale for one requirement over another is often not clear. For example, in Arizona, the field of vision must be 60 degrees, plus 35 degrees on the opposite side of the nose in at least one eye. The field of vision for Connecticut drivers must be 140 degrees for a person with two eyes, and 100 degrees for a person with one eye [1].
The first large-scale population-based assessment of visual field impairment and driver safety was conducted by Johnson and Keltner [33]. They reported that drivers with severe binocular field loss had significantly higher RTC rates compared to those without any loss. This study is noteworthy for its large sample size (10,000 drivers) and the use of mileage-based RTC rates. This finding is in contrast to other studies that have reported elevated rates for those with such impairments [25-27]. In the case of Rubin et al., as with Johnson and Keltner [27,33], the association was specific to those with binocular field loss. McGwin et al., observed that the association was stronger when considering the extent of impairment in the worse eye [25]. Haymes et al., observed that among glaucoma patients, those with visual field impairment in the worse eye had a nearly five-fold increase in RTC though this association was not statistically significant [26]. This highlights an important consideration in comparing results across studies.
In this study, there were no significant association between visual field defect, color vision defect and involvement in RTC. Defective color vision is not a barrier to driving commercial vehicles in Nigeria and in most countries of the world [11]. However, color vision defects may lead to RTC especially if they cause confusion in identifying traffic lights [34]. No standard currently exists in Nigeria for color vision before issuance of driving license [1].
According to the WHO definition of visual impairment as VA 6/18 or less in the better eye [14], the prevalence of visual function impairment in this study is 4.8% and this compares favorably with the study of Nwosu [11]. This study revealed uncorrected refractive error as the main cause of visual impairment and this is similar to a study in Uyo, Nigeria [29]. In a study by Vitale et al., in the United States, 1190 study participants had visual impairment (weighted prevalence, 6.4%; 95% confidence interval [CI], 6.0%- 6.8%), and of these, 83.3% could achieve good visual acuity with correction (95% CI, 80.9%-85.8%) [20]. This agrees with the evidence that visual function impairment due to uncorrected refractive error is a common condition.
Conclusion
Remarkable percentage of commercial drivers studied met with the criteria for adequate visual acuity required for driving in Nigeria. A significant association was found to exist between visual acuity and involvement in road traffic crash. No significant association was found between visual field defect, abnormal color vision and involvement in road traffic crash.
Many studies have indicated that visual acuity is, at best, very weakly linked to road traffic crash involvement and thus is a poor screening test for identifying drivers who are at-risk for future crash involvement. In contrast, it is clear that visual acuity is related to certain aspects of driving performance such as road sign recognition.
This study was based on respondents’ self-reported road traffic crash involvement. There is currently no state report on RTC in relation to or traceable to individual licensed drivers as obtainable in some civilized countries across the globe. However, the available record from the state for the year 2010 to 2013 revealed a progressive increase in the prevalence of RTC.
With respect to research focused on driving safety (i.e. road traffic crash involvement), there is a need to adopt study designs and to develop screening tests that can be more readily translated into licensing policies. Based on these, it is necessary to implement a mandatory eye test for potential applicants for driving license especially commercial drivers. This to an extent will contribute greatly in reducing the frequency of RTCs on the roads. A strong collaboration between the FRSC, health sector and commercial drivers regulatory bodies is therefore indispensable in ensuring proper screening before issuance of driving license both at first time and during renewals.
7427
References
- Aderamo AJ (2010) Transport in Nigeria. The case of Kwara State. African Econ Bus Rev 8: 19-40
- Owsley C, McGwin G Jr (2010) Vision and driving.Vision Res 50: 2348-2361.
- Davison PA (1985) Inter-relationships between British drivers' visual abilities, age and road accident histories.Ophthalmic Physiol Opt 5: 195-204.
- Hedin A (1993) How important are visual deficiencies in driving? J Traffic Med.21:254–265.
- Silveira S, Jolly N, Heard R, Clunas NJ, Kay L (2007) Current licensing authority standards for peripheral visual field and safe on-road senior aged automobile driving performance.Clin Experiment Ophthalmol 35: 612-620.
- Adekoya BJ, Owoeye JF, Adepoju FG, Ajaiyeoba AI (2009) Visual function survey of commercial intercity vehicle drivers in Ilorin, Nigeria.Can J Ophthalmol 44: 261-264.
- Ovenseri-Ogomo G, Adofo M (2011) Poor vision, refractive errors and barriers to treatment among commercial vehicle drivers in the Cape Coast municipality.Afr Health Sci 11: 97-102.
- Ivers RQ, Mitchell P, Cumming RG (1999) Sensory impairment and driving: the Blue Mountains Eye Study.Am J Public Health 89: 85-87.
- Oladehinde MK, Adeoye AO, Adegbehingbe BO, Onakoya AO (2007) Visual functions of commercial drivers in relation to road accidents in Nigeria.Indian J Occup Environ Med 11: 71-75.
- Nwosu SN (1999) Visual impairment and road traffic accident in Nigerian professional drivers. Orient J Med 3:110–112.
- Humphriss D (1987) Three South African studies on the relation between road accidents and drivers' vision.Ophthalmic Physiol Opt 7: 73-79.
- Mohan D1 (2003) Road traffic injuries--a neglected pandemic.Bull World Health Organ 81: 684-685.
- World Health Organisation, author (2004) World report on road traffic injury prevention. Geneva, Switzerland: WHO.
- Peden M, Scurfield R, Sleet D, Mohan D, Hyder AA (2004) World report on road traffic injury prevention: Summary. Geneva. Switzerland: WHO.
- Chidoka OB (2012) Activating the United Nation`s Decade of Action on Road Safety in Nigeria. (2011-2020).
- Silveira S, Jolly N, Heard R, Clunas NJ, Kay L (2007) Current licensing authority standards for peripheral visual field and safe on-road senior aged automobile driving performance.Clin Experiment Ophthalmol 35: 612-620.
- Rubin GS, Ng ES, Bandeen-Roche K, Keyl PM, Freeman EE, et al. (2007) A prospective, population based study of the role of visual impairment in motor vehicle crashes among older drivers: the SEE study. Invest Opthalmol Vis Sci48:1483-1491.
- Vitale S, Cotch MF, Sperduto RD (2006) Prevalence of visual impairment in the United States.JAMA 295: 2158-2163.
- Owsley C, McGwin G Jr (1999) Vision impairment and driving.Surv Ophthalmol 43: 535-550.
- Charman WN (1985) Visual standards for driving.Ophthalmic Physiol Opt 5: 211-220.
- Freeman EE, Muñoz B, Turano KA, West SK (2006) Measures of visual function and their association with driving modification in older adults.Invest Ophthalmol Vis Sci 47: 514-520.
- Freeman EE, Muñoz B, Turano KA, West SK (2005) Measures of visual function and time to driving cessation in older adults.Optom Vis Sci 82: 765-773.
- Haymes SA, Leblanc RP, Nicolela MT, Chiasson LA, Chauhan BC (2007) Risk of falls and motor vehicle collisions in glaucoma.Invest Ophthalmol Vis Sci 48: 1149-1155.
- McGwin G Jr, Xie A, Mays A, Joiner W, DeCarlo DK, et al. (2005) Visual field defects and the risk of motor vehicle collisions among patients with glaucoma.Invest Ophthalmol Vis Sci 46: 4437-4441.
- Rubin GS, Ng ES, Bandeen-Roche K, Keyl PM, Freeman EE, et al. (2007) A prospective, population-based study of the role of visual impairment in motor vehicle crashes among older drivers: the SEE study.Invest Ophthalmol Vis Sci 48: 1483-1491.
- McMoli TE, Ogunmekan IO (1983) Road traffic accidents in Nigeria - Observation on Controllable Human Factor in Lagos. Afr Ann Med.1:30–33
- Emem GA, Udechukwu FE, Rich EU, Uwemedimbuk E (2010) Causes of visual impairment among commercial motor vehicle drivers OJM Vol 1-4: 34-41
- Okafor CF (1992) Visual status of Nig. Police force drivers. Dissertation submitted to National Postgraduate Medical College of Nigeria.:35–9.
- Effiong B (1993) Visual Status of Taxi Park Drivers in Enugu. Dissertation Submitted to National Postgraduate Medical College of Nigeria. :41–6.
- Cashell GT (1966) Visual functions in relation to road accidents.Trans Ophthalmol Soc U K 86: 617-626.
- Johnson CA, Keltner JL (1983) Incidence of visual field loss in 20,000 eyes and its relationship to driving performance.Arch Ophthalmol 101: 371-375.
- Atchison DA, Pedersen CA, Dain SJ, Wood JM (2003) Traffic signal color recognition is a problem for both protan and deutan color-vision deficients.Hum Factors 45: 495-503.

