Rashidah Ambak1*, Leni Tupang2, Mohd Hazrin Hasim2, Natifah Che Salleh3, Norlida Zulkafly4, Ruhaya Salleh2, Mohamad Hasnan Ahmad2 and Balkish Mahadir Naidu5
1Centre for Nutrition Epidemiology Research, Institute for Public Health, Ministry of Health Malaysia, Jalan Bangsar, Kuala Lumpur, Malaysia
2Institute for Public Health, Ministry of Health Malaysia, Jalan Bangsar, Kuala Lumpur, Malaysia
3Oral Health Division, Ministry of Health Malaysia, Putrajaya, Malaysia
4Nutrition Division, Ministry of Health Malaysia, Putrajaya, Malaysia
5Department of Statistics Malaysia, Federal Government Administrative Centre, Putrajaya, Malaysia
*Corresponding Author:
Rashidah Ambak
Centre for Nutrition Epidemiology Research
Institute for Public Health
Ministry of Health Malaysia, Jalan Bangsar
50590 Kuala Lumpur, Malaysia
Tel: +603-22979572
Fax: +603-22823114
E-mail: rashidaha@moh.gov.my, rashidah662009@gmail.com
Received Date: 15 December 2017; Accepted Date: 31 January 2018; Published Date: 07 February 2018
Citation: Ambak R, Tupang L, Hasim MH, Salleh NC, Zulkafly N, et al. (2018) Who Do Not Read and Understand Food Label in Malaysia? Findings from a Population Study. Health Sci J. Vol. 12 No. 1: 548.
Copyright: © 2018 Ambak R, et al. This is an open-access article distributed under the terms of the creative Commons attribution License, which permits unrestricted use, distribution and reproduction in any medium, provided the original author and source are credited.
Keywords
Food label; Label read; Nutrient information; Malaysian adult nutrition survey 2014
Introduction
Reading the food label is vital to help us choose healthier foods. Food labelling includes any written, printed or graphic matter that is present on the label, accompanies the food, or is displayed near the food, including that for the purpose of promoting its sale. Food labels carry different types of information and the main things to look at are the nutrition information panel. It offers the easiest way to choose foods with less saturated fat, salt (sodium), added sugars, calories, and more fibre. Reading food labels takes some practice to do it and knowing what we are looking for is greatly important. The Third National Health and Morbidity Survey 2006 (NHMS 2006) reported a substantial proportion (19.3%) of Malaysian adults aged 18 years and above for not reading the nutritional label [1]. Studies showed that factors related to consumers not reading and using food labelling information in purchasing food were due to low awareness on importance of food labelling, difficulty in understanding the label information, and low health consciousness [2-4]. With respect to education level, The NHMS 2006 reported that those with tertiary education level (74.5%) were more likely to read the nutritional information that reflected their health concern and ability to understand terminology used in the food label [1].
Malaysian consumer was becoming more aware of their dietary intake, hence nutritional information on the nutritional value of a food helps consumers to make healthier food choices and achieve overall good health. A study conducted among the elderly population shown that its use was significantly associated with age, formal education, higher household income levels and marital status [5]. Comprehension of food labels can be important for the population, including those with chronic illness, to help them follow dietary recommendations. A survey among the Malaysian obese adult population revealed that as high as 75.3% of the population understand the food label and significantly associated with age, race, education and marital status [6]. Studies reported the most common reasons for reading labels were to find a product's expiration date and price [7,8].
Food labelling is an important tool of communication between consumers and food manufacture. According to Drichoutis et al. various factors, ranging from demographic to attitudinal and product related, affect food label use [4]. Hence, this study shall provide insights in terms of consumers' ability to read and understand information on a food label. We will also explore on the types of information read in the food label.
Materials and Methods
Study design and sampling
This publication is part of the Malaysian Adult Nutrition Survey, a nationwide cross-sectional survey. Target population was respondents aged 18 to 59 years old, who stayed in noninstitutionalized living quarters for at least two weeks from data collection day. A total of 4044 living quarters was sampled and proportionately allocated to all states and federal territories in Malaysia, based on their population densities. A multistage stratified cluster sampling of the living quarters was applied following from a primary sampling unit, living quarter, eligible respondents and a sampled person. Respondents on a specific diet due to illness or religious, postpartum, and with communication barrier due to disability were excluded from the survey. If there was more than one respondent eligible, a modified Kish Method was used to select a respondent [9].
Data collection
Data collection was conducted from March to May 2014. Data collectors of nutritionists, field supervisors and research assistants were trained before commencement of the data collection. They explained on the study background and obtained informed consent from the respondents prior to conducting the interview. Questionnaires on sociodemography (socio-demographic characteristics as gender, age, ethnicity, marital status, occupation, monthly income, educational attainment, residential area and nutritional status) and food label were pre-tested before finalizing and interviewing the respondents.
Food label information on reading and understanding was gathered based on the previous National Health and Morbidity Survey questionnaire [10]. It was slightly adapted to include information on reading the precautionary statement. The questionnaire was administered to provide information on whether the respondents read the label, what types of nutrition label being read, reading of expiry dates and precautionary label, and did they understand the label. Respondents who answered “yes, always” and “yes, sometimes” were defined as read labels and understand food labels.
Nutritional status was determined using body mass index. Body weight was measured in light indoor clothing without shoes using Tanita weight scale (TANITA 318, Japan). Height was measured without shoes using a SECA portable meter (SECA 206, Germany). All measurements were taken twice and the mean value was used for data analysis. Body mass index (BMI) was calculated as weight (kg) divided by the square of the height in meters (kg/m2). BMI classification was referred as underweight (<18.5 kg/m2), normal weight (18.5 – 24.9 kg/ m2), overweight (25.0 – 29.9 kg/m2) and obese (30.0 – 34.9 kg/m2) WHO [10].
The Malaysian Adult Nutrition Survey 2014 was accomplished with budget support from the Ministry of Health Malaysia. Ethical clearance was authorized by the Medical Research and Ethics Committee, Ministry of Health.
Statistical analysis
Statistical analysis was performed using IBM SPSS Statistics version 20. The findings were reported as weighted prevalence estimates (mean and 95% confidence interval). The association between socio-demographic variables (age, gender, race, education, marital status, residence and nutritional status) were determined using multiple logistic regression analysis. The estimate was presented as odds ratio (OR), applying a 95% confidence interval (95% CI).
Results
Out of 4044 respondents sampled, the study team managed to interview 3000 respondents on the food label module (74.0% response rate). The majority consisted of 56.4% of the urban, 59.0% female, 52.7% Malay, 31.6% aged 30 – 39 years old, 49.8% secondary school attainers, 71.5% married, 77.2% working and 41.2% with normal weight (Table 1).
Table 1 Responses on reading and understanding of food label according to socio-demographic characteristic and nutritional status.
| Characteristics |
Total response |
Estimated population |
Read label
(Always and Sometimes) |
Total response |
Estimated population |
Understand label(Always and Sometimes) |
| |
Prevalence (%) |
95% CIa |
|
Prevalence (%) |
95% CIa |
| Lower |
Upper |
Lower |
Upper |
| Malaysia |
1283 |
8744476 |
45.0 |
42.1 |
47.9 |
1108 |
8E+06 |
89.5 |
87.0 |
91.5 |
| Strata |
| Urban |
724 |
6349219 |
47.2 |
43.3 |
51.1 |
639 |
6E+06 |
90.7 |
87.5 |
93.1 |
| Rural |
559 |
2395257 |
40.2 |
36.8 |
43.8 |
469 |
2E+06 |
86.2 |
82.6 |
89.2 |
| Gender |
| Male |
526 |
4090712 |
40.4 |
36.7 |
44.2 |
441 |
4E+06 |
88.9 |
85.3 |
91.7 |
| Female |
757 |
4653764 |
50.1 |
46.7 |
53.4 |
667 |
4E+06 |
90.0 |
86.9 |
92.4 |
| Age (year) |
| 18 – 29 |
379 |
3029300 |
47.0 |
42.3 |
51.7 |
337 |
3E+06 |
91.6 |
87.7 |
94.4 |
| 30 – 39 |
405 |
2361479 |
49.2 |
44.6 |
53.9 |
348 |
2E+06 |
89.0 |
84.8 |
92.1 |
| 40 – 49 |
299 |
2026636 |
44.2 |
39.5 |
49.0 |
257 |
2E+06 |
88.7 |
83.8 |
92.3 |
| 50 – 59 |
200 |
1327061 |
37.0 |
31.3 |
43.1 |
166 |
1E+06 |
86.4 |
79 |
91.5 |
| Ethnicity |
| Malay |
676 |
4985655 |
47.6 |
43.9 |
51.2 |
577 |
4E+06 |
88.5 |
84.7 |
91.5 |
| Chinese |
202 |
1554980 |
41.0 |
35.3 |
47.0 |
182 |
1E+06 |
93.2 |
88.5 |
96.1 |
| Other |
405 |
2203841 |
42.8 |
38.1 |
47.7 |
349 |
2E+06 |
88.9 |
84.9 |
92 |
| Education |
| Primary and below |
163 |
933859 |
26.3 |
22.1 |
30.9 |
121 |
690870 |
74.5 |
64.9 |
82.2 |
| Secondary |
639 |
4365235 |
45.0 |
41.1 |
49.0 |
556 |
4E+06 |
90.7 |
87.8 |
92.9 |
| Tertiary |
453 |
3323293 |
60.1 |
55.4 |
64.6 |
408 |
3E+06 |
92.2 |
88.4 |
94.8 |
| Marital status |
| Married |
917 |
6199343 |
47.4 |
44.1 |
50.6 |
790 |
5E+06 |
89 |
86.2 |
91.3 |
| Not married / divorcee / widow/widowee |
364 |
2528132 |
40.0 |
35.5 |
44.7 |
316 |
2E+06 |
90.5 |
86.9 |
93.2 |
| Work status |
|
|
|
|
|
|
|
|
|
|
| Workingb |
983 |
6949637 |
45.6 |
42.2 |
49.0 |
839 |
6E+06 |
89.1 |
86.6 |
91.2 |
| Not workingc |
291 |
1750406 |
43.5 |
38.5 |
48.7 |
261 |
2E+06 |
90.7 |
85.7 |
94.1 |
| Nutritional Statusd |
| Underweight |
63 |
500337 |
42.2 |
31.7 |
53.5 |
54.0 |
455226 |
94.2 |
86 |
97.8 |
| Normal |
510 |
3413628 |
42.2 |
38.2 |
46.4 |
437 |
3E+06 |
89.6 |
86.2 |
92.2 |
| Overweight |
413 |
2875445 |
47.1 |
42.8 |
51.5 |
352 |
2E+06 |
88.2 |
84.3 |
91.2 |
| Obese |
253 |
1638609 |
47.1 |
41.9 |
52.3 |
229 |
1E+06 |
90.7 |
83.7 |
94.8 |
aCI=Cinfidence Interval
bWorking is defined as government staffs, semi-government staffs, private companiesor self-employed
cNot working is defined as not working, retiree or students
dNutritional status refers to WHO Guideline (1998)
Reading label
A total of 1283 respondents answered that they read the food label (45.0%). About 56.0% urbanites read the label, and lesser among the rural population (43.6%). Males significantly did not read label (41.0%) compared to females (59.0%). There was no significant difference in the prevalence of reading labels in other socio-demographic criteria studied (Table 1).
According to the multiple logistic regression analysis (Table 2), gender, education level and marital status were significantly associated with not reading the label. Males were 1.52 times more likely not to read labels. The primary school and below education attainers were 4.62 times more likely not to read labels, followed by the secondary school education attainers 2.04 times, when adjusted to the tertiary education attainers. Those who were single (not married/divorced/widow/ widower) were 1.35 times more likely not to read labels.
Table 2 Estimated crude and adjusted odds ratio for not reading and not understanding of food label (FL).
| Variables |
Not reading FLs |
Not understanding FLs |
| Crude OR (95%CI) |
p-value |
Adjusted OR (95%CI) |
p-valuea |
Crude OR (95%CI) |
p-value |
Adjusted OR (95%CI) |
p-valuea |
| Strata |
| Urban |
1 |
|
1 |
|
1 |
|
1 |
|
| Rural |
1.29 (1.12,1.49) |
0.001 |
1.05 (0.89,1.25) |
0.565 |
1.47 (1.05,2.07) |
0.025 |
1.21 (0.82,1.77) |
0.333 |
| Gender |
| Male |
1.46 (1.26,1.69) |
0.001 |
1.52 (1.28,1.80) |
0.001 |
1.51 (1.08,2.12) |
0.016 |
1.38 (0.94,2.03) |
0.098 |
| Female |
1 |
|
1 |
|
1 |
|
1 |
|
| Age (year) |
| 18 – 29 |
1 |
|
1 |
|
1 |
|
1 |
|
| 30 – 39 |
0.91 (0.75,1.11) |
0.34 |
0.94 (0.75, 1.19) |
0.629 |
1.14 (0.73, 1.80) |
0.564 |
1.22 (0.73, 2.06) |
0.449 |
| 40 – 49 |
1.32 (1.08,1.62) |
0.006 |
1.18 (0.93, 1.52) |
0.174 |
1.28 (0.79, 2.06) |
0.312 |
1.25 (0.71, 2.19) |
0.446 |
| 50 – 59 |
1.69 (1.35,2.09) |
0.001 |
1.23 (0.93, 1.61) |
0.144 |
1.61 (0.97, 2.68) |
0.064 |
1.49 (0.81, 2.73) |
0.203 |
| Race |
| Malay |
1 |
|
1 |
|
1 |
|
1 |
|
| Chinese |
1.32 (1.07,1.61) |
0.009 |
1.26 (1.00, 1.59) |
0.054 |
0.64 (0.37, 1.11) |
0.112 |
0.66 (0.36, 1.20) |
0.173 |
| Other |
1.23 (1.05,1.45) |
0.012 |
0.83 (0.69, 1.00) |
0.053 |
1.04 (0.72, 1.51) |
0.822 |
0.80 (0.53, 1.20) |
0.277 |
| Education |
| Primary and below |
4.37 (3.47,5.51) |
0.001 |
4.62 (3.55, 6.00) |
0.001 |
3.55 (2.18, 5.78) |
0.001 |
4.00 (2.31, 6.93) |
0.001 |
| Secondary |
1.98 (1.66,2.38) |
0.001 |
2.04 (1.68, 2.47) |
0.001 |
1.37 (0.91, 2.08) |
0.135 |
1.48 (0.95, 2.30) |
0.083 |
| Tertiary |
1 |
|
1 |
|
1 |
|
1 |
|
| Marital status |
| Married |
1 |
|
1 |
|
1 |
|
1 |
|
| Not married /divorcee / widow/widower |
1.25 (1.07,1.46) |
0.006 |
1.35 (1.10, 1.64) |
0.003 |
0.97 (0.67, 1.41 |
0.867 |
1.11 (0.71, 1.74) |
0.64 |
| Work status |
| Workingb |
0.99 (0.83,1.18) |
0.919 |
0.95 (0.77, 1.17) |
0.613 |
0.72 (0.47, 1.11) |
0.137 |
0.58 (0.34, 0.97) |
0.039 |
| Not workingc |
1 |
|
1 |
|
1 |
|
1 |
|
| Nutritional Statusd |
| Underweight |
1.09 (0.77,1.52) |
0.637 |
1.04 (0.72, 1.49) |
0.852 |
0.74 (0.30, 1.78) |
0.495 |
0.96 (0.39, 2.38) |
0.924 |
| Normal |
1 |
|
1 |
|
1 |
|
1 |
|
| Overweight |
0.90 (0.76,1.07) |
0.24 |
0.87 (0.72, 1.05) |
0.133 |
1.02 (0.69, 1.49) |
0.937 |
1.05 (0.69, 1.58) |
0.83 |
| Obese |
0.79 (0.65,0.97) |
0.024 |
0.83 (0.67, 1.04) |
0.105 |
0.61 (0.36, 1.02) |
0.058 |
0.65 (0.37, 1.11) |
0.113 |
ap-value significant at <0.05
bWorking is defined as government staffs, semi-government staffs, private companies or self-employed
cNot working is defined as not working, retiree or students
dNutritional status refers to WHO Guideline (1998)
Understanding label
Overall, among those who reported reading labels, 89.5% of them claimed that they understood the information that they read. Those with tertiary and secondary education significantly understood label more than the primary and below education achievers. There was no significant difference in understanding the label of other socio-demographic variables studied (Table 1).
Multiple logistic regression analysis showed that not understanding the label was associated with working status and education level. Working respondents were less likely not to understand the label by 0.58 times when adjusted to the non-working respondents. The respondents who completed primary school or below were more likely not to understand label by 4.00 times, when adjusted to the tertiary education achievers (Figure 1).
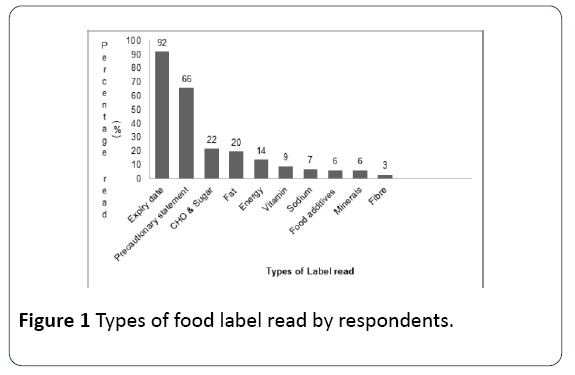
Figure 1: Types of food label read by respondents.
Types of label
Figure 1 shows the prevalence in reading by types of label. Most of the respondents focused to read expiry date (91.8%), followed by a precautionary statement (65.9%). Respondents did not put attention to read essential information related to health, such as macro and micronutrients of carbohydrate/ sugar (21.5%), fat (19.9%) and total energy (14.4%). Less than 10% of the respondent read information on vitamin, sodium, food additives, minerals and fibre.
Discussion
Reading label
This study highlighted that Malaysian adults scored a low prevalence in reading the food label, compared to other population studies. Only 4 out of 10 Malaysian adults reported to read labels, while other population studies dictated a higher reading as 52% in the UK [11], 65% in Irish [12] and 80% in the USA [13]. However, Turkey reported an averagely lower rate of reading food label of 15% [14]. A bigger scale of population study in Malaysia (NHMS) targeted respondents aged 18 years and above found that food label reading was significantly associated with Malays, tertiary education achievers, single respondents, and employed [15]. NHMS 2006 also concluded that female and tertiary academic achievers significantly read the food label [15]. In contrast, the present study found that single respondents was significantly associated with not reading food label. Another study reported no significant difference between male and female in reading the food labels [16].
This study presents that males were less likely to report reading food labels compared to females, as reported elsewhere [17,18]. A sub-analysis of the NHMS 2006 reported a higher rate of reading food label among the Malaysia obese male [19]. This might be contributed by their knowledge and nutrition education they received from healthcare personnel at the clinics or hospital when seeking treatment. The motivation to reduce weight and to decrease the risk of obesity also drive them to seek information from the food label. Another study also highlighted on the food label awareness among those who were diagnosed with chronic diseases [20]. They usually were more aware on the nutrient guidelines and dietary guidelines, as compared to healthy individuals with the motivation to control their disease. But in general, healthy males ignore the importance of food label information towards health, perceived reading food label as time consuming, do not understand the food label information and complaint on the small printed labels [21].
Respondents with lower educational level were more likely not to read food labels, as highlighted in most studies. This could be due to the less educated respondents were not familiar with the terminology used and need some form of mathematical calculation to interpret the nutrient requirement and intake [22]. In contrast, higher education achievements gained health and nutrition knowledge from academic experiences and reading exposures. Hence, they had the intellectual capability to read and understand food label information. Consequently, they significantly reported to read labels compared to their counterpart [23,24].
Those who were single did not pay attention to read food labels compared to their married counterpart. This finding is in contrast to the NHMS 2006 finding, which single respondents were more likely to read food labels [16]. The difference in findings may be due to the definition of ‘single’ status in the NHMS 2006 as ‘not married’, while MANS 2014 has grouped ‘single’ as a combination of not married, divorced, widow and widower due to analysis purpose (small sample size).
Food label understanding
Only 10% of the Malaysian adults who read label reported not likely to understand the food label information. The figure should be interpreted with caution, as this survey implemented a self-reporting feedback. We did not objectively measure the real understanding of food label at the point of purchasing. The prevalence was based on the respondent’s interpretation of their label reading experience, and prone to over-reporting. Those who were jobless, and primary school leavers and below were significantly associated with not understanding the food label information. A smaller study conducted in Malaysia studying the understanding of the Malaysian Dietary Guideline found that the understanding score was 60%, lower compared to the present prevalence [25]. Another study on understandable assessment of the current nutrient label format among females in the Klang Valley (an urban area in Malaysia) revealed a good level of understanding. Half of the respondents were able to extract and understand the nutrient information label [26].
This study highlighted that non-working respondents and those completed primary school or below did not understand the information on the food label. Non-working respondents are generally associated with lower academic achievement and low income. Most studies reported a similar low understanding of food label in those groups. Difficulty in understanding the terms, interpreting and perform some calculations on the nutrient requirement hinders them from reading the food label [27].
By types of label information, expiry date was the most popular information read, followed by the precautionary statement. This is a common finding as presented in other studies [2,28,29]. Reading the expiry date will only provide information on the safety of food but does not guide respondents in choosing a healthier food or drinks. Some possible causes for this situation are the lack of knowledge on the technical terms and negligence of certain nutrient information that they perceive as not important to their health [24].
Generally, consumers read labels in order to avoid ‘negative’ nutrients in packaged food. This situation was shown among the European consumers who looked in detail for fat, calories, protein, cholesterol and carbohydrate information before purchasing packaged foods [2,28,29]. While in Malaysia, macronutrients of total energy, fat and carbohydrate information was the least common label being read by the respondents, followed by vitamins and minerals. Hence, the information was not used by the respondents in aiding them to correctly select the right food.
As this is a self-reported study, which did not involve a real situation of reading nutrition labels during purchase, it may not represent the real situation of reading labels among the Malaysian population. The level of nutrition knowledge and competence in understanding information were not assessed. Thus, the results might show high scores in understanding compared to the actual capacity of the respondents. Hence, it may not represent the real figures of understanding labels among the population.
Conclusion
We found that most of the Malaysian adults reported to read the food label and they claimed to understand the label information. Respondents who were male, lower academic achievement (primary and secondary school leavers) and single were significantly less likely to read food label information. Primary school leavers and jobless respondents significantly reported did not understand the food label information that they read. Those who read food labels mostly targeted expiry date and precautionary statement information, and showed not much interest to read nutrient information on the label. There was no significant association of other sociodemographic characteristics with reading and understanding of the food label. By identifying the target groups as above, it will assist the stakeholders and policy makers in designing interventions to those groups. Future studies should focus to observational study approach in order to determine the actual readers, level and problems in understanding the food label.
Acknowledgement
The authors would like to extend their grateful thanks to the Director General of Health, Ministry of Health, Malaysia for permission to publish this paper. The authors would also like to thank the MANS 2014 research team members who were involved in the planning and commencing of this study, the State Health Directors and Liaison Officers who organized resources during the data collection phase, data collectors of field supervisors, nutritionists, temporary staff and respondents who had participated and contributed their time and information to the survey.
Conflict of Interest
The authors declare no conflict of interest.
22001
References
- Institute for Public Health (2008) The Third National Health and Morbidity Survey (NHMS III) 2006. Ministry of Health Malaysia, Kuala Lumpur, Malaysia.
- Grunert KG, Wills JM, Fernández-Celemín L (2010) Nutrition knowledge, and use and understanding of nutrition information on food labels among consumers in the UK. Appetite55: 177-189.
- Drichoutis A, Lazaridis P, Nayga R (2006) Consumers' use of nutritional lables: A review of research studies and issues. Acad Mark Sci Rev 10: 9.
- Annunziata A, Vecchio R (2012) Factors affecting use and understanding of nutrition information on food labels: Evidences from consumers. Agric Econ Rev 13: 103-116.
- Cheong SM, Kaur J, Lim KH, Ho BK, Mohmad S (2013) Use and understanding of nutrition labeling among elderly men and women in Malaysia. Malay J Nutr 3: 353-362.
- Rashidah A, Balkish MN, Mohd-Azahadi O, Nor-Azian MZ, Syafinaz MS, et al. (2014) Food label reading and understanding among obese adults: A population study in Malaysia. Int J Public Health Res 4: 449-456.
- Chung EJ, Jeon JS, Ahn HS (2010) Reading and understanding of food and nutrition labels and dietary behaviors of female middle and high school students. J Korean Diet Assoc 16: 239-254.
- Chopera P, Chagwena DT, Mushonga NGT (20014) Food label reading and understanding in parts of rural and urban Zimbabwe. Afr Health Sci 14: 576-584.
- World Health Organization (1988) Obesity: preventing and managing a global epidemic, report of a WHO Consultant on obesity, WHO Technical Series Report No. 894, Geneva, Switzerland.
- Kellogg’s (2004) Quantitative research to identify the best on-pack option for communicating GDA information.
- Safefood (2004) Safetrak3-consumer tracking research October 2004. Safefood, Cork.
- Chen X, Jahns L, Gittelsohn J, Wang Y (2012) Who is missing the message? Targeting strategies to increase food label use among US adults. Public Health Nutr 15: 760-772.
- Gezmen-Karadağ M, Türközü D (2017) Consumers’ opinions and use of food labels, nutrition and health claims: Results from Turkey. J Food Prod Mark29: 1-17.
- Cheah YK, Moy FM, Loh DA (2015) Socio-demographic and lifestyle factors associated with nutrition label use among Malaysian adults. Brit Food J 117: 2777-2787.
- Nayga RM (2000) Nutrition knowledge, gender, and food label use. J Consum Aff 34: 97-112.
- Shannon CS, Jeffrey GT, Alison MS (1999) Use of food labels and beliefs about diet-disease relationships among university students. Public Health Nutr 3: 175-182.
- Campos S, Doxey J, Hammond D (2011) Nutrition labels on pre-packaged foods: a systematic review. Public Health Nutr 14: 1496-506.
- John EL, Kristopher LA, William GLB (2009) Food label use and awareness of nutritional information and recommendations among persons with chronic disease. Am J Clin Nutr 90:1351-1357.
- Bazhan M, Mirghotbi M, Amiri Z (2015) Food labels: An analysis of the consumers' reasons for non-use. J Paramed Sci 6: 1-10.
- Satia JA, Galanko JA, Neuhouser ML (2005) Food nutrition label use is associated with demographic, behavioral, and psychosocial factors and dietary intake among African Americans in North Carolina. J Am Diet Assoc 105: 392-402.
- Ollberding NJ, Wolf RL, Contento I (2010) Food label use and its relation to dietary intake among US adults. J Am Diet Assoc 110: 1233-1237.
- Santosh V, May L, Jiang C, Wee KW (2011) Determinants of food label use among supermarket shoppers: a Singaporean perspective. Proceedings of the Australian and New Zealand Marketing Academy Conference 2011.
- Norimah AK, Hwong CS, Liew WC, Ruzita AT, Siti Sa’adiah HN, et al. (2010) Messages of the newly proposed Malaysian Dietary Guidelines (MDG): Do adults in Kuala Lumpur understand them? Malays J Nutr 16: 113-123.
- Fatimah S, Nik-Ismail ND, Tee, ES (2010) Consumer understanding and preferences for different nutrition information panel formats. Malays J Nutr 16: 243-250.
- Mhurchu CN, Gorton D (2007) Nutrition labels and claims in New Zealand and Australia: a review of use and understanding. Aust N Z J Public Health 31: 105-112.
- Klaus GG, Laura FC, Josephine MV, Stefan S, Genannt B, et al. (2010) Use and Understanding of Nutrition Information on Food Labels in Six European Countries. J Public Health 18: 261-277.
- Ellen VK, Hans VT, Frederic P, Laura FC (2007) Consumer preferences for front-of-pack calories labelling. Public Health Nutr 11: 203-213.
- Delvina G, Cliona NM, Mei HC, Robyn D (2009) Nutrition labels: a survey of use, understanding and preferences among ethnically diverse shoppers in New Zealand. Public Health Nutr 12: 1359-1365.

