Keywords
Phosphate looming crises, nutrients, N, P, Atlantic, North Sea, Rhine, seaweed community, extreme mega cities.
Introduction
Phosphorus (P) is one of the common elements on earth and is essential for all living organisms. It forms part of DNA, nerve cells and the brain, bones, teeth and plays role in biochemical cycles like the Calvin cycle, Krebs Cycle, Glycolysis and Oxidative Phosphorylation, essential in the energy supply of plants and animals (Figure 1).
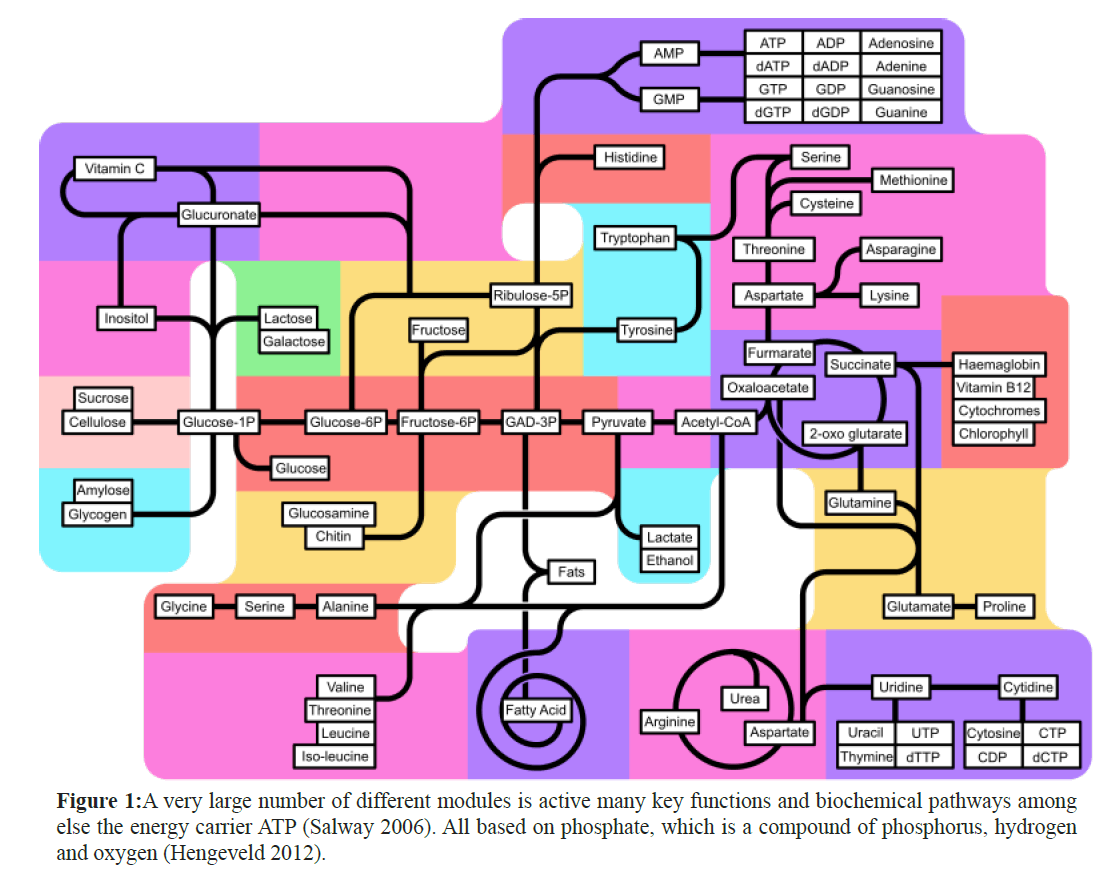
Figure 1: A very large number of different modules is active many key functions and biochemical pathways among else the energy carrier ATP (Salway 2006). All based on phosphate, which is a compound of phosphorus, hydrogen and oxygen (Hengeveld 2012).
Each of us excretes around 1.5 grams of phosphorus per day into sewage (Salway 2006), implying, with a population of 6 billion an annual use of 3.3 billion-kilogram phosphate, which will increase to 5.5 billion-kilogram by 2050. Phosphate rock is the only economic source of P for production of phosphate fertilizers and phosphate chemicals. The current commercial reserves of phosphate rock are estimated at 40 billion tons and are found in the United States, China, Kazakhstan, Morocco, Finland, South Africa, and some Pacific Islands, of which the first four are current production leaders with 72% of the total world supply. These reserves are estimated to suffice for a 60-130 years supply at current usage and market prices (Zapata & Roy 2004). The relatively inexpensive phosphorus we use today will likely be exhausted within 50 years (Someus 2008), although estimates greatly vary (Van Vuuren et al 2010). The typical P2O5 content of phosphate rock is 30-40% (=13-17.5% P); but with increasing demand, phosphate rock will increasingly be contaminated with impurities like iron, volatile metals, chloride and copper (Schipper et al. 2004). These contaminants in fertilizer produced from rock, may be a more important driver for phosphorus recovery, so that the actual phosphate crisis may well be reached within 50 years (Someus 2008). Over 80% of the mined phosphate is used as fertilizer in agriculture (Zapata & Roy 2004; Hengeveld 2012). The phosphate, not incorporated in the crop, flushes away from the soil via the rivers to the oceans. N and P, whether the source is natural or (as nowadays mostly) anthropogenic, cause eutrophication of the aquatic environment. Anthropogenic sources include direct run-off from land and dredge spoil/sewage sludge from the rivers to the seas like North Sea and Baltic Sea. Annually about 120 Gmol yr-1are lost from the watershed via rivers of which about 53 Gmol P are from large rivers (mostly the Amazon) and the remainder from smaller rivers that flow into estuaries and shallow seas like North Sea and Baltic Sea (Galloway et al. 1996). The North Sea, with an area of 700,000 km2 is the most disturbed sea (Druon et al. 2004) and its major river contributors from the overpopulated European continent include the Elbe, Wieser, Ems, Rhine (Zobrist & Stumm 1981; De Klein 2007), Scheldt, Seine and Humber (Brion et al. 2004). Total annual inputs in the North Sea are 8870 ⌈ 4860 kt N and 494 ⌈ 279 kt P and it is concluded that for P this sea is a source for the Atlantic Ocean (-4 to 52 kt P year-1) (Brion et al. 2004). The Baltic Sea receives annually one million tons of nitrogen and more than 30.000 tons of phosphorus (Helsinki Commission 2004). At this moment, the North Atlantic Ocean appears to accumulate P at a rate of about 0.1% per year (Galloway et al. 1996) (Figure 2).
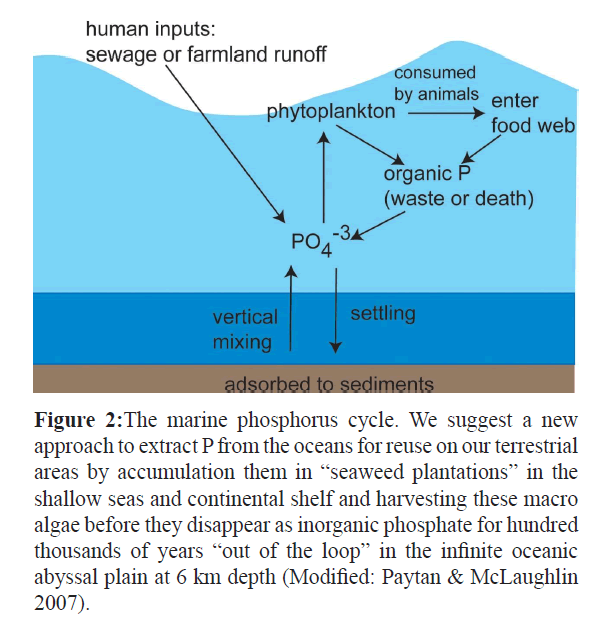
Figure 2: The marine phosphorus cycle. We suggest a new approach to extract P from the oceans for reuse on our terrestrial areas by accumulation them in “seaweed plantations” in the shallow seas and continental shelf and harvesting these macro algae before they disappear as inorganic phosphate for hundred thousands of years “out of the loop” in the infinite oceanic abyssal plain at 6 km depth (Modified: Paytan & McLaughlin 2007).
Therefore, phosphate recycling is essential for the sustainable future of our society, as it is inconceivable to continue to simply flush away a non-renewable resource that is essential for life, to the oceans. The best way to recycle phosphorus is agricultural re-use of sewage solids, but logistic problems (lack of farmland around big cities), contamination with pollutants and consumer resistance rapidly reduce this option in many countries. In situations where agricultural re-use is not possible, industrial recycling of phosphates offers a sustainable solution (Schipper et al. 2004).
A new approach to extract P from the oceans for reuse on terrestrial areas might be accumulation in seaweeds and harvesting these macro-algae. In this research we investigated the possibilities by measuring the N- and P-content of seaweed from contaminated waters (Netherlands, France, Ireland, Portugal) and one tropical seaweeds species from the Atlantic (Azores). We also measured the total N-content of seaweeds and ocean water. In addition we discuss the limitations of the N:P ratio of seaweeds as a useful biomarker for eutrophic seawaters.
Materials and Methods
Seaweeds
Fronds (five replicates) of different species of bethic marine macrophyte (seaweeds) with different growth strategies and morphologies were collected from the upper and mid-littoral zone at 4 countries, in addition to one seawater sample. The following seaweeds were collected with the location given:
-Eastern Scheldt, the Netherlands (Ulva lactuca) (Chlorophyta), Approximate coordinates 51°32´30 N and 3°52´ E.
-Concarneaux, France, Ulva lactuca (Chlorophyta), Laminaria hyperbolia (Phaeophyceae), L. digitata (Phaeophyceae), Chondrus crispus (Rhodophyta), Fucus serratus (Phaeophycea), proximate coordinates 47°52´ N and 3°52´ E.
-Kilcar, West Donegal, Ireland (Laminaria digitata (Phaeophyceae), Undaria pinnatifidia (Phaeophyceae), Approximate coordinates 54°37´ N and 8°37´ W.
-Porto, Portugal (Chondrus crispus (Rhodophyta), Mastocarpus stellatus (Rhodophyta), Sargassum muticum (Phaeophyceae), Laminaria hyperbolia (Phaeophyceae), Approximate coordinates 41°32´30 N and 9.5°42´ E.
-Norway, from the Island Solund, at the point 61º.03’ N, 4º52’ E (Ascophyllym nodusum).
In addition we collected:
The tropical seaweed Sargassum natans (Phaeophyceae), by a whaler at the Atlantic Ocean at the point 37º 08.403 N/32º 22.591W.
Sampling seawater
A sample of the surrounding seawater of the seaweeds was taken while collecting the seaweeds and frozen on dry ice (-180ºC).
Dry weight seaweeds
After collection, the seaweeds were brought as soon as possible to the laboratory. Most epiphytic material was removed; the seaweeds were rinsed quickly with freshwater, air-dried, and oven-dried (one night at 60ºC and one night at 105ºC) and weighed and the dry matter content calculated.
N and P contents of seaweeds and seawater
After grinding the seaweeds to a fine powder, Nt (N-total) and Pt (P-total) were measured on a SFA-NT/PT apparatus according to SW E1406 guidelines, Nts and P-PO4 analyses of seawater were performed on an SFA-CaCl2 apparatus according to SWV E1417 guidelines, P analysis was performed on an ICP-AES Thermo apparatus according to SWV E1304 guidelines, at the Chemical-Biological Laboratory for Soil Research, Wageningen University, Netherlands (modified: USEPA 2004).
Historical datasets Rhine River
In composing our historical dataset of the Rhine North Sea system depicted in Figure 3 ---results paragraph-, we used the following datasets:
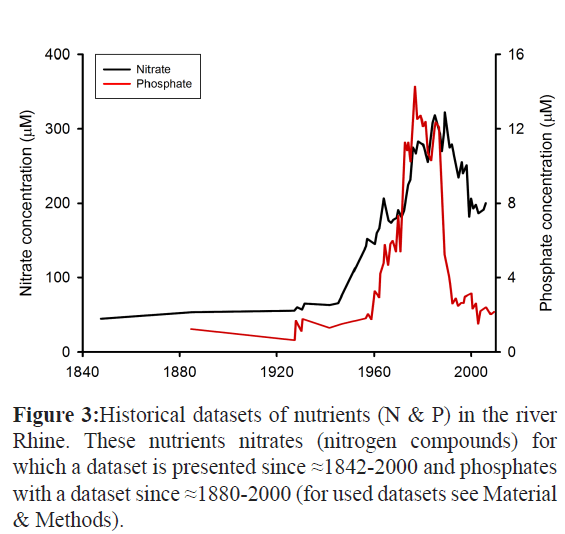
Figure 3: Historical datasets of nutrients (N & P) in the river Rhine. These nutrients nitrates (nitrogen compounds) for which a dataset is presented since ≈1842-2000 and phosphates with a dataset since ≈1880-2000 (for used datasets see Material & Methods).
• Data before 1900 (after Clarke, 1924),
• Data between 1928 and 1945 represent annual averages measured at Rhenen, the Netherlands, calculated after Biemond's reports 'The water supply of Amsterdam', 1940 I, p-210 and 1948, p. 110.
• Data after 1955 annual averages measured at Lobith (Intern. Comm. for Protection of the Rhine against Pollution 1972, 1976).
• Concentrations of important nutrients in the Rhine and their long-term concentration changes (after Van Bennekom and Salomons, 1981).
• The total annual nutrient load of the North Sea between 1995-2005 was on average 472 ± 37 million kg N and 27.4 ± 37 million kg P (De Klein 2007).
Results
The river Rhine flows through a highly urbanized and intensively used agrarian region towards the North Sea. Because extensive datasets regarding N and P dated to about the mid-19th century exist it can be used as a scholarly case study of costly abatement measures to trap these nutrients and its effects in relation to the nowadays nutrient load on the North Sea. Because the ‘phosphate looming crises’ will be a phenomenon on a global scale, it is important to spread this information of this well documented and historical datasets of this river Rhine N and P efflux towards the North sea. This unique historical dataset comprises for nitrogen compounds a dataset covering the period ≈1842-2000 and for P-related phosphates a dataset covering the period ≈1880-2000. This Rhine River and North Sea “case study” can already have a scholarly impact on politicians, ecologists and biologists coping on our globe with similar problems of eutrophication of river systems and shallow seas and tremendous losses of the essential mineral Phosphorus. By combination of several datasets of the Rhine River (see Material & Methods), we were able to present a scholarly example illustrating how the input of nutrients by rivers into the shallow seas like the North Sea has evolved through time in European regions because extensive data are available for the Rhine River since the midst 19th century. From the resulting both graphs depicted in Figure 3, it becomes clear that from the midst- 20th century the concentrations of these nutrients in the river Rhine has increased enormously reaching maximal levels in the eighties previous century of Nitrate concentrations around 350 μM while of [Phosphate] of around 13 μ (Figure 3). This is largely due to the intensive use of chemical fertilizers in agriculture and inadequate wastewater treatment Also, major causes of the increase of both chemical compounds included a growing input from agriculture and industry as well as the discharge of untreated urban sewage. Laundry detergent with phosphate additives to decalcify the wash water was a significant source of phosphates. In the eighties of the 20st century, counteractive political decisions/measures such as a ban on phosphate detergents and improved fertilizing techniques have been successful in significantly reducing the input since that time.. Appropriate measures were taken that have succeeded in consistently reducing the nutrient concentrations since the midst- 1980s followed by treatment of wastewater resulting in a further reduction. However response of the nutrients on a certain measure is slow. Over a period of around 20-30 years nitrate concentrations declined and remained stable at around 350 μM while these of [Phosphate] remained stable around 13 μ giving ultimately the total annual nutrient load of the North Sea between 1995-2005 which was on average 472 ± 37 million kg N and 27.4 ± 37 million kg P as basis for our calculations to trap this remaining part by a seaweed plantation on the North Sea as we will work out in Table 1 and the next session of the Results paragraph and Discussion.
| |
Ds (%)
(n=4-5) |
Nt
(g/kg)
(n=4-5) |
Pt
(g/kg)
(n=4-5) |
N:P
ratio
(n=4-5) |
Nt-water
(mg/l)
(n=1) |
Pt-water
(mg/l)
(n=1) |
P-PO4
water
(mg/l)
(n=1) |
Netherlands
Oosterschelde |
|
|
|
|
|
|
|
| Ulvalactuca |
19.8 ± 0.8 |
12.5 ± 2.4 |
1.5 ± 0.1 |
8.0 ± 0.9 |
0.18 |
0.136 |
0.101 |
France
Concarneaux |
|
|
|
|
|
|
|
| Ulvalactuca |
16.3 ± 1.6 |
12.5 ± 1.3 |
0.9 ± 0.1 |
13.6 ± 0.7 |
0.10 |
0.010 |
0.004 |
| Laminariahyperbolia |
12.0 ± 0.4 |
9.0 ± 0.3 |
0.8 ± 0.01 |
10.9 ± 0.2 |
0.10 |
0.010 |
0.004 |
Laminaria
Digitata |
17.1 ± 1.6 |
16.0 ± 1.2 |
1.4 ± 0.2 |
11.6 ± 1.4 |
0.10 |
0.010 |
0.004 |
| Chondruscrispus |
11.5 ± 0.8 |
16.1 ± 1.7 |
1.1 ± 0.1 |
14.8 ± 1.0 |
0.10 |
0.010 |
0.004 |
| Fucusserratus |
21.8 ± 1.7 |
14.6 ± 0.6 |
0.7 ± 0.0 |
21.8 ± 1.0 |
0.10 |
0.010 |
0.004 |
Ireland
West Donegal |
|
|
|
|
|
|
|
Laminaria
Digitata |
25.8 ± 1.7 |
11.8 ± 0.3 |
0.4 ± 0.01 |
31.3 ± 1.2 |
0.14 |
0.01 |
0.002 |
Undaria
Pinnatifidia |
9.2 ± 5.2 |
21.2 ± 0.7 |
1.1 ± 0.01 |
19.1 ± 0.5 |
0.14 |
0.01 |
0.002 |
| Palmaria palmate |
21.7 ± 0.012 |
27.7 ± 0.4 |
23.3 ± 0.03 |
11.6 ± 0.1 |
0.14 |
0.01 |
0.002 |
Norway
Ascophyllymnodusum |
29.8 ± 0.008 |
8.1 ± 0.9 |
0.5 ± 0.1 |
15.1 ± 1.1 |
0.17 |
0.01 |
0.014 |
Portugal
Porto |
|
|
|
|
|
|
|
| Chondruscrispus |
33.2 ± 0.18 |
36.5 ± 0.8 |
2.8 ± 0.6 |
13.7 ± 2.7 |
0.23 |
0.01 |
0.003 |
| Mastocarpus stellatus |
33.1 ± 1.0 |
41.1 ± 0.4 |
1.9 ± 0.03 |
22.2 ± 0.5 |
0.23 |
0.01 |
0.003 |
| Sargassum muticum |
17.1 ± 1.1 |
31.8 ± 0.6 |
2.8 ± 0.04 |
11.2 ± 0.2 |
0.73 |
0.05 |
0.007 |
| Laminaria hyperbolia |
14.5 ± 1.4 |
18.0 ± 0.3 |
3.8 ± 0.09 |
4.7 ± 0.06 |
0.73 |
0.05 |
0.007 |
| Gracilaria SP. |
17.2 ± 0.4 |
58.2 ± 2.5 |
6.5 ± 0.2 |
8.9 ± 0.3 |
0.21 |
0.00 |
0.005 |
Atlantic
Sargassumnatans |
18.5 ± 2.4 |
9.8 ± 0.7 |
1.1 ± 0.09 |
9.2 ± 0.2 |
1.00 |
0.03 |
0.027 |
Table 1: Dry matter content (Ds), total-N, total-P and N: P ratio of several seaweeds collected around the North Sea (Netherlands, France, Ireland, Portugal) and the Atlantic Ocean (Sargassumnatans).
Discussion
In recent years there has been an increased production of large seaweeds in shallow coastal waters. These macro-algae are mostly green seaweeds like Ulva spp. (Sawyer 1956; Ménesguen & Piriou 1995; Sorokin et al. 2002). This can be ascribed to their ability to survive in fluctuating environments and their ability to take up and store nutrients like N and P. Seaweed-based ecosystems are amongst the most productive on Earth (Mann et al. 1980, Leigh et al. 1987). Therefore, these systems could probably serve as a sink to trap nutrients in shallow eutrophic seas like the Baltic, Adriatic and North Sea, to which N and P are delivered by rivers like the Rhine, in order to avoid further eutrophication of our oceans. Enhanced growth of seaweeds has been observed under certain conditions in coastal marine waters polluted by sewage (Causey et al. 1945, Sawyer 1956; Tewari et al. 1972). Also in disturbed nutrient-rich systems like those in in Brittany (France) (Ménesguen and Pirriou 1995) and the Venice lagoon (Sorokin et al. 2002) Ulva spp. can bloom. On a global scale “green tides” are overwhelming the coastline of our planet Earth, mainly in Asia (Ye et al 2011). A recent report of Wichard et al (2015) -and references therein- reviews the literature for these Ulva blooms or “green tides” on a global scale: indications for eutrophic, hypoxic and disturbed ecosystems. Many aquatic ecosystems are threatened or affected by eutrophication. Here, eutrophication refers to the process by which water bodies acquire high nutrient concentrations (in particular phosphates and nitrates) typically followed by excessive growth and decay of plants (algae) in the surface water. It may occur naturally (e.g. in deep waters) but is most often the result of pollution related to human activity, such as fertilizer runoff and sewage discharge and the atmospheric deposition of nitrogen compounds. This process has been linked to serious losses of fish stocks and other aquatic life (e.g. Smith 2003).Eutrophication may cause hypoxia, a state whereby aquatic ecosystems lack sufficient oxygen to support most forms of life, producing ‘dead zones’ (Rabalais et al. 2010). In marine ecosystems, most dead zones have developed along coasts since the 1960s due to environmental pollution associated with human activities. ‘Dead zones’ are particularly common along the coasts of Europe, North America and east Asia. Many are concentrated near the estuaries of major rivers, and result from the build-up of nutrients carried from inland agricultural areas. So our suggestions are to avoid eutrophication of our marine water–especially in case no major river effluent system exist like in Europe the river Rhine/North Sea system-which enables countries to build sewage treatment facilities. Hence, for these global regions without major river system we suggest to trap abundant nutrients by seaweed culture e.g. of Ulva species (Wichard et al 2015). Seaweed growth is affected by season, temperature, (Duke et al. 1989a,b); light, (Lapointe & Tenore 1981; Couthino & Zingmark 1993), the availability of suitable substrates and shading and circannual rhytms and major factors like nutrient availability for balanced growth are important (Atkinson and Smith 1983; Cabioc'h et al 2006; Hurd et al 2014). Moreover, the surface to volume ratio may vary among seaweed species and may have an impact on photosynthetic capacity and nutrient uptake (reviewed: Hurd et al 2014).
To gather information about the effects of nutrients on seaweed growth rate and the possibility if seaweeds can be used to trap phosphorus and by harvesting return this compound to terrestrial agroecosystems, we made a study at the N : P ratio in seaweeds.
The mean C: N: P ratio of 92 benthic plant samples from five phyla, sampled at nine locations worldwide is about 700:35:1; the median is about 550:30:1 (Atkinson and Smith 1983). In this study, the limiting value for the N: P ratio was 16, the median 30 and the mean 35. These values provide a basis for estimating their threshold values.
In general, for seaweeds an N: P ratio<10 indicates a relative N-limitation while an N : P ratio > 30 points to a relative P limitation (Atkinson and Smith 1983; Smith 1984).
According to the Bjönsäter & Wheeler's (1990) classification of macroalgal nutrient status, based on N : P ratios in their tissue, a N: P ratio<16 indicates a relative N-limitation; an ratio of 16- 24 indicates a balanced availability of both elements - i.e., no limitation and N: P>24 indicates a relative P-limitation
In only one extensive study, N: P ratios of fronds of different species of benthic marine macrophytes (22 macroalgae and one seagrass) were investigated (Hernandéz et al. 1999). The N: P ratio in twenty seaweeds was in the range of 10-20 which indicates N- and P-sufficiency. Only Cladophora rupestris and Ceramium nodolosum (from Tyne Sands, southeast Scotland) showed N: P ratios of respectively 44.7 ± 3.4 and 34.6 ± 1.5 which points to a relative P limitation (Hernandéz et al. 1999). In the study of Prince (1974) on Fucus vesiculosus (brown seaweed) and Enteromorpha linza (green seaweed) N:P ratios were found of respectively 45 and 39, indicating a relative P limitation.
In a long-term study in a tropical environment (Guanabara Bay, South-eastern Brazil) ten species of seaweeds (6 green and 4 red algae) were monitored from 1997 to 2004. Wide variations in total dissolved nitrogen concentrations and N: P ratios were recorded; however, no seasonal trend was detected (Lourenço et al. 2006). Tissue N: P ratios were predominantly >20, while the highest value was found for Ulva lactuca (56.8) which points to a relative P-limitation and the lowest value for Chondracanthus teedii (13.6), a threshold value for relative N-limitation (Lourenço et al. 2006).
However, Lourenço et al. (2006) caution against the N: P ratio studies performed in tropical environments (Fong et al. 2003), because their results are similar to those of studies with seaweeds growing under excess nutrient availability (Lapointe et al. 2004). The high mean overall N: P ratio observed in Guanabara Bay (Brazil) in summer 2004 (32.7 ± 10.7, n=43) is strongly affected by the high concentrations of nitrogen and is not necessary indicative of P limitation (Lourenço et al. 2006).
So, it is important to use the N: P ratio as a biomarker only in cases when the nitrogen content of the tissue is not fluctuating during the season. Iwasaki and Matsudaira (1954) found that the nitrogen concentration in the tissue of Porphyra tenera exhibited a marked seasonal fluctuation, causing the N : P ratio to vary between 7.2 and 28.2. Also in the study of Wheeler and Björnsäter (1992), seasonal fluctuations were observed in N: P ratio for five seaweeds from Oregon (Northwest Pacific). The selection of the time scale where seaweeds has to be exposed to stable nutrient exposure to have a valuable N: P ratio as biomarker is rather complex due plant physiological characteristics. Seaweeds are adapted to stressful environments with variable supply of nutrients such as N (Duke et al. 1989a). It appears that many seaweeds can control the transient nitrate availability by means of active transport systems that lead to luxury uptake, saturating the nitrate and nitrite reductase systems and leading to nitrate accumulation within vacuoles (Hurd et al. 2014). In the study of Lourenço et al. (2005, 2006), N concentrations in the seaweeds suggest that the species are permanently saturated with nitrogen. Ulva spp. can control nitrate availability for approximately 40 days. N can be temporarily stored in photosynthetic pigments and Rubisco molecules (Duke et al. 1989), which allows these macroalgae to maintain active growth for at least three weeks after nitrate depletion in the medium (Viaroli et al. 1996). This process, however, is of importance only in disturbed systems with strongly fluctuating nutrient contents such as Brittany (France) (Ménesguen and Pirriou 1995) and the Venice lagoon (Sorokin et al. 2002). This ability of seaweeds like Ulva to store nitrogen for several weeks (Duke at al. 1989a, Viaroli et al. 1996) is in contrast to the suggestion of Ryther and Dunstan (1971) that nitrogen is frequently the major limiting nutrient for algal growth in coastal marine waters were phosphate is found generally in excess. Overall, in temperate eutrophic "stable" seas and large water bodies with stable nitrogen concentrations we can expect that the N : P ratio is a useful biomarker for eutrophication if regularly sampled (in combination with water analysis). The ability of Ulva spp. (Viaroli et al. 1996) and other seaweeds to store P and N may have substantial effects on the growth of seaweeds, but also offers an opportunity for these species to act as a sink to eliminate P and N from eutrophic shallow seas.
Finally we give based on our nutrient measurements at the North Sea seaweeds an estimation how large the area of seaweed culture has to be, to trap the annual load of the North Sea of P and N to oppose the eutrophication of this shallow sea and consequently the Atlantic Ocean. The total annual nutrient load of the North Sea between 1995-2005 was on average 472 ± 37 million kg N and 27.4 ± 37 million kg P (De Klein 2007). Seaweed communities are complex ecological systems in which different seaweed species interact and the results of these interactions may vary in time and space (Hurd et al. 2014 Bhang and Kim 2000,). An example of such a seaweed community–based on observations along the coast of Bretagne (France) is depicted in Figure 4. Information about seaweed- ecosystems –communities and its interactions between the different seaweed species are scarce but are an absolute prerequisite to use them in future studies as a sequestering sink for nutrients like P (but also N) in the shallow seas like the North-sea before the eutrophicated water originating from populated areas like Western Europe reaches the Atlantic oceans (Figure 2).
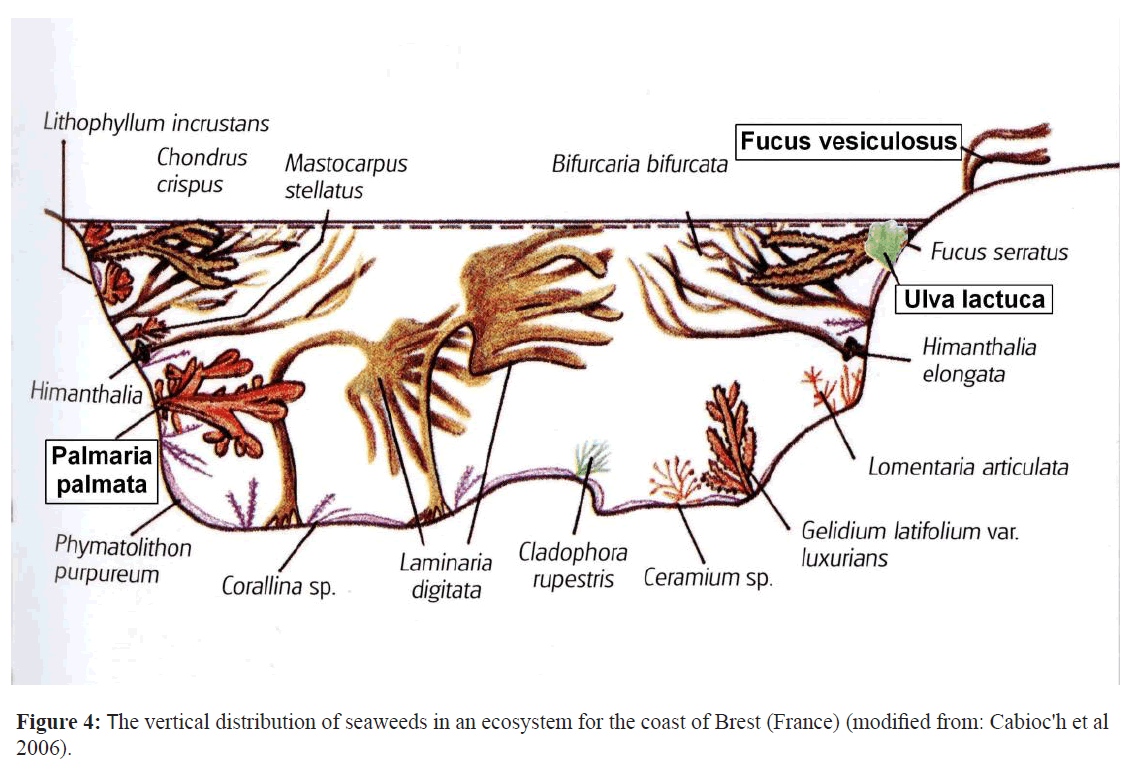
Figure 4: The vertical distribution of seaweeds in an ecosystem for the coast of Brest (France) (modified from: Cabioc'h et al 2006).
Conclusion
Excreted P reaches via sewage P rivers like the Rhine -which nowadays carry a total annual load of 472 million kg N and 27.4 million kg P (De Klein 2007)-to swallow coastal waters like the North Sea (57,000 km2) (Zobrist & Stumm 1981). Ultimately it will vanish in the Atlantic Ocean where it will deposit at an abyssal depth of ≈ 6,000 m unreachable to bring it back to land and ‘close the P-loop’ (Paytan & McLaughlin 2007). We suggest to trap these nutrients already in urbanized area’s which is for 50% accomplished in the Rhine since 1972 and the remaining part by plantations of artificial seaweed communities planted until ten meters depth. Based on N & P data of several seaweed species around the North Sea we calculated that to trap the present remaining outflow of N and P respectively, 2114 ha (3.71%) and 1758 ha (3.08%) of the Dutch North Sea surface should be planted. The basin is perhaps the most heavily industrialized in the world. The Rhine with a basin area of 220,000 km² crosses Central Europe with one of the most intensive agricultural and industrial activity in the world. Although the stream flow of the Rhine comprises only about 0.2 per cent of the flow of all worldwide rivers it carries the waste of 41.4 × 10⁶ inhabitants and about 10 to 20 per cent of the total Western chemical industry (OECD countries) is located in its basin. So extending knowledge in nutrient management in the river and our suggestions concerning “seaweed plantations” might be important for other river basins because the “looming phosphorus crises” is a global problem. Particularly in Southeast Asia, rivers convey agricultural nutrients and untreated wastewater to the oceans. In many areas this causes a massive proliferation of algae. In some regions entire habitats are altered. Efforts to curtail the flood of nutrients have been successful in some parts of Europe, but worldwide the situation is growing worse.rivers are carrying more and more nutrients to the oceans, and experts expect this trend to continue (Ye et al. 2011). Especially in Asia in the 21st Century with its megacities see Figure 5, where more than half of the world population will live our “river Rhine/North-Sea model with seaweed plantations” might be an affordable, sustainable, environmental friendly method to cope with the “looming phosphorus crises”.

Figure 5: Eutrophic areas are those with excessive nutrients (orange dots), putting them at risk of adverse effects. Hypoxic areas are those where oxygen levels in the water are already depleted and adverse effects expected due to nutrient and or organic pollution (red dots). Blue dots are systems that were hypoxic at one time but are recovering (Source: World Resources Institute 2011).
8217
References
- Atkinson, M.J., Smith, S.V. (1983). C:N:P ratios of benthic marine plants. Limnol.Oceanogr. 28, 568-574.
- Bhang, Y.J., Kim, J.H. (2000). Patterns of interspecific interactions in the Ulva-dominated intertidal community in a southern coast of Korea. Journal of Phycology, 36, 6-6(1).
- Björnsäter, B.R., Wheeler, P.A. (1990). Effect of nitrogen and phosphorus supply on growth and tissue composition of Ulva fenestra and Enteromorpha intestinalis (Ulvales, Chlorophyta). J.Phycol. 26,603-611.
- Brion, N., Baeyens, W., De Galan, S., Elskens, M., Laane, R.W.P.M (2004). Review - The North Sea: source or sink for nitrogen and phosphorus to the Atlantic Ocean. Biogeochemistry 68, 277-296.
- Cabioc'h, J.-Y., Floc'h, A., Le Toquin, C.-F., Boudouresque, A., Meinesz- Verlaque, M. (2006). Guide des algues des mers d'Europe. , Manche & Atlantique. , MГ©diterranГ©e; Editors: Delachaux & NiestlГ©; Paris; 272 pp.
- Causey, N.B.,Pryterck, J.P.,McCaskill, J.,Humm, H.J., Wolf, F.A. (1945). Influence of environmental factors on the growth of Gracilariaconfervoides. Bull. Duke Univ. Mar. Stn.3, 19-24.
- Clarke, F. W. (1924) Data of Geochemistry, US Geol. Surv. Bull. 770, 841pp.
- Couthino, R., Zingmark, R. (1993). Interactions of light and nitrogen on photosynthesis and growth of the marine macroalga Ulva curvata (KГјtzing). De Toni. J.Exp.Mar. Biol. Ecol. 167, 11-19.
- DeBoer, J.A. (1981). Nutrients.In C.S. Lobban& M.J. Wynne (eds.); “The Biology of Seaweeds”.Botanical Monographs.17, Univ. California Press, Berkeley and Los Angeles.356-392pp.
- De Klein, J.J.M. (2007).Analysis of the nitrogen and phosphorus loads on the Dutch part of the North Sea UPDATE 2007. Alterra report 1612. Wageningen University and Research Centre, Wageningen, Netherlands.
- Druon, J.N.,Schrimpf, W.,Dobrick, S., Stips, A. (2004). Comparative assessment of large scale marine eutrophication: North Sea area and Adriatic Sea as case studies. Marine Ecology Progress Series 272, 1-23.
- Duke, C.S.,Litaker, W., Ramus, J. (1989a). Effect of temperature on nitrogen-limited growth rate and chemical composition of Ulvacurvata (Ulvales: Chlorophyta). Mar. Biol. 100, 143-150.
- Duke, C.S.,Litaker, W., Ramus, J. (1989b). Effects of temperature, nitrogen supply, and tissue nitrogen on ammonium uptake rates of the chlorophyte seaweeds Ulva curvata and Codiumdecorticatum. J.Phycol. 25, 113-120.
- Fong, P., Boyer, K.E., Kamer, K., Boyle, K.A. (2003). Influence of initial tissue nutrient status of tropical marine algae on response to nitrogen and phosphorus additions. Mar. Ecol. Prog. Ser. 262, 111-123.
- Galloway, J.N.,Howarth, R.W.,Michaels, A.F.,Nixon, S.W.,Prospero, J.M.,Dententer, F.J. (1996). Nitrogen and Phosphorus budgets of the North Atlantic Ocean and its watershed. Biogeochemistry 35, 3-25.
- Helsinki Commission (2004). Thematic Report on validation of Algorithms for Chlorophyll a Retrieval from Satelite data of the Baltic Sea Area (Editor W. Schrimpf) Baltic Sea Environ. Proc. 94.44 pp.
- Hengeveld, R. (2012). “Wasted World: How Our Consumption Challenges the Planet”; University of Chicago Press; Chicago & London; 337 pp.
- HernГЎndez, I., AndrГa, J.R., Christmas, M., Whitton, B.A. (1999). Testing the allometric scaling of alkaline phosphatase activity to surface/volume ratio in benthic marine macrophytes. Journal of Experimental Biology and Ecology 241, 1-14.
- Hurd, C.L., Harrison, P.J.,Bischof, K. and Lobban, C.S. (2014). “Seaweed Ecology & Physiology”; Cambridge University Press, 551 pp.
- International Commission for Protection of the River Rhine against Pollution (1972) Jährliche Tätigkeitsberichte, Koblenz.
- Iwasaki, H.,Matsudaira, C. (1954). Studies on cultural grounds of a laver, PorphyrateneraKjellman in Matsukawa-Ura Inlet. 1. Environmental characteristics affecting upon nitrogen and phosphorus contents of laver. Bull. Jap. Soc. Sci. Fish. 20, 112-119.
- Lapointe, B.E.,Tenore, K.R. (1981). Experimental outdoor studies with UlvafasciataDelile. 1: Interaction of light and nitrogen on nutrient uptake, growth, and biochemical composition. J.Exp.Mar.Biol.Ecol. 53, 135-152.
- Lapointe, B.E.,Barile, P.J.,Matzie, W.R. (2004). Anthropogenic nutrient enrichment of seagrass and coral reef communities in the Lower Florida Keys: Discrimination of local versus regional nitrogen sources. J.Exp.Mar. Biol. Ecol. 308, 23-58.
- Leigh, F.G., Paine, R.T., Quinn, J.F.,Suchanek, T.H. (1987). Wave energy and intertidal productivity. Proc.Natl.Acad.Sci.USA84, 1314-1318.
- Lobban, C.S., Harrison, P.J. (1994). Seaweed Ecology and Physiology. Cambridge University Press, Cambridge, UK.
- Lourenço, S.O., Barbarino, E., Nascimento, A., Paranhos, R. (2005). Seasonal variations in tissue nitrogen and phosphorus of eight macroalgae from a tropical hypersaline coastal environment. Cryptogam. Algol. 26, 355-371.
- Lourenço, S.O., Barbarino, E., Nascimento, A., Freitas, J.N.P., Diniz, G.S. (2006).Tissue nitrogen and phosphorus in seaweeds in a tropical eutrophic environment: What a long-term study tells us. Journal of Applied Phycology 18, 389-398.
- Mann, K.H., Chapman, A.R.O., Gagne, J.A. (1980). Productivity of seaweeds: the potential and the reality. In: Falowski P.G. (ed). Primary productivity in the sea. Plenum Press. New York, USA. pp. 363-380.
- MГ©nesguen, A. andPiriou, J-Y. (1995). Nitrogen loadings and macroalgal (Ulvasp.) mass accumulation in Brittany (France). Ophelia 42, 227-237.
- Paytan, A.,and McLaughlin, K. (2007). The Oceanic Phosphorus Cycle. Chem. Rev. 107, 563-576.
- Prince, J.S. (1974). Nutrient assimilation and growth of some seaweeds in mixtures of sea water and secondary sewage treatment effluents. Aquaculture 4, 69-79.
- Ryther, J.H., Dunstan, W.M. (1971). Nitrogen, phosphorus and eutrophication in the coastal marine environment. Science 171, 1008-1013.
- Salway, J.G. (2006). Medical Biochemistry at a glance.Blackwell Publishing. ISBN-13: 978-1-4051-1322-9, 144 pp.
- Sawyer, C.N. (1956).The sea lettuce problem in Boston Harbor.J.WaterPollut. Control.Fed.37, 1122-1133.
- Schipper, W.J.,Klapwijk, A.,Potjer, B.,Rulkens, W.H.,Temmink, B.G.,et al. (2004). Phosphate recycling in the Phosphorus Industry. Phosphorus Research Bulletin 15, 47-51.
- Smith, S.V. (1984). Phosphorus versus nitrogen limitation in the marine environment.Limnol.Oceanogr.29, 1149-1160.
- Smith, V.H. (2003). [Review]: Eutrophication of Freshwater and Coastal Marine Ecosystems: a Global Problem. Environmental Sciences 10, 126-139.
- Someus, E. (2008). Rock phosphate isa non renewableresource. 3R Environmental Technologies LTD. https://www.terrenum.net
- Sorokin, P.Yu., Sorokin, Yu.I.,Zakuskina, O.YU.,Ravagna, G-P. (2002). On the changing Venice lagoon.Hydrobiologia487, 1-18.
- Tewari, A. (1972). The effect of sewage pollution on Entermorphaprolifera var. tubulosa growing under natural habitat.Bot.Mar. 15, 167.
- USEPA (2004).United States Environment Protection Agency.SW-846 On-line.InВ Test Methods for Evaluating Solid Waste, Physical/Chemical Methods, 3500.
- Van Bennekom, A. J. and Salomons, W. (1981) Pathways of nutrients and organic matter from land to oceans through rivers. In: Martin, J. M., Burton, J. D. and Eisma, D. (Eds) River Inputs to Ocean Systems. Proc. Workshop Rome, 26-30 March, 1979, UNEP, IOC, SCOR, 33-51.
- Van Vuuren, D.P., Bouwman, A.F., Beusen, A.H.W. (2010). Phosphorus demand for the 1970-2100 period: A scenario analysis of resource depletion. Global Environmental Change 20, 428-439.
- Viaroli, P.,Naldi, M., Bonndavalli, C.,Bencivelli, S. (1996). Growth of the seaweed Ulvarigida C. Agardh in relation to biomass densities, internal nutrient pools and external nutrient supply in the Sacca di Goro lagoon (Northern Italy).Hydrobiologia329, 93-103.
- Wheeler, P.A.,Björnsäter, B.R. (1992). Seasonal fluctuations in tissue nitrogen, phosphorus, and N : P for five macroalgal species common to the Pacific northwest coast.J.Phycol. 28, 1-6.
- Wichard, T.,Charrier, B.,Mineur, F.,Bothwell, J.H., De Clerck, O., Coates, J.C. (2015). [Minireview]: The green seaweed Ulva: a model system to study morphogenesis. Front. Plant Sci 19 Februari 2015.
- Ye, N-h., Zhang, X-w., Mao, Y-z., Liang, Ch-w.,Xu, D.,et al. (2011). “Green tides” are overwhelming the coastline of our planet: taking the world’st largest example. Ecol.Res. 26, 477-485.
- Zapata, F.,and Roy, R.N. [editors] (2004).“FAO Fertilizer and Plant Nutrition Bulletin”; Use of phosphate rocks for sustainable agriculture; FAO corporate document repository."Use of phosphate rocks for sustainable agriculture". Originated by: Natural Resources Management and Environmental Department; ISBN: 92-5-105030-9.
- Zobrist, J. andStumm, W. (1981) Chemical dynamics of the Rhine catchment area in Switzerland, extrapolation to the 'pristine' Rhine River input to the ocean. In: Martin, J. M., Burton, J. D. and Eisma, D. (Eds) River Inputs to Ocean Systems. Proc. Workshop Rome, 26-30 March, 1979, UNEP, IOC, SCOR, 52-63.


