Keywords
Gut microbiome; Tilapia; Saponin; Mannose oligosaccharide
Introduction
The use of probiotics and prebiotics in aquaculture has increased tremendously in recent years as a sustainable alternative to the use of antibiotics. The main goal for administering probiotics (live microorganisms) or prebiotics (fermentation byproducts that promote the growth of beneficial microbes) is to manipulate the gut microbial community or gut microbiome to improve host fitness, mainly through the exclusion of opportunistic pathogens (Balcazar et al., 2006). In addition, the gut microbiome strongly influences fish health in other ways such as assisting in the development of the gut epithelium, providing essential nutrients, and stimulating the innate immune system (Nayak, 2010). Thus, alteration of the gut microbiome with probiotics or prebiotics may prevent disease through a variety of mechanisms. Until recently, the characterization of gut microbial communities in fish was biased due to the use of culture-dependent methods that vastly underestimated the species richness of the gut microbiome. The development of cost-effective next generation sequencing methods promoted the use of culture-independent methods resulting in detailed descriptions of these complex microbial communities. Nevertheless, the basal composition of the gut microbiome of important economic species such as Nile tilapia Oreochromis niloticus L. is still largely unknown. Several studies have analyzed the effects of different feed additives in the intestinal bacterial community of tilapia; however, those studies employed a fingerprint-based method (DGGE) suitable for identifying changes in the communities but without describing species composition (Pedrotti et al., 2015, He et al., 2011, Zhou et al., 2009, Liu et al., 2014).
Previda® is a commercial prebiotic composed primarily of mannose oligosaccharides that have been reported to improve growth, performance, and immunological responses in Pacific white shrimp (Anuta et al., 2014). Preliminary studies suggest Previda® also alters the gut microbiome in fish (Burr et al., 2012). Saponins are secondary plant compounds that have been tested in aquafeeds with different results. While some reports documented the toxic effect of saponin in fish and its negative effects to the gut epithelium (Knudsen et al., 2008), some studies concluded saponin promotes growth (Francis et al., 2005). Furthermore, saponin has been studied as a natural steroid to promote sex inversion to an all-male population, which could represent an alternative to the use of androgenic hormones in tilapia culture (Francis et al., 2002). The combined use of prebiotics such as Previda® that promotes intestinal health could offset the intestinal damages exerted by saponin. The objectives of this study were two-fold. First, we aimed at describing the gut microbiome of Nile tilapia fed standard diets using pyrosequencing. Second, we characterized the changes in the gut microbiome induced by feeding diets amended with Previda® and saponin.
Material and Methods
Diet preparation
Previda®, saponin, and their combination were supplemented as feed additives to a practical basal diet (Table 1). The basal diet was formulated to meet the nutritional requirements of tilapia containing 32% protein and 6% lipid (Ng and Romano, 2013). The diets contained 4% fishmeal and 3.4% menhaden fish oil to ensure nutritional quality of the diets and to mask any potential palatability problems due to the addition of the supplements. Previda® and saponin were added to the basal diet at 0.5% and 0.3% inclusion levels, respectively. Concentrations were chosen based on previously published data that showed an effect of Previda® in the gut microbiome of shrimp (Anuta et al., 2014) and the benefits of saponin in Nile tilapia diets (Francis et al., 2005). Experimental diets were prepared at the fish nutrition laboratory at the E. W. Shell Fisheries Center, Auburn University, Auburn, AL (USA) using standard practices. Briefly, pre-ground dry ingredients and fish oil were mixed in a food mixer (Hobart Corporation, Try, OH, USA) for 15 minutes. Hot water was blended into the mixture and then pelleted through a 3 mm die using the same mixer. Pelleted diets were dried in an oven to a moisture content of 8-10%, bagged, labeled, and stored at 4°C until feeding.
| |
Diets |
| Ingredients |
1
Basal |
2
Previda® |
3
Saponin |
4
Previda®+Saponin |
| Menhaden fishmeal1 |
4.00 |
4.00 |
4.00 |
4.00 |
| Soybean meal2 |
51.00 |
51.00 |
51.00 |
51.00 |
| Corn protein concentrate3 |
5.10 |
5.10 |
5.10 |
5.10 |
| Menhaden fish oil1 |
3.40 |
3.40 |
3.40 |
3.40 |
| Corn4 |
31.00 |
31.00 |
31.00 |
31.00 |
| Corn Starch5 |
0.90 |
0.40 |
0.60 |
0.10 |
| Trace mineral premix6 |
0.50 |
0.50 |
0.50 |
0.50 |
| Vitamin premix7 |
1.80 |
1.80 |
1.80 |
1.80 |
| Choline chloride5 |
0.20 |
0.20 |
0.20 |
0.20 |
| Stay C®8 |
0.10 |
0.10 |
0.10 |
0.10 |
| CaP-dibasic |
2.00 |
2.00 |
2.00 |
2.00 |
| Previda®9 |
0.00 |
0.50 |
0.00 |
0.50 |
| Saponin10 |
0.00 |
0.00 |
0.30 |
0.30 |
1Special Select, Omega Protein Inc., Reedville, Virginia, USA.
2De-hulled solvent extracted soybean meal, Faithway Feed Co. Inc., Guntersville, Alabama, USA.
3Empyreal 75, Cargil Corn Milling, Blair, Nebraska.
4Yellow corn, Faithway Feed Co., Guntersville, AL, USA.
5MP Biochemicals Inc., Solon, Ohio, USA.
6Trace Mineral premix(g/100 g), cobalt chloride 0.004, cupric sulphate pentahydrate 0.250, ferrous sulfate 4.0, magnesium sulfate heptahydrate 28.398, manganous sulphate monohydrate 0.650, potassium iodide 0.067, sodium selenite 0.010, zinc sulfate heptahydrate 13.193, filler 53.428.
7Contained (as g/kg premix): thiamin-HCl, 0.438; riboflavin, 0.632; pyridoxine-HCl, 0.908; D-pantothenic acid, hemicalcium salt, 1.724; nicotinic acid, 4.583; biotin, 0.211; folic acid, 0.549; vitamin B12, 0.001; inositol, 21.053; menadione sodium bisulfite, 0.889; vitamin A acetate (500,000 IU/g), 0.677; vitamin D3 (1,000,000 IU/g), 0.116; DL-alpha-tocopheryl acetate (250 IU/g), 12.632; alphacellulose, 955.589.
8Stay C® (L-ascorbyl-2-polyphosphate 35% Active C), DSM Inc., Parsippany, NJ, USA.
9Previda®, Novus Nutrition Brands LLC, St Charles MO.
10Alfa Aesar, A Hohnson Matthey Compnay, Saponin, A18820 lot 10170564. Haverhill, MA.
Table 1: Composition (g/100 g) of experimental diets designed to contain 32% protein and 6% lipid.
Fish husbandry and experimental conditions
All male Nile tilapia juveniles (n=250, mean weight=4.10 ± 0.74 g; mean length=5.2 ± 0.3 cm) were obtained from E. W. Shell Fisheries Center at North Auburn Fisheries Experiment Station and transported to the Aquatic Microbiology Laboratory (AML) on main campus in aerated containers. Upon arrival to AML, fish were stocked into 37 L glass aquaria/tanks at a stocking rate of 12 fish/tank. Ten randomly-selected individuals were used to estimate weight and length and also to check for common fish pathogens according to standard protocols (USFWS and FS-FHS, 2012). Fish were acclimated for 10 days and fed the basal diet at 2% body weight daily. Each tank contained an individual biofilter and an air stone. Water was prepared with 340 g of Marine Salt (Seachem, Madison, Georgia) diluted in 10 L of deionized water to make the primary salt stock. For tank use, 0.6 g of CaCO3, 1.4 g of NaHCO3, 0.17 g NH4Cl (5 ppm) and 90 ml of the stock were mixed into each tank with deionized water. Water quality was checked daily to maintain established parameters (80 ppm alkalinity, 40 ppm hardness, 0.1 ppt salinity, 27 ± 1°C, pH 7.8 ± 0.2 [mean ± standard error], ammonia and nitrites were nondetectable). After the acclimation period, tanks (5 replicates) were randomly assigned to each experimental diet (4 treatments). All treatment groups were fed at the same fixed rate of 2% body weight for two weeks. All animal protocols were approved by the Auburn University Institutional Animal Care and Use Committee.
Sample collection and DNA extraction
After two weeks of dietary conditioning, 10 fish were randomly removed from each tank and immediately euthanized with 300 mg/L tricaine methanesulfonate. Fish (n=200, mean weight=5.49 ± 0.14 g; mean length=5.3 ± 0.5 cm) were measured to observe possible changes in growth over the course of the experiment. The gastrointestinal tract from the posterior stomach to the anus was aseptically removed from each individual, and the gut content (feces) was squeezed from the intestine to be immediately processed for DNA extraction. Gut contents from 10 individual fish (from the same tank) were pooled together into one sample for gut microbiome analysis. Pooling of samples was necessary to obtain sufficient material for DNA extraction. Each diet treatment group was thus represented by 5 replicates. DNA extraction followed previously published protocols (Larsen et al., 2014b). Briefly, gut content was homogenized using a handheld tissue homogenizer to ensure uniform sample distribution. DNA was extracted from samples of approximately 200 mg (Ave. 205 ± 21.5 mg) using the DNA isolation for pathogen detection protocol included in the QIAamp DNA Stool Mini Kit (Qiagen, Valencia, CA). The manufacturer’s protocol was used with only minor deviations from standard protocols. During the elution step (Step 17) of this protocol, only 50 μl of buffer AE was used rather than the suggested 200 μl to prevent excessive dilution of the DNA products (Qiagen 2001).
Sequencing
Roche titanium 454 sequencing was performed on 20 samples (5 replicates per diet treatment) using individual barcodes and primer 27F (5-AGRGTTTGATCMTGGCTCAG-3’) amplifying the variable V1-V3 region of the 16S rRNA. PCR conditions were as follows: initial denaturation at 94°C for 3 min and 30 cycles of 94°C for 30 s, 53°C for 40 s, and 72°C for 1 min, including a final elongation at 72°C for 5 min. Resulting sequences were processed with an exclusive analysis pipeline (MR DNA, Shallowater, TX) including removal of barcodes and primers as well as sequences of less than 200 base pairs, a base call error rate of less than 0.3% (Q<25), ambiguous base calls, and long (>6 base pairs) stretches of identical bases. Following denoising along with chimera and singleton sequence removal, operational taxonomic units (OTUs) were defined in agreement with the current accepted prokaryotic species concept (>3% sequence agreement; (Rossello-Mora and Amann, 2001)) and taxonomically identified using BLASTn against the Greengenes database (DeSantis et al., 2006).
Data analysis
After standardization of each sample type to the sample yielding the least number of total sequences, Mothur v.1.33.3 (Schloss et al., 2009) was used to generate rarefaction curves and to calculate diversity statistics including Good’s coverage, Shannon Evenness Index (SEI), abundance-based coverage estimation (ACE), Chao1, observed OTUs, and shared OTUs. SAS 9.2 was used to run one-way ANOVAs with Tukey’s multiple comparison tests (α=0.05) in order to determine differences in species richness (in observed OTUs) and species evenness (SEI) between samples (diet treatments). OTU tables including all samples were loaded into Primer v6 for clustering using group averages and ANOSIM analysis. Genera tables were also loaded into Primer for similarity percentages (SIMPER) analysis in order to determine specific taxonomical differences between communities.
Results
Water quality, growth and survival
All water quality parameters remained within established limits throughout the study. Diets containing saponin (both saponin-only and mixed treatments) resulted in fecal pellets of softer consistency when compared to controls. The Previda® treatment did not result in any obvious morphological changes of the fecal pellets. After two weeks of feeding, the average fish weight increased significantly (when all treatments were taken into consideration), but length remained statistically identical. Final averages for length and weight were 5.33 ± 0.51 cm and 5.49 ± 1.37 g, respectively. Neither final weight nor length was different between diet treatments. No mortalities were observed during the study.
Analysis of tilapia gut microbiome
A total of 281,349 bacterial sequences were obtained from the tilapia gut microbiome by pyrosequencing. Overall, 345 OTUs were identified from all 20 samples analyzed including four diet treaments with five replicates each. In order to accurately compare species richness and evenness, sequences were standardized to the lowest number of obtained sequences (n=4,915) among the 20 samples for a total of 98,300 sequences and 331 OTUs. Analysis of Good’s coverage indicated sequence coverage was ≥ 98% for all samples (Table 2). Figure 1 shows the rarefaction curves obtained from all diet treatments. A good coverage of the gut microbiome was achieved in all cases regardless of the treatment. One-way ANOVA with Tukey’s multiple comparison tests showed no significant differences between diet treatments, neither in the expected richness (ACE and Chao1) nor in evenness (SEI). All diet treatments exhibited relatively high overlap of OTUs with 45% of OTUs being shared between all four diets (Figure 2). A similar number of unique OTUs present only in basal (n=20), Previda® (n=22), and saponin (n=18) diets were also identified. Interestingly, the mixed diet also resulted in gut microbiomes with unique OTUs (n=12).
| |
# Predicted OTUs |
|
| Sample ID |
# Observed OTUs |
ACE |
Chao1 |
Shannon evenness |
Good's coverage |
| B1 |
139 |
190 |
182 |
0.595 |
0.991 |
| B2 |
141 |
269 |
224 |
0.527 |
0.989 |
| B3 |
128 |
173 |
161 |
0.552 |
0.991 |
| B4 |
132 |
187 |
181 |
0.564 |
0.991 |
| B5 |
130 |
226 |
167 |
0.551 |
0.991 |
| P1 |
133 |
201 |
172 |
0.634 |
0.992 |
| P2 |
118 |
190 |
151 |
0.543 |
0.992 |
| P3 |
119 |
162 |
152 |
0.556 |
0.992 |
| P4 |
133 |
226 |
201 |
0.568 |
0.99 |
| P5 |
135 |
283 |
216 |
0.572 |
0.989 |
| M1 |
135 |
185 |
189 |
0.555 |
0.991 |
| M2 |
132 |
230 |
188 |
0.59 |
0.99 |
| M3 |
149 |
285 |
229 |
0.605 |
0.988 |
| M4 |
127 |
184 |
191 |
0.543 |
0.99 |
| M5 |
121 |
233 |
178 |
0.55 |
0.99 |
| S1 |
131 |
165 |
166 |
0.561 |
0.992 |
| S2 |
127 |
182 |
186 |
0.513 |
0.99 |
| S3 |
137 |
271 |
243 |
0.552 |
0.989 |
| S4 |
146 |
261 |
216 |
0.587 |
0.989 |
| S5 |
139 |
189 |
176 |
0.534 |
0.991 |
Table 2: Diversity indices generated by Mothur software. OTUs are defined at 97% sequence similarity. B-Basal diet; P-Previda® diet; M-Mixed diet; S-Saponin diet.
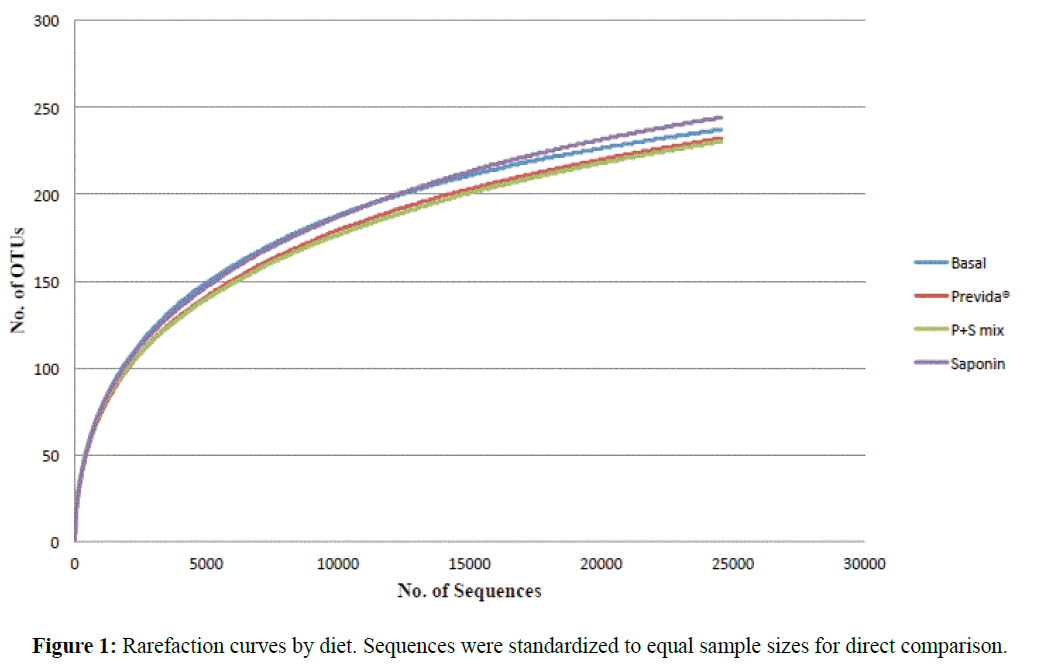
Figure 1: Rarefaction curves by diet. Sequences were standardized to equal sample sizes for direct comparison.
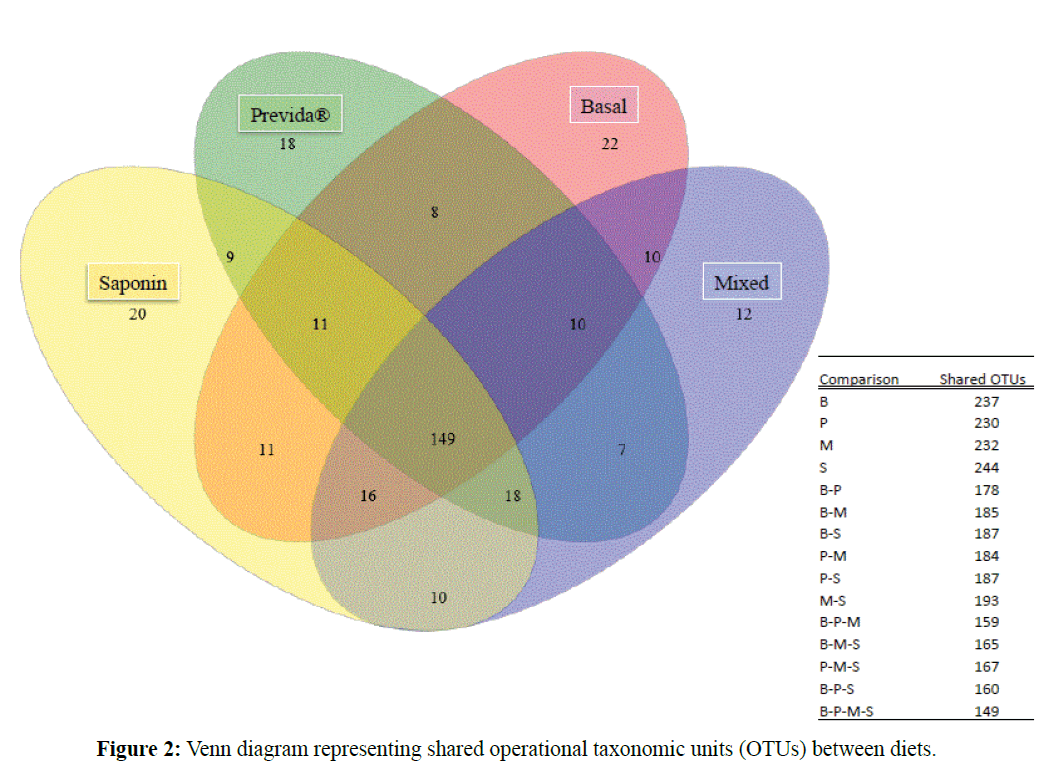
Figure 2: Venn diagram representing shared operational taxonomic units (OTUs) between diets.
Gut microbiome composition
Sequencing analysis revealed the gut microbiome of tilapia was composed of six bacterial phyla (i.e., Fusobacteria, Bacteroidetes, Proteobacteria, Firmicutes, Planctomycetes, and Actinobacteria) (Figure 3). Out of the six phyla, only three (Fusobacteria, Bacteroidetes, and Proteobacteria) were shared between all four treatment groups. While the relative abundances of these phyla varied somewhat between the four, all diets were individually dominated by the phylum Fusobacteria (≥ 81%) followed by Bacteroidetes (≥ 5.9%) and Proteobacteria (≥ 0.1%). The three less common phyla, Actinobacteria, Firmicutes, and Planctomycetes, showed varying abundances between the four diets. Actinobacteria were found in all treatments with the exception of the saponin diet. Firmicutes and Planctomycetes were both found in the basal diet; however, Planctomycetes was unique to the gut microbiome associated with the mixed diet, while the phylum Firmicutes was unique to the gut microbiome of saponin fed fish.
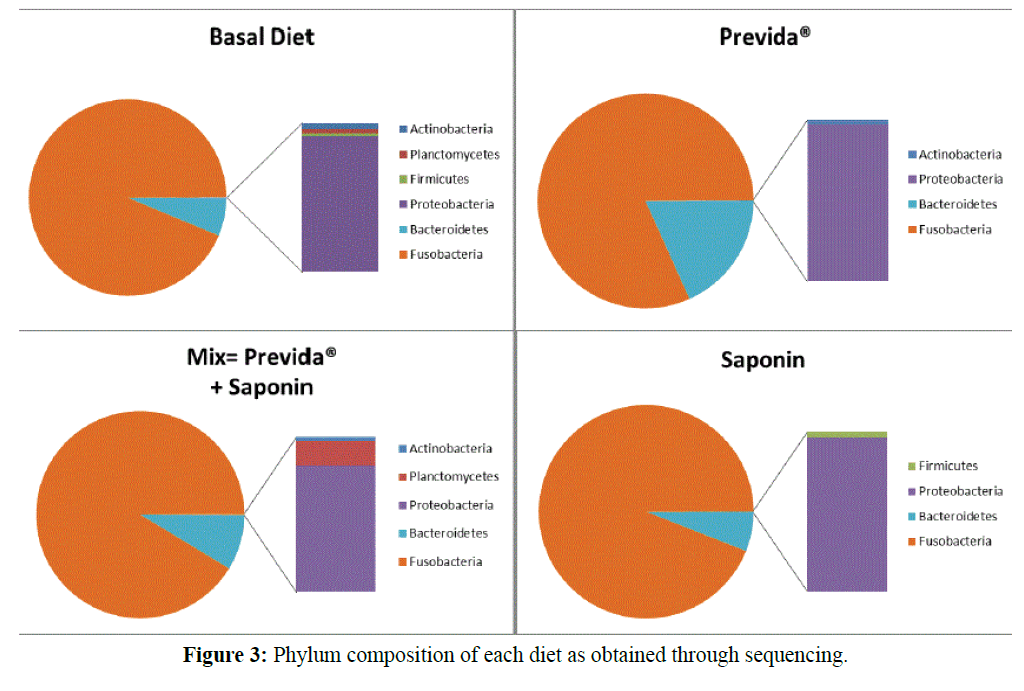
Figure 3: Phylum composition of each diet as obtained through sequencing.
Out of 26 identified genera, only five were found to be present among all four diet treatments (i.e. Barnesiella, Cetobacterium, Parabacteroides, Plesiomonas, and Pseudomonas) (Table 3). The genus Cetobacterium was vastly represented and accounted for 90% of the total OTUs found in all analyzed samples. One species in particular, Cetobacterium somerae, dominated the Nile tilapia gut microbiome representing 76% of the total sequences. Barnesiella was the second most abundant genus comprising 6.86% of all sequences.
| Classification |
|
|
|
Abundance % (within diets) |
| Phylum |
Class |
Family |
Genus |
Basal |
Previda |
S+P mix |
Saponin |
| |
|
Shared Groups |
|
|
|
|
|
| Fusobacteria |
Fusobacteria |
Fusobacteriaceae |
Cetobacterium |
93.57% |
81.63% |
91.21% |
93.94% |
| Bacteroidetes |
Bacteroidia |
Porphyromonadaceae |
Parabacteroides |
3.00% |
3.93% |
2.56% |
1.91% |
| Bacteroidetes |
Bacteroidetes |
Porphyromonadaceae |
Barnesiella |
3.23% |
14.32% |
6.05% |
3.99% |
| Proteobacteria |
γ-Proteobacteria |
Enterobacteriaceae |
Plesiomonas |
0.08% |
0.08% |
0.09% |
0.05% |
| Proteobacteria |
γ-Proteobacteria |
Pseudomonadaceae |
Pseudomonas |
0.03% |
0.01% |
0.02% |
0.06% |
| |
|
Unique Groups |
|
|
|
|
|
| Fusobacteria |
Fusobacteria |
Fusobacteriaceae |
Fusobacterium |
0.00% |
0.01% |
0.00% |
0.00% |
| Bacteroidetes |
Flavobacteria |
Flavobacteriaceae |
Cloacibacterium |
0.00% |
0.01% |
0.00% |
0.00% |
| Bacteroidetes |
Flavobacteria |
Flavobacteriaceae |
Marixanthomonas |
0.00% |
0.00% |
0.00% |
0.01% |
| Bacteroidetes |
Flavobacteria |
Cryomorphaceae |
Owenweeksia |
0.00% |
0.00% |
0.00% |
0.01% |
| Bacteroidetes |
Sphingobacteria |
Chitinophagaceae |
Niabella |
0.01% |
0.00% |
0.00% |
0.00% |
| Proteobacteria |
α-Proteobacteria |
Rickettsiales |
CandidatusCaptivus |
0.00% |
0.00% |
0.00% |
0.01% |
| Proteobacteria |
α-Proteobacteria |
Sphingomonadaceae |
Novosphingobium |
0.03% |
0.00% |
0.00% |
0.00% |
| Proteobacteria |
α-Proteobacteria |
Rickettsiaceae |
Orientia |
0.00% |
0.00% |
0.01% |
0.00% |
| Proteobacteria |
β-Proteobacteria |
Comamonadaceae |
Acidovorax |
0.01% |
0.00% |
0.00% |
0.00% |
| Proteobacteria |
β-Proteobacteria |
Neisseriaceae |
Deefgea |
0.00% |
0.00% |
0.00% |
0.00% |
| Proteobacteria |
β-Proteobacteria |
Burkholderiaceae |
Polynucleobacter |
0.00% |
0.00% |
0.03% |
0.00% |
| Proteobacteria |
γ-Proteobacteria |
Moraxellaceae |
Acinetobacter |
0.01% |
0.00% |
0.00% |
0.00% |
| Proteobacteria |
γ-Proteobacteria |
Xanthomonadaceae |
Arenimonas |
0.00% |
0.00% |
0.00% |
0.00% |
| Proteobacteria |
γ-Proteobacteria |
Enterobacteriaceae |
Klebsiella |
0.02% |
0.00% |
0.00% |
0.01% |
| Actinobacteria |
Actinobacteria |
Frankiales |
Frankia |
0.01% |
0.00% |
0.00% |
0.00% |
| Actinobacteria |
Actinobacteria |
Micrococcaceae |
Micrococcus |
0.00% |
0.00% |
0.00% |
0.00% |
| Actinobacteria |
Actinobacteria |
Mycobacteriaceae |
Mycobacterium |
0.00% |
0.00% |
0.00% |
0.00% |
| Firmicutes |
Bacilli |
Staphylococcaceae |
Jeotgalicoccus |
0.00% |
0.00% |
0.00% |
0.01% |
| Firmicutes |
Clostridia |
Clostridiaceae |
Sarcina |
0.00% |
0.00% |
0.00% |
0.00% |
| Planctomycetes |
Planctomycetacia |
Planctomycetaceae |
Rhodopirellula |
0.01% |
0.00% |
0.00% |
0.00% |
| Planctomycetes |
Planctomycetacia |
Planctomycetaceae |
Singulisphaera |
0.00% |
0.00% |
0.03% |
0.00% |
Table 3: Genus identity of sequences represented by percentage from the total sequences obtained for each diet.
When the gut microbiome composition was compared between different diet treatments, no significant differences were observed. ANOSIM analysis of OTU data for all samples indicated high similarity between all diets with a global R value of -0.022 at a significance level of 55.4% (p=0.554). Therefore, diet treatments did not significantly alter the tilapia gut microbiome. The effect of the different diets on the gut microbiome, if any, was outweighed by the variability between replicates within each treatment (tank effect). The variability observed among replicates is displayed in Figure 4. The lack of clarity in clustering was supported by statistical analysis. Likewise, SIMPER analysis of bacterial phyla and genera showed high similarity among the diet treatments (Table 4). At the phylum level, the main difference between diets was due to varying abundances of Fusobacteria and Bacteroidetes. At the genus level, most of the differences between groups were associated with varying abundances of Cetobacterium and Barnsiella. Parabacteroides also contributed to variations between diet treatments but to a lesser extent than those previously mentioned.
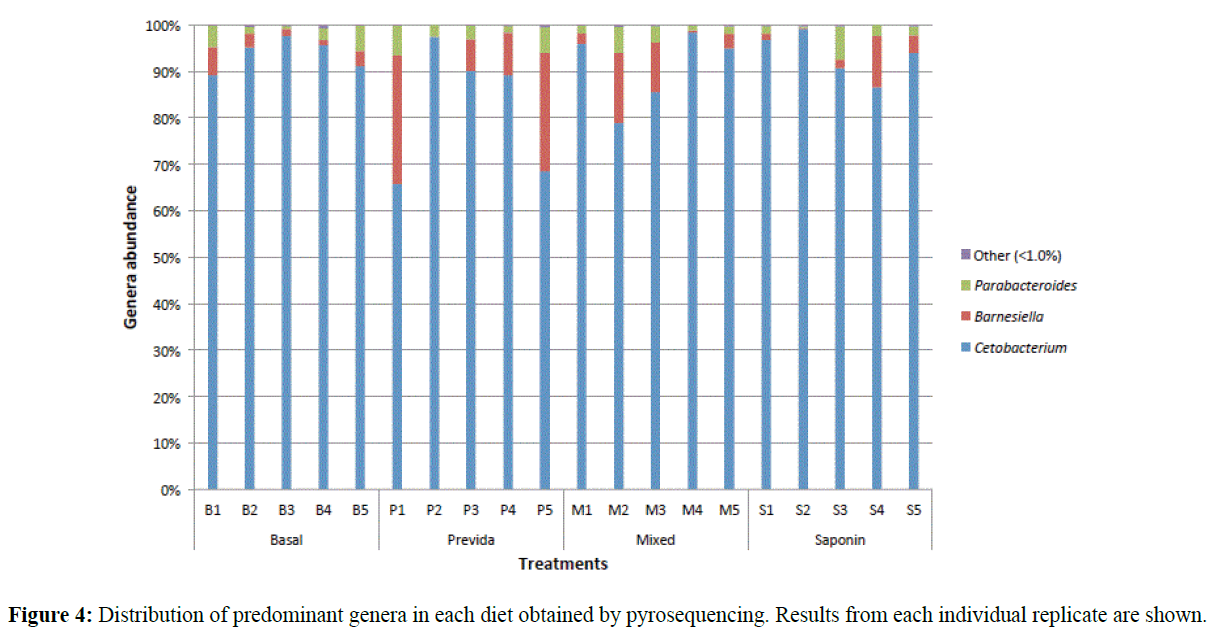
Figure 4: Distribution of predominant genera in each diet obtained by pyrosequencing. Results from each individual replicate are shown.
| Groups (I and II) |
Overall average dissimilarity |
Bacterial Genus |
Group I average abundance |
Group II average abundance |
Contribution to Dissimilarity (%) |
| B and P |
13.85 |
Cetobacterium |
15051 |
11540 |
47.33 |
| |
|
Barnesiella |
519 |
2024 |
43 |
| B and M |
7.03 |
Cetobacterium |
15051 |
12434 |
47.2 |
| |
|
Barnesiella |
519 |
824 |
35.79 |
| |
|
Parabacteroides |
482 |
349 |
14.34 |
| P and M |
13.84 |
Cetobacterium |
11540 |
12434 |
49.32 |
| |
|
Barnesiella |
2024 |
824 |
41.73 |
| B and S |
5.19 |
Cetobacterium |
15051 |
11663 |
43.04 |
| |
|
Barnesiella |
519 |
495 |
30.44 |
| |
|
Parabacteroides |
482 |
237 |
23.04 |
| P and S |
14.2 |
Cetobacterium |
11540 |
11663 |
47.35 |
| |
|
Barnesiella |
2024 |
495 |
42.59 |
| |
|
Parabacteroides |
556 |
237 |
9.12 |
| M and S |
7.59 |
Cetobacterium |
12434 |
11663 |
47.1 |
| |
|
Barnesiella |
824 |
495 |
36.32 |
| |
|
Parabacteroides |
349 |
237 |
14.48 |
Table 4: Sequences contributing to the dissimilarity observed between the bacterial communities in pairwise comparisons (B, basal diet; P, Previda®; M, mixed diet; S, saponin).
Discussion
Nile tilapia is the most commonly cultured tilapia species worldwide and one of the most extensively studied aquaculture species (FAO, 2010). Recently, several studies have looked at what factors shape and modulate the development of the tilapia gut microbiome (Giatsis et al., 2015, Giatsis et al., 2014). During early ontogenetic stages, while the gut is not fully developed, the effects of environmental factors such as water physicochemical parameters are stronger. Those studies concluded that water in the rearing tanks is the primary source for bacteria found in the tilapia gut. However, little information is available on how the mature gut microbiota in tilapia responds to external factors including the use of prebiotics and feed supplements.
The results of this study showed that the gut microbiota of our experimental Nile tilapia was dominated by the phylum Fusobacteria, specifically by the genus Cetobacterium. In the control diet, more than 90% of the OTUs were ascribed to this genus. This result is in agreement with previous data from omnivorous warmwater fish species collected from the wild (Larsen et al., 2014b). Although percent of abundance was not specified, the study by Ran et al. (2015) also showed Firmicutes as one of the predominant phyla in Nile tilapia reared in aquaculture facilities (Ran et al., 2015). However, other studies have shown that Firmicutes account for >90% of the gut microbiota in Nile tilapia (Standen et al., 2015). Discrepancies in microbiota composition can be due to how the animals were raised and fed, the analysis of autochthonous versus allochthonous bacterial communities, the methodology used for DNA extraction, and sequencing platform and pipeline data analysis (Ringo et al., 2015, Larsen et al., 2014b).
Diets amended with Previda®, saponin, and a combination of the two resulted in no significant changes to the gut microbiome or growth rates of Nile tilapia after two weeks of dietary conditioning. This was unexpected in the case of saponin as the fecal pellets exhibited a much softer consistency than those from other diets. The overwhelming predominance of the genus Cetobacterium and the observed variability among replicates probably masked any subtle effect of the diets in the gut microbiome. Clearly, Cetobacterium was not significantly affected by any of the feed additives. The only observed trend was on diets containing Previda® that did appear to show an increase in populations of Barnesiella with corresponding decreases in the numbers of Cetobacterium. However, only two of the five replicates had a significant increase of Barnesiella numbers. If this trend is correct, it may suggest the treatment regimens and/or durations may not have been adequate to allow for significant changes to occur.
Several studies have examined the effects of Previda® on growth, immune response, and the gut microbiome of various aquatic species with mixed results (Burr et al., 2012, Anuta et al., 2014, Zhou et al., 2010). As with the present study, the work by Anuta et al. (2014) found no significant differences in growth rates, weight gain, or survival of test organisms, but gut communities between control and Previda® appeared different (microbial community data were not statistically analyzed). Zhou et al. (2010) found that red drum, Sciaenops ocellatus, fed with Previda® had significantly improved weight gain and immunological response when compared to basal diets and other commercial prebiotics, but the composition of the gut microbiome was not analyzed in the study.
The high abundance of C. somerae in our experimental tilapia, as well as other previously analyzed freshwater fishes (Larsen et al., 2014a, Li et al., 2015), fuels questions about the functional relationship between this bacterium and its host. C. somerae was originally isolated from the feces of children with late-onset autism that were being treated with vancomycin (Finegold et al., 2003, Tsuchiya et al., 2008). Strains have been found to be capable of producing B12 at relatively high rates across different fish species (Sugita et al., 1991). Studies have suggested fishes with predominant populations of some obligate anaerobes, such as C. somerae, are less likely to suffer from signs of B12 deficiency when fed diets lacking B12. Based on their collections, Sugita et al. (1991) reported that C. somerae could be isolated from carp (Cyprinus carpio), tilapia, goldfish (Carassius auratus), and ayu (Plecoglossus altivelis), but not from Japanese eel (Anguilla japonica) or channel catfish (Ictalurus punctatus). C. somerae was found most frequently in tilapia and carp, which have been shown to not require B12 supplementation in diets suggesting that C. somerae plays an important role in B12 production (Sugita et al., 1991).
Barnesiella was the second most common genus found in samples comprising 6.87% of all sequences. To our knowledge, this is the first known report of this genus in fishes. In humans and mice, Barnesiella has been demonstrated to show promise in the reduction or elimination of vancomycin-resistant Enteroccoccus faecium (Ubeda et al., 2013), but little is known about other functional roles that this genus might play in the host gastrointestinal tract.
The present study showed a relatively low diversity of the gut microbiome in our experimental Nile tilapia. This can be due to several factors including genetic lineage, rearing conditions, and feeding regimes. It is noteworthy that a low diversity translated into a resilient community that did not significantly change when modified diets were applied. It is plausible that the duration of the study might have been too short to allow for significant bacterial change to occur. Another explanation is that once the gut matures and the gut communities get established they become harder to modify than those during the early stages of development. Future studies should evaluate the use of prebiotics at different ontogenetic stages to determine the best window to exert the maximum effect on the gut communities while they are being formed.
Acknowledgements
This work was funded by the Southeastern Cooperative Fish Disease and Parasite Project at Auburn University. We thank the management team of the E. W. Shell Fisheries Center, North Auburn research station for their support. Candis Ray thanks the Cell and Molecular Biology Program at Auburn University for partially funding her graduate research scholarship. Noemi Bujan thanks the Spanish Ministry of Science and Higher Education for supporting her study abroad fellowship. We thank Novus International Inc. for providing the Previda® used in the study.
18456
References
- Anuta, J.D., Buentello, J.A., Patnaik, S., Hume, M.E., Mustafa, A. (2014) Effects of dietary supplementation of a commercial prebiotic Previda® on survival, growth, immune responses and gut microbiota of Pacific white shrimp, Litopenaeusvannamei. Aquacult Nutrition.
- Balcazar, J.L., De Blas, I., Ruiz-Zarzuela, I., Cunningham, D., Vendrell, D. et al. (2006)The role of probiotics in aquaculture. Veterinary Microbiology114, 173-186.
- Burr, G., Wolters, W.R., Barrows, F., Hume, M.E., Hopkins, A. (2012) Evaluation of the prebiotic, Previda, on performance characteristics, intestinal microbial community, immune function and intestinal tract morphology of atlantic salmon (Salmosalar). Aquacult America Conference. Las Vegas, NE.
- Desantis, T.Z., Hugenholtz, P., Larsen, N., Rojas, M., Brodie, E.L. et al. (2006) Greengenes, a chimera-checked 16S rRNA gene database and workbench compatible with ARB.Applied and Environmental Microbiology72, 5069-5072.
- Food and Agriculture Organization of the United Nations (FAO) (2010)The state of world fisheries and aquaculture.
- Finegold, S.M., Vaisanen, M.L., Molitoris, D.R., Tomzynski, T.J., Song, Y.L. et al. (2003)Cetobacteriumsomerae sp. nov.from human feces and emended description of the genus Cetobacterium. Systematic and Applied Microbiology 26, 177-181.
- Francis, G., Levavi-Sivan, B., Avitan, A., Becker, K. (2002) Effects of long term feeding of Quillajasaponins on sex ratio, muscle, and serum cholesterol and LH levels in Nile tilapia (Oreochromisniloticus L.). Comparative Biochemistry and Physiology 133, 593-603.
- Francis, G., Makkar, H.P.S., Beck, K. (2005)Quillajasaponins- a natural growth promoter for fish. Animal Feed Science and Technology121, 147-157.
- Giatsis, C., Sipkema, D., Smidt, H., Heilig, H., Benvenuti, G. et al. (2015)The impact of rearing environment on the development of gut microbiota in tilapia larvae. Scientific Reports.
- Giatsis, C., Sipkema, D., Smidt, H., Verreth, J., Verdegem, M. (2014)The colonization dynamics of the gut microbiota in tilapia larvae. PLoS One9, e103641.
- He, S., Zhou, Z., Meng, K., Zhao, H., Yao, B. et al. (2011) Effects of dietary antibiotic growth promoter and Saccharomyces cerevisae fermentation product on production, intestinal bacterial community, and nonspecific immunity of hybrid tilapia (Oreochromisniloticus female x O. aureus male). J of Animal Sci89, 84-92.
- Knudsen, D., Jutfelt, F., Sundh, H., Sundell, K., Koppe, W. et al. (2008) Dietary soya saponins increase gut permeability and play a key role in the onset of soyabean-induced enteritis in Atlantic salmon (Salmon salar L.). British J of Nutrition100, 120-129.
- Larsen, A.M., Mohammed, H.H., Arias, C.R. (2014a) Characterization of the gut microbiota of three commercially valuable warmwater species. J of Applied Microbiol116, 1396-1404.
- Larsen, A.M., Mohammed, H.H., Arias, C.R. (2014b) Comparison of DNA extraction protocols for the analysis of gut microbiota in fishes. Fems Microbiology Letters 362, p:031.
- Li, T., Long, M., Gatesoupe, F.J., Zhang, Q., Li, A. et al. (2015) Comparative analysis of the intestinal bacterial communities in different species of carp by pyrosequencing. Microbial Ecol69.
- Liu, W.S., Ren, P.F., He, S.X., Xu, L., Yang, Y.L. et al. (2014) Comparison of adhesive gut bacteria composition, immunity, and disease resistance in juvenile hybrid tilapia fed two different Lactobacillus strains. Fish and Shellfish Immunology35, 54-62.
- Nayak, S.K. (2010) Role of gastrointestinalmicrobiota in fish. Aquacult Res 41, 1553-1573.
- Ng, W., Romano, N. (2013) A review of the nutrition and feeding managment of farmed tilapia throughout the culture cycle. Reviews in Aquacul5, 220-254.
- Pedrotti, F.S., Davies, S., Merrifield, D.L., Marques, M.R.F., Fraga, A.P.M. et al. (2015)The autochthonous microbiota of the freshwater omnivores jundia (Rhamdiaquelen) and tilapia (Oreochromisniloticus) and the effect of dietary carbohydrates. Aquacult Res 46, 472-481.
- Ran, C., Huang, L.M., Liu, Z., Yang, Y., Tacon, P. et al. (2015) A comparison of the benefitial effects of live and heat-inactivated baker's yeast on Nile tilapia: suggestions on the role and function of the secretory metabolites released from the yeast. PLoS One.
- Ringo, E., Zhou, Z., Vecino, J.L.G., Wadsworth, S., Romero, J. et al. (2015) Effect of dietary components on the gut microbiota of aquatic animals: the never-ending story?Aquacult Nutrition 22, 219-282.
- Rossello-Mora, R., Amann, R. (2001)The species concept for prokaryotes. FEMS MicrobiolRev25, 39-67.
- Schloss, P.D., Westcott, S.L., Ryabin, T., Hall, J.R., Hartmann, M. et al. (2009) Introducing Mothur: Open-source, platform-independent, community-supported software for describing and comparing microbial communities.Appland EnvironMicrob75, 7537-7541.
- Standen, B.T., Rodiles, A., Peggs, D.L., Davies, S.J., Santos, G.A. et al. (2015) Modulation of the intestinal microbiota and morphology of tilapis, Oreochromisniloticus, following the application of a multi-species probiotic. ApplMicrobiolBiot99, 8403-8417.
- Sugita, H., Miyajima, C., Deguchi, Y. (1991)The vitamin-B12-producing ability of the intestinal microflora of freshwater fish. Aquacult92, 267-276.
- Tsuchiya, C., Sakata, T., Sugita, H. (2008) Novel ecological niche of Cetobacteriumsomerae, an anaerobic bacterium in the intestinal tracts of freshwater fish.LettApplMicrobiol46, 43-48.
- Ubeda, C., Bucci, V., Caballero, S., Djukovic, A., Toussaint, N.C. (2013) Intestinal microbiota containing Barnesiella species cures vancomycin-resistant Enterococcus faecium colonization. Infect and Immun81, 965-973.
- US fish and wildlife Service (Usfws/Fs-Fhs) (2012) Standard procedures for aquatic animal health inspections. FHS blue book: suggested procedures for the detection and identification of certain finfish and shellfish pathogens, Bethesda, Maryland: AFS.
- Zhou, Q.C., Buentello, J.A., Gatling, D.M.I. (2010) Effects of dietary prebiotics on growth performance, immune response and intestinal morphology of red drum (Sciaenopsocellatus). Aquacult309, 253-257.
- Zhou, Z.G., Liu, Y.C., He, S.X., Shi, P.J., Gao, X.H. et al. (2009) Effects of dietary potassium diformate (KDF) on growth performance, feed conversion, and intestinal bacterial community of hybrid tilapia (Oreochromisniloticus female x O. aureus male). Aquacult291, 89-94.


