Keywords
Hanging ratio; Slack netting; Length frequency distribution; Fishing efficiency; Cost efficiency; Index of economic efficiency
Introduction
The shape of a mesh size is controlled by the hanging ratio (Cullenberg, 1987; Holst et al., 1994) and is one of the most important factors affecting yield and selectivity of gillnets (Clarke, 1960; Hamley 1975; Parsa et al., 2014). The effect of hanging ratio of the net on catch efficiency was studied by many authors. Nomora (1978) reported that, the most suitable hanging ratio for gillnets ranged between 0.3 and 0.5 and Machiele et al. (1994) confirmed that 0.5 hanging ratio was more efficient than 0.25. Blackiel and Welcome (1980) noted that gillnets of hanging ratio 0.5 were more effective than gillnets of 0.67 but Parsa et al. (2014) showed that there was no significant difference between nets of 0.5 and 0.6 hanging ratio as both had similar effect on the fishery. Karslen and Bjarnasson (1986) also contradicted Nomura and showed that the most suitable hanging ratios were rather between 0.5 and 0.8.
Thomas (2001) found a typical gillnet to have a hanging ratio of 0.5 to 0.7 and suggested a hanging ratio of 0.5 and above suitable for gilling and entangling of varying sizes and types of tropical fish. Gabis (2012) however reported a typical hanging ratio used in commercial fishing ranges from 0.3 to 0.7. Synthesizing all these reports, it could be suggested that 0.5 is the typical hanging ratio in many commercial fisheries of the world and could be referred to as the standard against which the effect of others could be assessed for relative catching or fishing efficiency (Fridman, 1986). Fridman, stated that, in order to quantify relative catching or fishing efficiency of a new or experimental fishing gear, it should be done by comparing catches obtained by the given gear with catches obtained by a standard fishing gear used in common practice provided the catches are taken in the same area, under the same fishing conditions and more or less at the same time. Consequently using the catch values of gillnets with various hanging ratios or technical improvements compared with the catch of the standard gillnet (with hanging ratio of 0.5) it was possible to assess the fishing efficiency of the other net types in the fishery.
Fridman also assessed the economic efficiency of fishing systems, by comparing the cost characteristics of the systems with that of the standard to come out with an index of economic efficiency. The index was considered a measure of the degree of economic improvements of the new or the experimental fishing gear over the standard system.
Abundant literature was available on efficiency evaluations of various gillnet types with the same or equal hanging ratios at the top and down ropes (Baranov, 1948; Riedel, 1963; Miyazaki, 1964; Ishida, 1969) but scanty to no report was cited on evaluation of gillnets with unequal or different hanging ratios at the top and down ropes. The inadequacy pointed to an opportunity to be explored for possible further enhancement of efficiency of gillnets by assessing the performances of these gillnet types with unequal hanging ratios. However for a successful efficiency evaluation it was imperative to test the performances of these gillnet types as against the known and established gillnets with same hanging ratios, at the top and down ropes, under the same fishing conditions, for possible technical and economic superiority.
The objective of the study was to determine whether gillnet types with different hanging ratios at the top and down ropes, could constitute a superior intervention for enhancement of efficiency of monofilament gillnets over the usual gillnet types with same hanging ratio at the top and down ropes. To achieve this, a comparative investigation was conducted to ascertain the technical and economic efficiencies of gillnet types with different as against same, hanging ratios at the top and down ropes, by determining principally the; fishing efficiency, cost efficiency and the index of economic efficiency, compared with a standard gillnet with a hanging ratio of 0.5 at the top and down ropes. To meet the conditions stipulated for efficiency tests, all the experimental net types were subjected to same, fishing conditions, dimension, netting material, mesh size, and tied together as if they were one single long net.
Materials and Methods
Materials
Five gillnet types and a standard gillnet were used for the experiment (Figures 1 and 2). The common gillnet with a hanging ratio (E) of 0.5, at the top and down ropes, was considered the standard and designated B. Net types D and F were of different hanging ratios, at the top and down ropes while C and E were of same ratios. Gillnet type A, was a frame net with same hanging ratio, at the top and down ropes, as the standard net and included to test whether due to its different make, could affect the outcome. All six gillnet types were constructed of same hang length 89.1 m, stretched mesh size of 7.62 cm, and netting material (PA Mono Ø 0.2 mm).
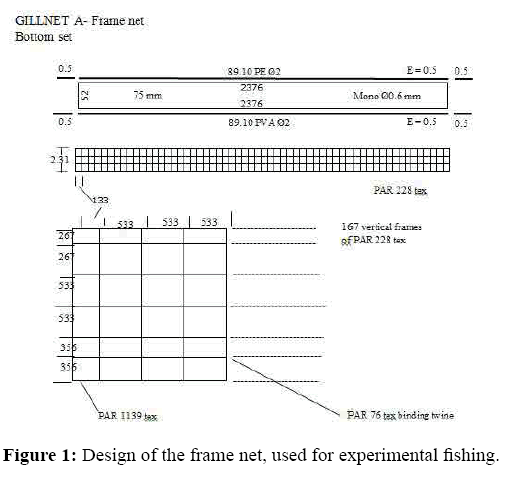
Figure 1: Design of the frame net, used for experimental fishing.
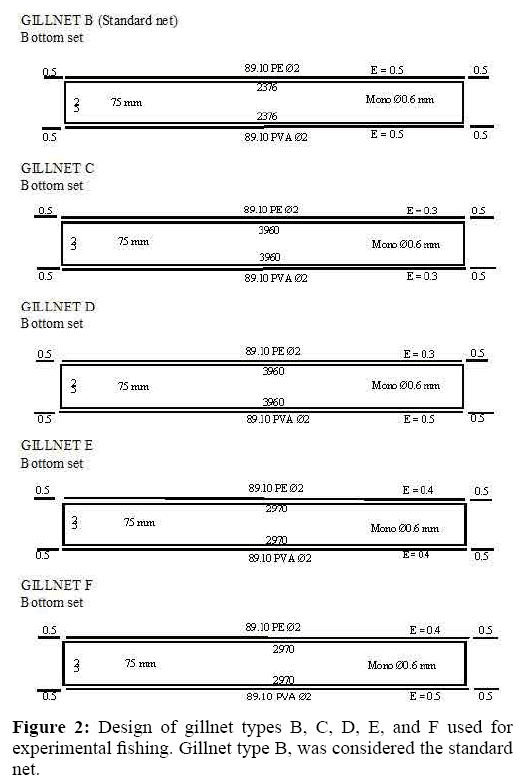
Figure 2: Design of gillnet types B, C, D, E, and F used for experimental fishing. Gillnet type B, was considered the standard net.
Method
Experimental fishing: The first fishing expedition with the gear types was carried out in Stratum VII of the Volta Lake, during the period, April to June 2016 at ten fishing sites of high gillnet fishermen concentration (Figure 3). The second expedition was carried out in February 2017, at only one fishing site (Yeji), during which substantial numbers of the Tilapiine species (Oreochromis niloticus (Linnaeus, 1758) and Sarotherodon galileus (Ruppell, 1852)) were present and enabled the measurement of the total length of the fish species to determine difference in the sizes of fish caught by the gear types. Three fishermen volunteers acted as crew and each received GH?20.00 for food per fishing trip. All the gear types were rigged for bottom anchored fishing and linked to each other as if they were a single long net. The order in which the nets were linked was not considered important as it was shown not to affect the efficiency of gillnets (Collins, 1979). The nets were set late in the evening and recovered early the next morning (11 hours immersion time). The catch per fishing trip per species was recorded in, kilograms, on daily basis for each fishing site and for each net type.
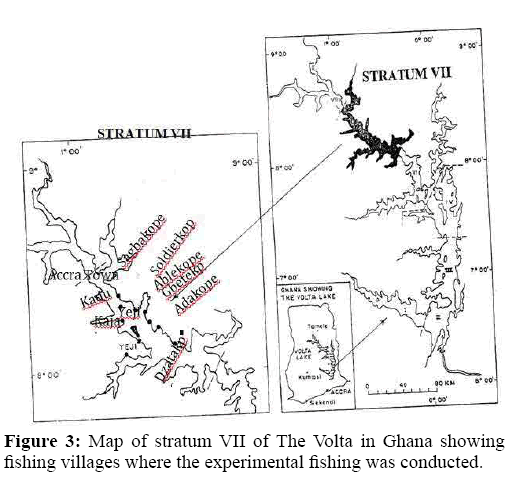
Figure 3: Map of stratum VII of The Volta in Ghana showing fishing villages where the experimental fishing was conducted.
Recording of fishing depths: The second aspect of the study recorded depths (m) with an echo-sounder of the ten fishing sites. The method involved continuous recording of depth along four transects across each fishing site. The maximum measurements were taken for each site. Depth measurements were used to evaluate interactive effects of fishing sites on performance of fishing nets and the linkage of fish species to specific fishing sites.
Analyses of performance of the gear types
Technical performance of the gillnet types
The performance of the gillnet types was analyzed in relation to:
• Fishing efficiency, Fe
Fe=CTn/CTs calculated by dividing the catches obtained by a given gillnet type, CTn by catches obtained by the standard fishing gear, CTs;
• The fishing sites;
• Species of fish caught; and
• Depth of fishing.
Economic evaluation of net types
Cost efficiency, EC
EC=A/b (1)
The ratio of the value of fish caught by a net type, A to the total costs of the operation, b was considered a measure of the cost efficiency (Fridman, 1986) and used to compare with the values from the standard fishing system.
Although life expectancy of a gillnet was considered 2 years, since that for a canoe was 10, revenues and costs of the net types were projected for 10 years to allow similar cost characteristics to be appropriately compared. The number of fishing trips was considered 288 for one year therefore the number of trips for 10 years was 2880.
The total cost incurred by each fishing system, for a 10 year period, comprised:
• Construction cost, adjusted from 2 years life expectancy to 10 years (×5);
• Operation cost, being cost of feeding 3 fishermen at GH?20.00 per day for 2880 fishing trips; and
• Capital cost, being the cost of a plank canoe (GH?2,500.00) (not adjusted).
A detailed list of construction costs was prepared to facilitate the projection for the 10 years, for each net type, including, costs of; netting material, hanging ropes (PE and PVA), framing twine, floats, lead, and the labor cost for fabrication of the gear type.
Estimated value of fish, A
The value, A of the catch was expressed as:
A=a×CT×T (2)
Where, a is price per kilogram and CT the weight (in kilograms) caught per unit of time T.
The estimated fish catch for a 10 year period (2880 trips) was the product of the average catch per fishing trip and the number of fishing trips. The value of fish caught for the period was obtained by multiplying the estimated catch by the cost of 1 kg of fresh fish (GH?20.00).
Index of economic efficiency of the new systems, Ee The ratio of the cost efficiency of the net type ECn, to that of the standard ECs, was calculated as the Index of economic efficiency, Ee for all the net types:
Ee=ECn/ECs (3)
Substituting equations 1 and 2 into equation 3
Ee=ECn/ECs=(an/as)×(CTn/CTs)×(Tn/Ts)×(bs/bn)
Here an/as, characterizes the value of catch, CTn/CTs the relative catchability of the system, Tn/Ts the duration of the operation, and bs/bn the total operating cost.
Statistical analyses
Ordinary test for normal distributed estimates: In order to test for existence of some degree of association between the depth of fishing sites and the percentage catch contribution by site, regression analyses was used to define the coefficient, b and the standard error, SE. Applying the ordinary test, should the coefficient, b be more than 1.96 standard errors (1.96×SE) away from zero, the association was considered significant at 5% level of confidence.
One-way analyses of variance: The analysis was conducted to test the significance of differences between catches of, net types, sites, and species.
The null hypothesis was applied: There was no difference in the mean catch of the net types for the fish species and for the landing sites.
Although the significant tests might show that there was no difference among net types it did not automatically follow that all net types were exactly the same (the largest and the smallest net type means might be divergent). To test this, the standard error SE, was calculated and used to compare any specific pair of means.
Multi-factorial analyses (Two way analyses of variance): To investigate variations in the 3 factors (species, sites and net types) simultaneously, a multi-factorial analyses was used. The main purpose was to assess whether interactions existed between any of the two factors:
Nets×Sites;
Nets×Species; and
Sites×Species
The Null Hypothesis was:
No interaction exists between the 3 factors (species, sites and net types).
The analysis was made possible by substituting all missing values with a value of 0.01 g. Although not strictly a statistical technique it allowed the analyses to be carried in the light of many missing values and provided an indication of the potential interaction effect.
Chi-square analyses of frequency distribution: The Chisquare test was used to determine whether there was an association or difference between the length frequency distribution of the net types (Mead & Curnow, 1983; Bailey, 1992). To fulfil the Chisquare test requirement the expected numbers should not be less than 5 therefore for O. niloticus, the length classes 18 cm, 19 cm, and 20 cm, were added to class 17 cm and for S. galileus, length classes 12 cm, and 13 cm were added to class 14 cm and class 19 cm, and 20 cm added to 18 cm class.
The null hypothesis was: There was no association between length frequency distribution and net types.
Results
Comparison of net types for technical performance
Fishing efficiency of the net types: Of the mean catches of the net types, only net types F and D, with different hanging ratios, at the top and down ropes, had values exceeding 3.0 kg (Table 1). The nets, with same hanging ratio at the top and down ropes, C and E, recorded lower means below 3 kg (1.94 and 2.94 kg respectively). The frame net, also with same hanging ratio, at the top and down ropes, had a mean of 1.93 kg, nearly within the mean range set by C and E. The standard net B recorded the lowest mean catch of 1.21 kg.
Table 1: Fishing efficiency of the net types, comparing the total catch (Cn) of a net type with the catch (Cs) of the standard net type, B.
| Net Type |
Total Catch from 10 Fishing Site |
Mean Catch per Fishing Trip |
Fishing Efficiency (CTn/CTs) |
| A |
19.29 |
1.929 |
1.6 |
| B |
12.09 |
1.209 |
1 |
| C |
19.35 |
1.935 |
1.6 |
| D |
31.45 |
3.145 |
2.6 |
| E |
29.35 |
2.935 |
2.43 |
| F |
38.75 |
3.875 |
3.21 |
The fishing efficiency of all the net types showed results greater than unity. The highest efficiencies of 3.21 and 2.60 were recorded by the gillnets with different hanging ratios at the top and down ropes, F and D respectively, while the net types with same hanging ratios, at the top and down ropes, C and E, recorded values of 1.60 and 2.43 respectively. The efficiency of the frame net (net type A) was 1.60, within the range of C and E with same hanging ratios, top and down.
Net types and fishing sites: The net types showed varying dominance in fish catch in relation to the fishing sites, in the assessment of performance (Table 2): net A, the frame net, was most dominant in fish catch at Gbetekpo and Accra Town; net B, the standard, was most dominant at only Sagbakope; net C, did not show dominance at any of the fishing sites; net D showed dominance at Yeji and Soldierkope; net E was most dominant and consistent in performance in 40% of the fishing sites, namely; Kadue, Ablekope Adakope and Dzatakpo; and Net F in Kajai.
Table 2: Fish catch (kg) of net types (A, B, C, D, E, F) in relation to fishing sites; Yeji, (Yej), Kajai (Kaj), Gbetekpo (Gbe), Soldierkope (Sol), Accra Town (Acc), Sagbakope (Sag), Kadue (Kad), Ablekope (Abl), Adakope (Ada) and Dzatakpo (Dza).
| Net Type (N) |
Yej |
Kaj |
Gbe |
Fishing site (L) |
Kad |
Abl |
Ada |
Dza |
Total |
Mean |
| Sol |
Acc |
Sag |
| A |
2.10 |
4.75 |
3.75 |
0.70 |
2.30 |
1.05 |
0.99 |
1.60 |
1.35 |
0.70 |
19.29 |
1.93 |
| B |
0.46 |
3.04 |
1.40 |
|
|
2.85 |
0.65 |
0.75 |
1.10 |
1.85 |
12.1 |
1.21 |
| C |
3.20 |
5.60 |
2.20 |
0.60 |
0.42 |
0.65 |
0.41 |
1.10 |
4.30 |
0.87 |
19.35 |
1.94 |
| D |
3.77 |
15.32 |
3.20 |
1.21 |
1.50 |
0.6 |
1.33 |
1.45 |
2.53 |
0.55 |
31.46 |
3.15 |
| E |
2.55 |
10.15 |
3.10 |
|
2.20 |
0.85 |
2.15 |
1.70 |
4.55 |
2.15 |
29.35 |
2.94 |
| F |
3.25 |
22.12 |
2.45 |
0.50 |
1.70 |
0.50 |
1.28 |
1.50 |
3.50 |
1.95 |
38.75 |
3.88 |
| Total |
15.33 |
60.98 |
16.05 |
3.10 |
8.12 |
6.40 |
6.81 |
8.10 |
17.33 |
8.07 |
150.30 |
|
Analyses of variance of net types and fishing sites
Results of analyses of variance (Table 3) of net types (N) and fishing sites (L), using Table 2, showed a significant difference between fishing sites at p<0.05 and p<0.10, (F=8.3, df=5 and 45) while the results for net types showed insignificant difference among them at p<0.05 and p<0.10, (F=1.7, df=5 and 45). The null hypothesis was therefore rejected for fishing sites and accepted for net types.
Table 3: Results of variance analyses of fishing sites and net types.
| Source |
Degrees of freedom (df) |
Sum of squares (ss) |
Mean square (ms) |
Variance - ratio (f) |
5% |
1% |
| Sites |
9 |
424.4 |
47.2 |
8.3 |
S |
S |
| Nets |
5 |
48.1 |
9.6 |
1.7 |
NS |
NS |
| Sites × Nets |
45 |
258.1 |
5.7 |
|
|
|
| Totals |
59 |
730.6 |
|
|
|
|
| C |
1 |
376.5 |
|
|
|
|
However calculating the standard error (SE) of the net types as 1.07 and the mean of 1.2 for the standard Net B, it was shown that net types F, D, and E, were divergent from the standard net type B, as the means were outside the range 0.13 g to 2.27 g (1.2 ± 1.07) but net types C and A were not divergent from B (Table 4) as the net type means were within the range. There was therefore difference within the net types.
Table 4: Comparison of net type means (kg) with the standard net B mean catch.
| Net type |
Mean catch (kg) |
Remark |
| F |
3.875 ± 1.07 |
Divergent from Net B |
| D |
3.145 ± 1.07 |
Divergent from Net B |
| E |
2.936 ± 1.07 |
Divergent from Net B |
| C |
1.935 ± 1.07 |
Not divergent from Net B |
| A |
1.929 ± 1.07 |
Not divergent from Net B |
Species distribution according to net types
Four species were caught in large numbers by the net types (Table 5) and by the percentage catch composition, the order of dominance was Synodontis species, Chrysichthys species, Bagrus species and the Mormyrids. The first three were noted to have hard spines. It was also observed that net types F and D, with different hanging ratios at the top and down ropes, caught nearly 79% of the total Synodontis species which seemed to suggest that the hard spinous species was more disposed to capture by such net types. Considering the percentage composition of Synodontis species in the catches of the net types, it was only net type D (with 57%) and F (with 64%) both of different hanging ratios at the top and down ropes, which surpassed the standard net (with 55%) in the capture of the species.
Table 5: Fish species caught (kg) by net types
| Fish Species |
A |
B |
C |
D |
E |
F |
Total |
% Cont. |
| Alestes spp. |
- |
- |
- |
0.43 |
0.3 |
- |
0.73 |
0.5 |
| Bagrus spp. |
1.19 |
1.21 |
1.46 |
1.47 |
5.44 |
1.4 |
12.17 |
8.1 |
| Chrysichthysspp. |
1.6 |
0.99 |
2.69 |
1.88 |
4.55 |
4.3 |
16.01 |
10.7 |
| Distichodus spp. |
- |
- |
0.4 |
4.25 |
2.18 |
2.1 |
8.93 |
5.9 |
| Hydrocynus spp. |
1.8 |
- |
1.5 |
0.25 |
- |
0.72 |
4.27 |
1.6 |
| Labeo spp. |
2.25 |
2.15 |
1.3 |
1.01 |
0.61 |
1.08 |
8.4 |
5.6 |
| Mormyridae |
- |
1.05 |
2.75 |
2.77 |
1.82 |
3.02 |
11.41 |
7.6 |
| Schilbidae |
- |
- |
0.3 |
0.02 |
- |
0.25 |
0.57 |
0.4 |
| Synodontisspp. |
9.15 |
6.7 |
8.65 |
17.88 |
14.1 |
24.98 |
81.46 |
54.2 |
| Tilapiine spp |
- |
- |
0.3 |
0.15 |
0.15 |
0.5 |
1.1 |
0.7 |
| Auchenoglanis spp. |
3.3 |
- |
- |
1.35 |
0.2 |
- |
4.85 |
3.2 |
| Malapterurus spp. |
- |
- |
- |
- |
- |
0.4 |
0.4 |
0.3 |
| Total |
19.29 |
12.1 |
19.35 |
29.35 |
29.35 |
38.75 |
150.3 |
|
It was noted that at the time of the study, the lake was experiencing ‘white water’ condition as a result of flood waters, limiting the catchability of the Tilapiine species, which normally were predominant species in the lake.
Variance analyses of fish species and net types
Due to complexity in processing all the data in Table 5, only the data for the 4 main species caught by all the net types (Bagrus species, Chrysichthys species, Labeo species, and Synodontis species) were used for the analyses, with the rest of the species grouped as ‘Others’ and the results obtained (Table 6).
Table 6: Results of variance analyses of species and net types.
| Source |
Degrees of freedom (df) |
Sum of squares (ss) |
Mean square (ms) |
Variance-ratio (f) |
5% |
1% |
| Nets |
5 |
96.12 |
19.224 |
1.02 |
NS |
NS |
| Species |
4 |
605.6 |
151.4 |
8.03 |
S |
S |
| Residuals |
11 |
207.48 |
18.86 |
|
|
|
| Totals |
20 |
909 |
|
|
|
|
| C |
1 |
753 |
|
|
|
|
Since the variance analysis of net types was already treated, only that for species was considered here. The variance-ratio (f=8.3) for species was greater than the F-distribution values at 5% and 10% confidence limits, therefore the difference in means among species was significant and the null hypothesis rejected: the mean catch per net of the different species was not similar.
Species distribution according to fishing sites
Synodontis species and Chrysichthys species were present in all the fishing sites, Bagrus species were present in all except the Yeji fishing site while Labeo species were in all the fishing sites except Soldierkope. Kajai fishing site contributed 54% of the total Synodontis species catch and 40% of the total catch (Table 7).
Table 7: Fish species distribution (kg) according to fishing sites; Yeji, (Yej), Kajai (Kaj), Gbetekpo (Gbt), Soldierkope (Sol), Accra Town (Acc), Sagbakope (Sog), Kadue (Kad), Ablekope (Abl), Adakope (Ada) and Dzatakpo (Dza).
| Fish Species |
YEJ |
KAJ |
GBT |
SOL |
ACC |
SOG |
KAD |
ABL |
ADA |
DZA |
TOTAL |
| Alestes spp. |
- |
- |
- |
- |
0.18 |
- |
0.55 |
- |
- |
- |
0.73 |
| Bagrus spp. |
0.01 |
1.17 |
0.9 |
0.2 |
2.7 |
0.3 |
2.09 |
1.2 |
1.25 |
2.35 |
12.17 |
| Chrysichthysspp. |
2.45 |
5.14 |
2.45 |
0.4 |
0.57 |
1.75 |
1.15 |
0.7 |
1.03 |
0.37 |
16.01 |
| Distichodus spp. |
0.55 |
5.45 |
0.3 |
0.8 |
- |
- |
0.28 |
- |
1.55 |
- |
8.93 |
| Hydrocynus spp. |
- |
0.5 |
0.4 |
0.25 |
- |
- |
- |
1.5 |
0.6 |
- |
4.27 |
| Labeo spp. |
1.1 |
0.5 |
2 |
0.01 |
0.28 |
0.30 |
0.66 |
0.9 |
1.4 |
1.25 |
8.4 |
| Mormyridae |
1.2 |
3.3 |
3.45 |
0.45 |
0.74 |
0.40 |
1.42 |
0.2 |
0.25 |
- |
11.41 |
| Schilbidae |
0.27 |
0.25 |
0.05 |
- |
- |
- |
- |
- |
- |
- |
0.57 |
| Synodontisspp. |
7.45 |
44.15 |
6.4 |
0.75 |
0.95 |
3.75 |
0.46 |
3.25 |
10.7 |
3.6 |
81.46 |
| Tilapiine spp |
- |
- |
- |
- |
0.35 |
- |
- |
0.35 |
0.15 |
0.25 |
1.1 |
| Auchenoglanis spp. |
2.3 |
- |
- |
- |
2.1 |
- |
0.2 |
- |
- |
0.25 |
4.85 |
| Malapterurus spp. |
- |
- |
- |
- |
- |
- |
- |
- |
0.4 |
|
0.4 |
| Total |
15.33 |
60.98 |
16.05 |
3.01 |
8.12 |
6.5 |
6.81 |
8.1 |
17.33 |
8.07 |
150.3 |
Multi-factorial variance analyses for species, sites and net types
Substituting all missing values with a value of 0.01 kg, (Table 8) the results of the multi-factorial variance analyses of species, sites and net types showed the following interactions (Table 9):
Table 8: Fish species; Bagrus (Bag), Chrysichthys (Chy), Labeo (Lab), Synodontis (Syn), and Others, distribution according to net types and fishing sites; Yeji, (L1), Kajai (L2), Gbetekpo (L3), Soldierkope (L4), Accra Town (L5), Sagbakope (L6), Kadue (L7), Ablekope (L8), Adakope (L9) and Dzatakpo (L10). Missing values substituted with a value of 0.01 kg. All values in kilograms.
| Net Type |
Species |
Landing sites (L) |
| (N) |
(S) |
L1 |
L2 |
L3 |
L4 |
L5 |
L6 |
L7 |
L8 |
L9 |
L10 |
| A |
Bag |
0.01 |
0.30 |
0.01 |
0.01 |
0.01 |
0.01 |
0.44 |
0.01 |
0.45 |
0.01 |
| Chy |
0.1 |
0.25 |
0.45 |
0.01 |
0.01 |
0.40 |
0.20 |
0.01 |
0.01 |
0.20 |
| Lab |
0.01 |
0.01 |
0.01 |
0.40 |
0.01 |
0.01 |
0.35 |
1.50 |
0.01 |
0.01 |
| Syn |
0.81 |
4.20 |
2.00 |
0.30 |
0.20 |
0.65 |
0.01 |
0.10 |
0.90 |
0.01 |
| Others |
1.20 |
0.01 |
1.30 |
0.01 |
2.10 |
0.01 |
0.01 |
0.01 |
0.01 |
0.50 |
| B |
Bag |
0.01 |
0.01 |
0.01 |
0.01 |
0.01 |
0.30 |
0.01 |
0.01 |
0.40 |
0.50 |
| Chy |
0.10 |
0.24 |
0.01 |
0.01 |
0.01 |
0.35 |
0.01 |
0.01 |
0.30 |
0.01 |
| Lab |
0.01 |
0.50 |
0.70 |
0.01 |
0.01 |
0.01 |
0.01 |
0.50 |
0.01 |
0.45 |
| Syn |
0.35 |
2.30 |
0.70 |
0.01 |
0.01 |
1.80 |
0.01 |
0.25 |
0.40 |
0.90 |
| Others |
0.01 |
0.01 |
0.01 |
0.01 |
0.01 |
0.40 |
0.65 |
0.01 |
0.01 |
0.01 |
| C |
Bag |
0.01 |
0.3 |
0.01 |
0.2 |
0.15 |
0.01 |
0.41 |
0.01 |
0.01 |
0.4 |
| Chy |
0.55 |
0.6 |
0.35 |
0.01 |
0.27 |
0.35 |
0.01 |
0.20 |
0.30 |
0.07 |
| Lab |
0.01 |
0.01 |
0.01 |
0.01 |
0.01 |
0.3 |
0.01 |
0.01 |
1.00 |
0.01 |
| Syn |
1.80 |
2.75 |
0.60 |
0.20 |
0.01 |
0.01 |
0.01 |
0.70 |
2.30 |
0.30 |
| Others |
0.85 |
1.95 |
1.25 |
0.20 |
0.01 |
0.01 |
0.01 |
0.20 |
0.7 |
0.10 |
| D |
Bag |
0.01 |
0.12 |
0.40 |
0.01 |
0.55 |
0.01 |
0.4 |
0.01 |
0.01 |
0.01 |
| Chy |
0.35 |
0.55 |
0.3 |
0.01 |
0.01 |
0.30 |
0.20 |
0.10 |
0.08 |
0.01 |
| Lab |
0.30 |
0.01 |
0.01 |
0.01 |
0.01 |
0.01 |
0.01 |
0.40 |
0.30 |
0.01 |
| Syn |
1.70 |
11.4 |
0.90 |
0.15 |
0.50 |
0.30 |
0.13 |
0.6 |
1.9 |
0.30 |
| Others |
1.42 |
3.25 |
1.6 |
1.05 |
0.45 |
0.01 |
0.60 |
0.35 |
0.25 |
0.25 |
| E |
Bag |
0.01 |
0.25 |
0.50 |
0.01 |
1.60 |
0.01 |
0.39 |
1.20 |
0.4 |
1.10 |
| Chy |
0.65 |
2.00 |
0.85 |
0.01 |
0.25 |
0.25 |
0.25 |
0.01 |
0.20 |
0.10 |
| Lab |
0.01 |
0.01 |
0.01 |
0.01 |
0.01 |
0.01 |
0.31 |
0.01 |
0.01 |
0.30 |
| Syn |
1.50 |
6.7 |
0.90 |
0.01 |
0.15 |
0.60 |
0.25 |
0.50 |
3.00 |
0.50 |
| Others |
0.40 |
1.20 |
0.80 |
0.01 |
0.2 |
0.01 |
0.95 |
0.01 |
0.95 |
0.15 |
| F |
Bag |
0.01 |
0.20 |
0.01 |
0.01 |
0.40 |
0.01 |
0.45 |
0.01 |
0.01 |
0.35 |
| Chy |
0.70 |
1.50 |
0.50 |
0.4 |
0.05 |
0.10 |
0.50 |
0.40 |
0.15 |
0.01 |
| Lab |
0.80 |
0.01 |
0.01 |
0.01 |
0.28 |
0.01 |
0.01 |
0.01 |
0.01 |
0.01 |
| Syn |
1.30 |
16.80 |
1.30 |
0.1 |
0.10 |
0.40 |
0.08 |
0.1 |
2.2 |
1.60 |
| Others |
0.45 |
3.62 |
0.65 |
0.01 |
0.87 |
0.01 |
0.25 |
0.01 |
1.15 |
0.01 |
Table 9: Results of variance analyses for species, sites and net types.
| Source |
Degrees of freedom (df) |
Sum of Squares (ss) |
Mean Square (ms) |
Variance -ratio (f) |
5% |
1% |
| Species (spp) |
4 |
60.14 |
15.04 |
21.26 |
S |
S |
| Sites |
9 |
84.66 |
9.41 |
13.3 |
S |
S |
| Nets |
5 |
9.53 |
1.91 |
2.69 |
NS |
S |
| Spp×Site |
36 |
189.03 |
5.25 |
7.42 |
S |
S |
| Spp×net |
20 |
20.65 |
1.03 |
1.46 |
NS |
NS |
| Net×Site |
45 |
51.55 |
1.15 |
1.62 |
S |
S |
| Spp×Site×Net |
180 |
127.32 |
0.71 |
|
|
|
| Total |
299 |
542.88 |
|
|
|
|
•The interaction between species and sites, and between net types and sites was significant at 5% and 1% confidence levels, therefore the Null Hypothesis was rejected. It showed that fish species and net types were both associated with fishing sites;
•The interaction between species and net types was insignificant at 5% and 1% confidence level, therefore the Null Hypothesis was accepted. It showed that fish species were not associated with net types.
•With all the factors considered simultaneously, the net types were significantly different at 1% confidence limit and not at 5%.
Depth of fishing site, fish catch and net type
i. Depth measurements (x) in relation to percentage contribution of total fish catch (y), (Figure 4), produced a relationship formula:
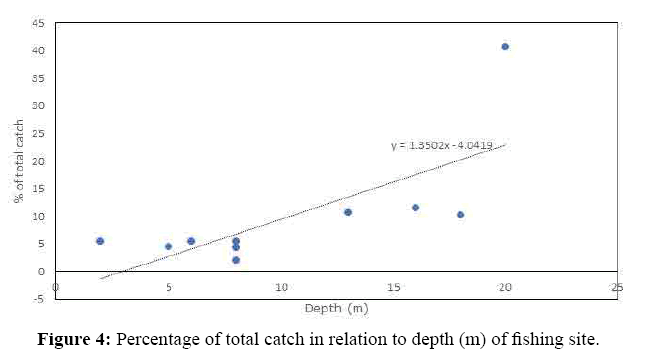
Figure 4: Percentage of total catch in relation to depth (m) of fishing site.
y=1.35x–4.042
The standard error SE, of the relationship was 0.455.
Applying the ordinary test for normal distributed estimates, the coefficient b (1.35), was more than 1.96×SE (1.96×0.455=0.89) and therefore at 5% level of confidence, the association was significant and the percentage contribution of total fish catch was concluded to be associated to the depth of the fishing site.
ii. By the most dominant net type at a fishing site in relation to the depth of the fishing site (Table 10), a classification of depth of fishing and dominance of net types was shown:
Table 10: The most dominant net type at the fishing site in relation to depth (m) of the fishing site.
| Fishing site dominant |
Depth (m) |
Most Net type |
| Yeji |
18 |
D |
| Kajai |
20 |
F |
| Gbetekpo |
13 |
A |
| Soldierkope |
8 |
D |
| Accra Town |
8 |
A |
| Kadue |
5 |
B |
| Ablekope |
6 |
E |
| Addakope |
16 |
E |
| Dzatakpo |
2 |
E |
| Sagbakope |
8 |
E |
i. Fishing depth of 18 m and above Net types: D and F
ii. Fishing depth between 18 m and 13 m Net types: A and E
iii. Fishing depth below 13 m Net types: D, A, B and E
Net types F and D, with different hanging ratios at the top and down ropes, were both dominant in deep fishing sites. While net type F was prominent in only deep fishing sites, net type D was also efficient in shallow sites. Net types A and E, with same hanging ratios at the top and down ropes, were prominent in medium to shallow sites. The standard net B, was prominent in only shallow sites while net type C did not show prominence in any of the depths.
Size selectivity
Length frequency distribution: The length frequency distribution (Figure 5) showed that for O. niloticus the optimum length was 15 cm, for net types B, E, and F and 16 cm for net types A, C, and D. The length range was 14-18 cm, for net types B and F, 14-19 cm for net types C, D, and E and 14-20 cm for only net type A being a frame gillnet.
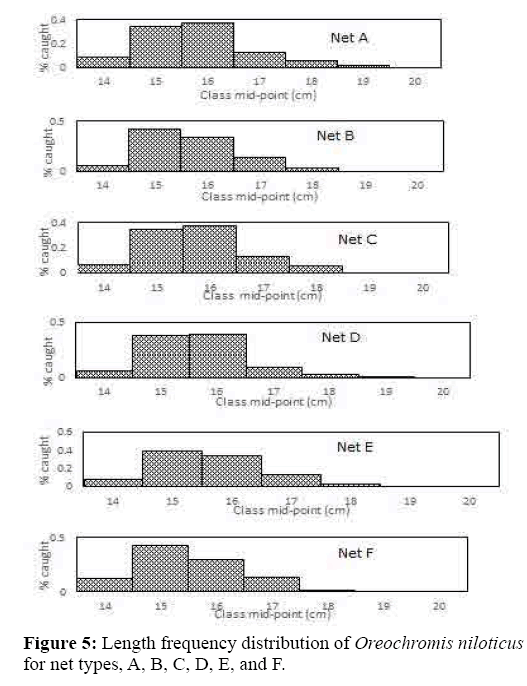
Figure 5: Length frequency distribution of Oreochromis niloticus for net types, A, B, C, D, E, and F.
For S. galileus the length frequency distribution (Figure 6) showed the optimum length was 15 cm with the exception of net type C which was 16 cm. The length range was 13-19 for net types D, E, and F, 14-19 cm for C, and 12-19 cm for B. The largest range was 12-20 cm for net type A, the frame gillnet.
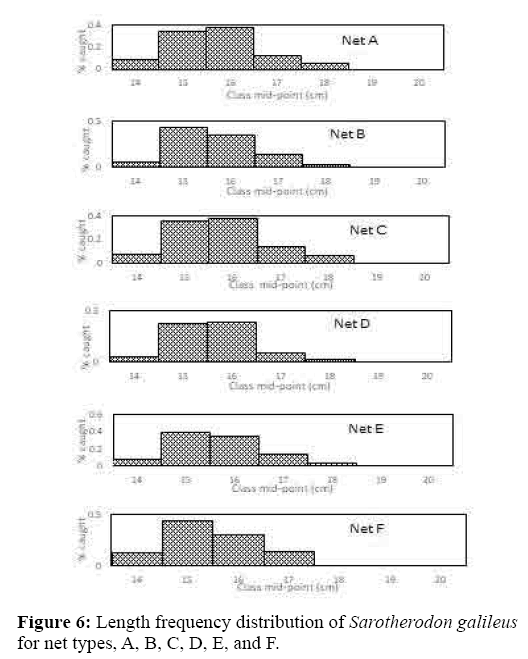
Figure 6: Length frequency distribution of Sarotherodon galileus for net types, A, B, C, D, E, and F.
Statistical analyses of length frequency distribution: A Chi-square test of the length frequency distribution showed that the level of association of net types with length classes was insignificant indicating that there was no difference in the length classes of both O. niloticus (p<0.01, df=15, χ2=10.532) and S. galileus (p<0.01, df=20, χ2=18.486) caught by the net types (Table 11). The null hypothesis was therefore accepted in both cases for O. niloticus and S. galileus.
Table 11: Chi-square test results of length frequency distributions of Oreochromis niloticus and Saratherodon galileus caught.
| χ2 |
O. niloticus |
S. galileus |
| χ2 – statistic |
10.532 |
18.486 |
| df |
15 |
20 |
| p |
≤ 0.01 |
≤ 0.01 |
| χ2 -distribution |
30.578 |
37.566 |
| Difference |
NS |
NS |
Economic evaluation of net types
Considering the total costs of construction (Table 12), net types C and D, were most expensive, as more netting material was required for the required length (89.1 m) due to the low hanging ratio of 0.3. These were followed by net types E and F of 0.4 hanging ratio for the top rope. Net types A and B required comparatively much less material due to the higher hanging ratio of 0.5 used. The lesser the hanging ratio the more material required.
Table 12: Total Construction costs (?) of net types (A, B, C, D, E, and F).
| Net Type |
Net material 400×100yds |
PE hanging rope, hangs |
PVA hanging rope (hangs) |
Framing Twin |
Floats foam Plastic |
Lead (100 g) |
Total Material Cost |
Labor Cost |
Total Cost |
| Qty |
Cost |
Qty |
Cost |
Qty |
Cost |
Qty |
Cost |
Qty |
Cost |
Qty |
Cost |
| A |
|
242 |
3 |
10 |
4 |
20 |
1 |
14 |
28 |
28 |
70 |
35 |
349 |
20 |
369 |
| B |
|
242 |
3 |
10 |
4 |
20 |
0.25 |
3.5 |
28 |
28 |
70 |
35 |
338 |
16 |
354.5 |
| C |
|
403 |
3 |
10 |
4 |
20 |
0.25 |
3.5 |
28 |
28 |
70 |
35 |
499.5 |
16 |
515.5 |
| D |
|
403 |
3 |
10 |
4 |
20 |
0.25 |
3.5 |
28 |
28 |
70 |
35 |
499.5 |
16 |
515.5 |
| E |
|
304 |
3 |
10 |
4 |
20 |
0.25 |
3.5 |
28 |
28 |
70 |
35 |
400.5 |
16 |
416.5 |
| F |
|
304 |
3 |
10 |
4 |
20 |
0.25 |
3.5 |
28 |
28 |
70 |
35 |
400.5 |
16 |
416.5 |
With the cost characteristics of operation of the net types calculated (Table 13), the cost efficiency of the experimental net types showed that all the net types except the standard net B, were greater than unity (Table 14) indicating the profitability of the net types over B. Net type F and D, of different hanging ratios at the top and down ropes, were the most cost efficient, and the only net types exceeding a cost efficiency of 2.0. The cost efficiency of the net types C, E and the frame net, with same hanging ratios, top and down, was less than 2, in the range, 1.24–1.89.
Table 13: Cost characteristics of operation of net types for ten years.
| Net Type |
Projected Life Expectancy (Yrs) |
Construction Cost (i) |
Operation Cost (ii) |
Capital(Boat)Cost (iii) CT |
Total Cost(i+ii+iii) |
Average catch per Fishing Trip (kg) |
Estimated Catch for 10 Yrs. (kg) (C) |
Value Catch for 10 Yrs. (A) |
| A |
10 |
1210 |
172800 |
5000 |
179010 |
1.929 |
5555 |
222200 |
| B |
10 |
1210 |
172800 |
5000 |
179010 |
1.209 |
3480 |
139200 |
| C |
10 |
2015 |
172800 |
5000 |
179815 |
1.935 |
5575 |
223000 |
| D |
10 |
2015 |
172800 |
5000 |
179815 |
3.145 |
9060 |
362400 |
| E |
10 |
1520 |
172800 |
5000 |
179320 |
2.935 |
8455 |
338200 |
| F |
10 |
1520 |
172800 |
5000 |
179320 |
3.875 |
11160 |
446400 |
Table 14: Cost efficiency of experimental net types using Table 13.
| Net Type |
Total Costs(?) |
Value of catch (?) |
Cost |
| A |
179010 |
222200 |
1.24 |
| B |
179010 |
139200 |
0.78 |
| C |
179815 |
223000 |
1.24 |
| D |
179815 |
362400 |
2.02 |
| E |
179320 |
338200 |
1.89 |
| F |
179320 |
446400 |
2.49 |
Index of economic efficiency (Ee) of the systems
The index of economic efficiency was determined for all the net types (Table 15) and showed values above unity for all the net types.
Table 15: Index of economic efficiency (Ee) of the net types calculated as a ratio of the cost efficiency of the net type (Ecn) to that of the standard net (Ecs)
| Net Type |
Index of economic efficiency Ee=Ecn/Ecs |
| A |
1.59 |
| B |
1 |
| C |
1.59 |
| D |
2.59 |
| E |
2.42 |
| F |
3.19 |
The index for net type F was the highest, followed by net type D, both with different hanging ratios, with 3.19 and 2.59 respectively. The index for net types C, E and the frame net A, with same hanging ratios, was in the range, 1.59–2.42.
Discussion
Where the length of a rope on which a net panel is hung is less than the length of the stretched netting it is said to be hung with a low hanging ratio (less than O.5) resulting in a slack or curtainlike shape. A net with slack has higher entanglement properties (Hovgard & Larssen, 2010) and expected to catch fish mainly by entanglement besides gilling (Gabis et al., 2012). At low hanging ratios mesh sizes have narrow openings that should easily entangle fish across a wide range of sizes. In contrast at large hanging ratios (above 0.5) the mesh height is lowered and the lateral opening increased effectively increasing the probability of fish being gilled across a defined size range (Prado et al., 1990). A narrow bodied fish or a fish with more hard spines is expected to entangle whereas a wide bodied fish will require a larger hanging ratio (Gabis et al., 2012). A round fish will be more selectively caught with a mesh shape of 0.5.
Considering the species abundantly caught in the study are, Synodontis species, Chrysicththys species, and Bagrus species, with hard spines, it is expected they will be more easily caught by entangling than by gilling, which probably is the reason for their presence in larger quantities in all the slack nets (C, D, E, F) than the standard net B whose property is basically gilling. However, the favorable disposition of these hard spinous species to capture is more pronounced in the net types D and F, than C and E, establishing the property of unequal hanging ratios at the top and down ropes technically superior in their capture.
Since it is these same dominant spinous species that were subjected to the multi-factorial variance analyses, it is no doubt that the interaction between species and net types was shown to be insignificant as all the net types except the standard net have the same property of entanglement due to slackness coupled with the presence of hard spines on the fish species.
Visibility of the net can be affected by weather conditions, turbidity and the depth of the lake water (Balik & Cubuk, 2000). Fish are myopic and can see 10 m at a depth of 20 m from the surface (Balik & Cubuk, 2001; Radfar et al., 2015; Simasiku et al., 2017). Increased turbidity influences visually-oriented fish by decreasing their visual range and ability to avoid visible nets in the water (Steinberg, 1964; Colby et al., 1972). Increased turbidity caused by flood waters during certain periods of the year in some lakes like the Volta, creates the condition for fish to easily encounter slack nets which under normal conditions should be more visible than the ordinary net (the standard net) to be avoided. The turbid condition, usually referred to as `white water’, enhances the probability of encounter, in turn, enhances the probability of entanglement by the slack nets (C, D, E, and F) and the frame net (A) accounting for the higher catches over the standard (net type B) which has only gilling properties. Comparatively, the higher catches of net types D and F, over C and E, shows a catchability difference during turbid conditions with the different hanging ratios at the top and down ropes being the dominant factor.
Tweddle and Bodington (1988) suggested that it is not the invisibility of a net that makes it an efficient catcher of fish but the nature of the visibility of the net, making fish more excited and encouraged to force a way through the netting and thus making such nets more effective. This explains the dominance of net types F and D which have unequal or different hanging ratios at the top and down ropes. It must be the spectacular irregular nature of the shape of these nets displayed in water due to the asymmetry created by the different hanging ratios at the top and down ropes that excite and encourage fish to force their way through them to be entangled rather than scaring them away. On the other hand same hanging ratios at the top and down ropes generate a regular and symmetrical shape of the net in water and this does not excite fish to trigger an encounter, the reason for the lower catches of the net types (A, B, C, and E) with such a property.
Certainly the efficiency superiority of F and D is emanating from the characteristic that is absent in the other net types which is the property of unequal or different hanging ratios at the top and down ropes. It would then seem that this property linked with slackness is the technical quality that enhances superior efficiency of gillnets.
The Chi-square test shows that the length frequency distribution of the Tilapiine species caught by the net types is insignificant and the optimum lengths and ranges of fish caught are not very different. This is contrary to the findings of Prado (1990) and Kumova et al. (2015) but conform to Ayaz et al. (2010) for sea bream. The explanation by Ayaz et al. is attributed to the morphology of the fish lacking spinous processes that could cause entanglement which is the relevant explanation in the present study. There could perhaps be a different outcome should species with hard spines were selected for the length frequency measurements instead of the soft spined O. niloticus and S. galileus. It could be said therefore that the choice of the Tilapiine species, due to availability in large quantities, during the selected season, for conducting the length frequency measurements, was a mistake as they are not representative of the hard spinous fish species population present, which mostly will be caught by entanglement so as to exhibit the higher modal lengths and wider length ranges, noted by Prado et al. (1990).
Fridman (1986) opined that the continuous improvement of fishing gear and systems has led to increased overall fishing effort resulting in the depletion of fish resources. Therefore, were it not for the negative impact on fish resources availability the effect of technology, which aims at enhanced productivity, would have been much higher than it is today. On the basis of this, and in consideration of the work of Crewe (1964), the importance of economic evaluation of technical improvements in fishing gear systems has become a key pointer to efficient and economic utilization of fisheries resources. In the study, even though the cost efficiency of all the net types surpass the standard B, comparatively, net types F and D, with different or unequal hanging ratios, at the top and down ropes, demonstrate a much more superior ratio of receipts to total costs, consequently yielding a much higher profitability for use of these nets. Additionally even though the index of economic efficiency of all the net types is greater than unity, F and D, show an earning power much more distinctly dominant, under the same fishing conditions, than the nets with equal hanging ratios (A, B, C, and E).
In consideration of choice of a fishing system therefore, technical and economic efficiency are equally important. The comparative technical and economic performance of gillnets have been studied by Njoku (1991) and Jayantha & Amarasinghe (1998) using the rate of return on investment and internal rate of return for the economic evaluation to justify the choice of particular gillnet types. Their approach to economic evaluation is when the established or standard fishing system is not the subject for comparison of economic efficiency. Whichever methodology is used, a technical superior fishing system with a high earning capacity is the ideal choice (Thomas, 2001) in any commercial fisheries.
Conclusion
Different or unequal hanging ratios, at the top and down ropes, linked with slackness constituted a superior intervention for enhancing technical and economic efficiencies of monofilament gillnets.
The insignificant difference in the LFD of the Tilapiine species caught could be attributed to the absence of hard spines favoring capture by gilling by all the net types, over entangling, a property of only slack nets which could result in difference in the sizes of fish caught.
Acknowledgement
My sincere gratitude to William Dogbe for mobilizing experienced fishermen to undertake the fishing expeditions and the staff of the Fisheries Commission at Yeji for collation of data from the field.
24658
References
- Ayaz, A., Altinagac, U., Ozekinci, U., Cengiz, O., Ozetekin, A., (2010) Effects of hanging ratio on gillnet selectivity for annular sea bream (Diplodus annularis) in the Northern Aegean Sea, Turkey. J Anim Vet Adv 9, 1137-1142.
- Bailey, N. T. J., (1992) Statistical methods in biology. 2nd edition, Cambridge Press. 216.
- Balik, I., Cubuk, H., (2000) Efficiency of capture of tench (Tinca tinca) by trammel nets of monofilament and multifilament net twine combinations. Fisheries Manag Ecol 7, 515-521.
- Balik, I., Cubuk, H., (2001) Effect of net colours on efficiency of monofilament gillnets for catching some fish species in Lake Beyuehir. Turk J Fish Aquat Sci 1, 29-32.
- Baronov, F. I., (1948) Theory of fishing with gillnets, In: Theory and assessment of fishing gear. Translated from Russian by Out. pp: 45.
- Blackiel, T., Welcome, R. C., (1980) Guidelines for sampling fish in inland waters. ELFAC Technical Paper No. 33:53
- Clarke, J. R., (1960) Report on selectivity of fishing gear. International Convention of the Northwest Atlantic Fisheries 2, 27-36.
- Colby, P. J., Spangler, G. R., Hurley, D., McCombie, A. M., (1972) Effects of eutrophication on salmonid communities in oligotrophic lakes. J Fish Res Board Can 29,975-983.
- Collins, J. J., (1979) Relative efficiency of multifilament and monofilament nylon gillnet towards white fish (Coregonus clupeaformis) in Lake Huron. J Fish Res Board Can 36, 987-1001.
- Crewe, P. R., (1964) Some of the general engineering principles of trawl gear designs. In modern fishing gear of the world. Fishing News Books, London, 169-180.
- Cullenberg, P., (1987) Gillnet hanging. Alaska marine advisory bulletin No. 29. Pacific Sea Grant Advisory Program 13, 17.
- Fridman, A. L., (1986) Calculations for fishing gear designs. Fishing news books limited, London, 241.
- Gabis, G., Kelpsaite, L., Parkins, C., Castro, K., (2012). Effect of hanging ratio on the catch of red sole (Cynoglossus senegalensis), black sole (Synaptura cadenati) and catfish (Arius spp.) in the Gambia bottom set gillnet fishery. Coastal resources centre, University of Rhode Island 16.
- Hamley, J. M., (1975) Review of gillnet selectivity. J Fish Res Board Can 32, 1943-1969
- Holst, R. N., Madsen, N., Moth-Poulsen, T., Foneca, P., Campos, A., (1994) Manual for gillnet selectivity. European Union Project.
- Hovgard, H., Lassen, H., (2000) Manual on estimation of selectivity for gillnet and longline gears in abundance survey. FAO Fisheries Technical Paper No.397. FAO, Rome. pp: 84.n
- Ishida, T., (1969) The salmon gillnet selectivity curve. INPFCB 26, 1-16.
- Jayantha, S. P. M., Amarasinghe, O., (1998) Efficiency of production technology in marine fisheries: The case of gillnet fisheries in Southern Sri Lanka. In: Hameed, M. S. and M. S. Kurup (eds.): Technological advancements in fisheries. School of industrial fisheries, Cochin University Of Science And Technology, Cochin. 208-215.
- Karlsen, L., Bjarnason, B. A., (1986) Small skala fishing with driftnets. FAO Fisheries technical paper No. 284. Rome. 64.
- Kumova, C. L., Altinagac, U., Oztekin, A., Ayaz, A., Aslan, A., (2015). Effect of hanging ratio on selectivity of gillnets for Bogue (Boops boops, L. 1758). Turk J Fish Aquat Sci 15, 561-567.
- Machiele, M. A. M., Klinge, M., Lanters, R., Densen, W. L. T., (1994) Effect of snood Length and hanging ratio on efficiency and selectivity of bottom-set gillnets for pike perch (Stizostedion lucioperca) and bream (Abramis brama). Fish Res 19, 231-239.
- Mead, R., Curnow, R. N., (1983) Statistical methods in agriculture and experimental biology. chapman and hull limited 334.
- Miyazaki, C., (1964) Discussion on gill netting and long lining etc. In: Kristjonsson, H. (Ed.), Modern fishing gear of the world, Volume 3. Fishing News Books Limited, London 291-292.
- Njoku, D. C., (1991) Comparative efficiency and techno-economics of multifilament and monofilament gillnets on the Oguta Lake, Nigeria. Fish Res 12, 23-30.
- Nomura, M., (1978) Outline of fishing gear and method. Kanagawa international fisheries training centre, Japan.
- Parsa, M., Paighambari, S. Y., Ghorbani, R., Shaibani, M. J., (2014) Effects of hanging ratio on the catch rate and catch per unit effort (CPUE) tuna drifting gillnets in Bushehr coastal waters, Persian Gulf (Iran). WJFMS 6, 214-218.
- Prado, J., Dremiere, P. Y. (1990) Fisherman’s workbook. Fishing news book. London. 180.
- Radfar, F., Ansari, H., Gerami, M. H., Dastbaz, M., (2015) Economic performance efficiency of gillnet based on mesh size and net colors. Int J Marine Sci 57, 1-4.
- Riedel, D., (1963). Contribution to the experimental determination of the selection
- Simasiku, E. K., Mafwila, S. K., Sitengu, G. S., (2017). Comparison of the efficiency of monofilament and multifilament gillnets in Lake Liambezi, Namibia. Int J Fish Aquat Stud 5, 350-355.
- Steinberg, R., (1964) Monofilament gillnets in freshwater experiment and practice. In: Kristjonsson, H. (Ed.), Modern Fishing Gear of the World. Fishing News Books Limited. Surrey, England, 111-115.
- Thomas, S. N., (2001). Gillnets of Kerala: A study on technological and operational aspects. Thesis submitted to the Cochin University of Science and Technology in partial fulfillment of the requirements for the degree of doctor of philosophy, school of industrial fisheries, Cochin University of Science and Technology, Cochin. 333.
- Tweddle, D., Bodington, P. A., (1988) A comparison of the effectiveness of black and white gillnets in Lake Malawi, Africa. Fish Res 6, 257-269.


