Keywords
Blood biomarkers; Water pollution; Erythron profile; River Nile; African catfish; Nile tilapia
Introduction
Fresh water resources all over the world such as rivers are polluted with a variety of solid and liquid wastes. One of the most impressive large rivers worldwide is in Egypt the river Nile. The river Nile has become polluted due to discharge of untreated waste, dumping of industrial effluents, and run-offs from agricultural fields, making it a model for a polluted ecosystem to asses biomarker responses in fish (Osman 2012). These pollutants are taken directly from the river Nile by the gills or through the intestines during the transit of contaminated food. Then they are distributed throughout the body via the blood. Blood cells are some of the first cells to come into contact with and be affected by aquatic pollution (Sadauskas-Henrique et al., 2011). So, the blood reveal measurable physiological changes in fish more rapidly than any physiological assessment parameters (Ezeri et al., 2004) and also respond to changes in other tissues due to exposure of pollutants (Ruas et al., 2008).
Recently, hematological and biochemical variables have become promising biomarkers in measuring the effects of aquatic pollution in fish, because blood parameters respond to low doses of pollutants. Blood parameters are considered as good physiological biomarkers of the whole body, and therefore, they are important in diagnosing the structural and functional status of fish exposed to environmental pollutants (Seriani et al., 2011). Typically, hematological and biochemical variables are unspecific in their responses towards environmental stressors. Nevertheless, they may provide important information in effect assessment studies by providing an indication to the general physiology and health status of fishes (Beyer et al., 1996). These indices could provide information comparable to that given by human blood variables. Several workers have investigated the hematological changes of pollutants in fish (Osman et al., 2010b; Mekkawy et al., 2011; Sayed et al., 2011; Heier et al., 2013), and the use of blood biomarkers in fisheries research is growing rapidly as it is very important in toxicological research environmental monitoring and predicting of fish health conditions (Bitten-Court et al., 2003).
Fish erythrocytes, however, are more responsive to environmental stresses, and often vary in morphology and effectiveness of oxygen transport. (Lowe-Jinde and Niimi, 1983) suggested that differential erythrocyte ratios may be a suitable index for fish laboratory and field studies. Because of the heterogeneity of erythrocytes in circulation, (Houston, 1997) proposed the use of an erythron profile as an alternative measure of contaminant exposure. An erythron profile describes the relative abundances of various developmental stages of red blood cells (Aliko et al., 2012). Houston (1997) argued that such a profile provides a more sensitive means for assessing contaminant exposure than the classic blood indices. The objectives of this study were to explore new sights of biomarker research and to establish the use of blood parameters and erythron profile in wild fish populations.
Material and Methods
Sampling sites
Six sites were selected along the whole course of the River Nile from its start at Aswan to its estuaries at Rosetta and Damietta (Figure 1).
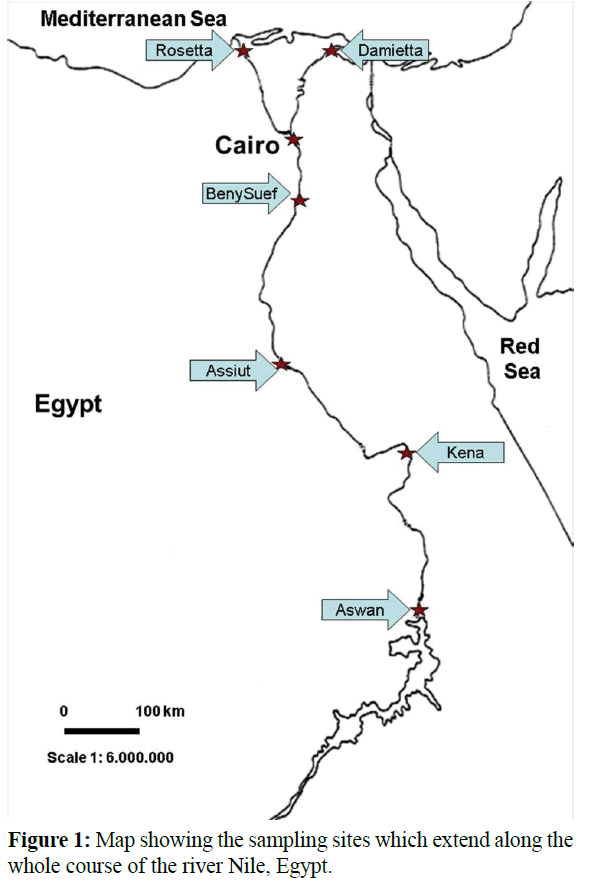
Figure 1: Map showing the sampling sites which extend along the whole course of the river Nile, Egypt.
Water quality assessment
Water quality criteria [electrical conductivity, pH, water temperature, chemical oxygen demand (COD), total organic compound (TOC), total solids (TS), ammonia (NH3), nitrate (NO3), orthophosphate (o-PO4), chloride (Cl) florid (F) sulfate (SO4), phenolics (Phenol)] of the chosen sites were monitored bimonthly. Total Pb, Cu, Cr, Hg, and Cd were measured using graphite furnace AA (GFAA) spectroscopy. Sampling and assessment of water quality were done according to the traditional manual methods (APHA 2005).
Fish sampling
420 Nile tilapia and African catfish were caught bimonthly by gill net from the selected sites (210 specimens from each species; body weight ranging from 240-290 g for Nile tilapia and from 280-350 g for African catfish).
Blood sampling
Two blood samples of the peripheral blood were collected from cardiac puncture as described by Osman et al. (2011). No anesthetic was applied to fish as it may affect blood parameters. First sample was freshly collected in a small glass tubes containing heparin solution (0.2 ml/ml blood) as anticoagulant. This sample was used for hematological analysis. Second sample was collected and left to coagulate for 15–20 min at 4°C prior to centrifugation for 20 min at 3,000 rpm to separate serum. The fresh serum was subjected to biochemical analysis.
Hematological parameters
The whole blood was used for the estimation of hemoglobin concentration (Hb), hematocrit value (Hct), red blood cells count (RBCs), and thrombocytes count by using automated technical analyzer (Celltac α MEK- 6400J/K). Mean corpuscular volume (MCV), mean corpuscular hemoglobin (MCH) and mean corpuscular hemoglobin concentration (MCHC) were calculated according to Dacie and Lewis (2002). White blood cells count (WBCs) and white blood cell differential were calculated using the method according to Shaw (1930). Neutrophils, lymphocytes, eosinophils and monocytes were counted using an Olympus oilimmersion light microscope with 1000 X magnification.
Erythron profile
Two blood smears were immediately made with drops of fresh blood and allowed to air dry. Slides were stained with 5% Giemsa and Eosin & Hematoxylin stains. Slides were examined using an Olympus oil-immersion light microscope with 1000 X magnification and images were captured using a high performance camera (HDCE-50B) and analyzed using Image–Pro plus software (version 4 for windows). The major and minor axis length, area, and shape factor (=4π × area/perimeter 2) of erythrocyte cells and nuclei were measured (Rowan, 2007). To determine the numbers of karyorrhetic, dividing, and enucleate erythrocytes, seven fields were randomly selected on each slide. The numbers of each cell type were counted, and data were recorded as number of cells per seven fields (Rowan, 2007). To determine the developmental stages of erythrocytes, 100 erythrocytes were randomly selected and visually classified by shape into immature, intermediate, or mature.
Biochemical parameters
Colorimetric determinations of the selected biochemical parameters were performed using spectrophotometer (Jasco-V530). The absorbency of the detected sample was examined at an appropriate wavelength ranging from 340 to 546 nm according to the parameter tested. Total protein (g/dl), cholesterol (mg/dl), triglycerides (mg/dl), calcium (mg/dl), chlorides (mg/dl), alkaline phosphatase activity (ALP, IU/L), aspartate aminotransferase (AST, U/I), alanine aminotransferase (ALT, U/I), uric acid activity (mg/dl), creatinine (mg/dl), and serum glucose (mg/dl) were determined using commercial diagnostic kits (bioMérieux, France), following the manufacturer’s instruction.
Statistical Analysis
Data are presented as the means ± standard deviation. Data were analyzed by one-way analysis of variance (ANOVA) test using data analysis software system (STATISTICA 2007) and figured by Microsoft Excel. Means were tested using Fisher Least Significant Difference (LSD) test. Two levels of significance were reported; *p<0.05; **p<0.01. The Pearson’s product correlation coefficient was used to determine the relationship between the blood variables and physicochemical parameters in waters samples.
Results
Physico–chemical water parameters
Table 1 shows mean ± SD of the detected physico-chemical parameters of water samples collected from the selected sites. Most of the detected physico-chemical parameters exhibited their highest values in the water of river Nile downstream. For nearly all detected parameters significant differences (p<0.05) were observed between the selected sites. Mean values of conductivity, chemical oxygen demand (COD), total organic carbon (TOC), ammonia (NH3), nitrate (NO3), total solid (TS), sulphate (SO4), chloride (Cl), and orthophosphate were recorded to be higher in the water of Damietta and Rosetta sites compared to other sampled sites. Also most of the detected heavy metals exhibited highest values at Damietta and Rosetta sites. The levels of such parameters were significantly (p<0.05) increased from the start of the river Nile at Aswan toward its estuaries at Damietta and Rosetta sites. All the detected parameters were below the permissible limits in the river Nile at upstream sites. In contrast, the levels of COD, phenol, Pb, Cd, Cr and Hg were above the permissible limits in the water of downstream river Nile (Rosetta and/or Damietta sites).
| Sites |
Aswan |
Kena |
Assiut |
Beny-Suef |
Damietta |
Rosetta |
Permissible limit |
| Parameter (Unit) |
Mean ± SD |
Mean ± SD |
Mean ± SD |
Mean ± SD |
Mean ± SD |
Mean ± SD |
| PH (Unit) |
7.86 ± 0.25 |
8.01 ± 0.41 |
8.15 ± 0.19 |
8.27 ± 0.27 |
8.40 ± 0.44 |
8.23 ± 0.45 |
7-8.5 |
| Conductivity |
0.26 ± 0.03 |
0.27 ± 0.07 |
0.29 ± 0.09 |
0.34 ± 0.07 |
0.38 ± 0.10 |
0.58± 0.11 |
- |
| Temperature ( °C ) |
22.68 ± 2.22 |
23.72 ± 3.15 |
23.33 ± 4.67 |
23.64 ± 4.24 |
25.29 ± 5.66 |
24.53± 4.44 |
Over 5ºC |
| Chemical oxygen demand (ppm) |
10.58 ± 3.62 |
9.17 ± 3.04 |
10.63 ± 2.18 |
7.88 ± 2.15 |
8.59 ± 2.51 |
18.00 ± 10.38 |
10 |
| Total organic carbon (ppm) |
5.65 ± 2.88 |
5.89 ± 1.93 |
5.74 ± 0.92 |
4.93 ± 2.58 |
5.21 ± 2.64 |
8.61 ± 6.06 |
- |
| Total solid (ppm) |
198.88 ± 14.09 |
212.67 ± 23.70 |
227.75 ± 16.29 |
259.50 ± 44.33 |
305.25 ± 55.96 |
411.25 ± 85.66 |
500 |
| Ammonia (ppm) |
0.11 ± 0.16 |
0.01 ± 0.002 |
0.02 ± 0.01 |
0.01 ± 0.01 |
0.05 ± 0.05 |
0.15 ± 0.09 |
0.5 |
| Nitrate (ppm) |
0.89 ± 0.40 |
0.77 ± 0.39 |
0.51 ± 0.21 |
0.72 ± 0.63 |
1.13 ± 1.13 |
2.05 ± 2.27 |
45 |
| Chlorides (ppm) |
7.05 ± 1.44 |
8.56 ± 1.90 |
10.03 ± 2.58 |
15.28 ± 5.10 |
22.42 ± 4.93 |
40.55 ± 6.72 |
- |
| Florid (ppm) |
0.29 ± 0.15 |
0.32 ± 0.14 |
0.39 ± 0.16 |
0.31 ± 0.13 |
0.30 ± 0.10 |
0.37 ± 0.08 |
0.5 |
| Ortho phosphate (ppm) |
0.01 ± 0.02 |
0.037 ± 0.04 |
0.10 ± 0.090 |
0.03 ± 0.034 |
0.13 ± 0.07 |
0.21 ± 0.19 |
- |
| Sulphate (ppm) |
34.16 ± 13.30 |
45.30 ± 15.37 |
47.95 ± 14.11 |
45.25 ± 15.81 |
51.00 ± 12.76 |
68.13 ± 11.42 |
200 |
| Phenol (ppm) |
0.01 ± 0.02 |
0.01 ± 0.02 |
0.01 ± 0.02 |
0.01 ± 0.01 |
0.03 ± 0.02 |
0.04 ± 0.02 |
0.02 |
| Pb (ppm) |
0.01 ± 0.02 |
0.02 ± 0.01 |
0.02 ± 0.02 |
0.02 ± 0.01 |
0.03 ± 0.04 |
0.06 ± 0.08 |
0.05 |
| Cd (ppm) |
0.004 ± 0.004 |
0.002 ± 0.002 |
0.01 ± 0.01 |
0.002 ± 0.002 |
0.02 ± 0.02 |
0.01 ± 0.02 |
0.01 |
| Cu (ppm) |
0.03 ± 0.03 |
0.03 ± 0.02 |
0.03 ± 0.03 |
0.03 ± 0.03 |
0.03 ± 0.03 |
0.0544 ± 0.027 |
1 |
| Cr (ppm) |
0.003 ± 0.002 |
0.01 ± 0.01 |
0.01 ± 0.01 |
0.01 ± 0.01 |
0.05 ± 0.06 |
0.10 ± 0.15 |
0.05 |
| Hg (ppm) |
0.0000 ± 0.001 |
0.0004 ± 0.001 |
0.0005 ± 0.001 |
0.0009 ± 0.001 |
0.002 ± 0.001 |
0.003 ± 0.001 |
0.001 |
Table 1: Physicochemical parameters of the water samples collected from different sites along the whole course of the river Nile, Egypt (n=108 samples).
Hematological variables
The mean values of RBCs, Hb, Hct, MCV, MCH, MCHC, and thrombocyte of Nile tilapia and African catfish are shown in Table 2. The statistical analysis of these variables exhibited significant differences among the selected sites for both fish species. The mean values of RBCs, Hb, Hct, MCV in the blood of Nile tilapia and African catfish decreased significantly (p<0.01) from Aswan to Rosetta and Damietta sites (Table 2). In the same way, mean concentration of thrombocyte decreased in the blood of fish collected from Rosetta and Damietta (Table 2). In contrast, MCH and MCHC in the peripheral blood of both fish species increased significantly (p<0.01) from upstream to downstream river Nile.
| Parameters |
Species |
Aswan |
Kena |
Assiut |
Bany-Suef |
Damietta |
Rosetta |
| RBCs (X106/ µL) |
Oreochromis niloticus |
2.24 ± 0.35 |
2.39 ± 0.35 |
2.05 ± 0.38 |
1.88 ± 0.37** |
1.49 ± 0.33** |
1.51 ± 0.4** |
| Clarias gariepinus |
2.51 ± 0.4 |
2.49 ± 0.35 |
2.21 ± 0.41* |
2.02 ± 0.35** |
1.66 ± 0.39** |
1.57 ± 0.39** |
| Hb (g/dL) |
Oreochromis niloticus |
11.55 ± 0.88 |
11.37 ± 0.77 |
10.47 ± 0.98* |
9.81 ± 1.38** |
8.39 ± 1.32** |
7.97 ± 1.11** |
| Clarias gariepinus |
11.65 ± 0.79 |
11.59 ± 0.96 |
10.82 ± 1.24* |
10.39 ± 1.02** |
8.63 ± 1.23** |
8.11 ± 1.19** |
| HCT (%) |
Oreochromis niloticus |
38.76 ± 4.28 |
37.58 ± 3.72 |
31.89 ± 5.59** |
28.2 ± 4.03** |
21.59 ± 5.26** |
20.49 ± 5.48** |
| Clarias gariepinus |
38.98 ± 4.59 |
38.57 ± 4.15 |
33.9 ± 6.17** |
29.59 ± 4.89** |
22.89 ± 5.0** |
20.78 ± 5.29** |
| MCV (fL) |
Oreochromis niloticus |
175.58 ± 21.30 |
159.16 ± 18.69* |
156.41 ± 19.58** |
153.07 ± 24.73** |
145.95 ± 26.77** |
140.39 ± 31.19** |
| Clarias gariepinus |
157.1 ± 16.38 |
156.53 ± 19.93 |
154.71 ± 22.88 |
147.28 ± 13.85* |
140.08 ± 24.88** |
135.53 ± 33.58** |
| MCH (Pg) |
Oreochromis niloticus |
52.41 ± 5.85 |
48.25 ± 5.24* |
51.85 ± 5.74 |
53.01 ± 6.31 |
57.33 ± 9.48* |
55.17 ± 10.15 |
| Clarias gariepinus |
47.33 ± 5.56 |
47.08 ± 4.77 |
49.65 ± 5.53 |
52.31 ± 4.91* |
53.38 ± 7.14** |
53.54 ± 9.68** |
| MCHC (g/dL) |
Oreochromis niloticus |
30.11 ± 2.07 |
30.45 ± 1.67 |
33.46 ± 3.69* |
35.08 ± 3.85** |
40.01 ± 6.94** |
40.9 ± 9.03** |
| Clarias gariepinus |
30.2 ± 2.39 |
30.18 ± 1.34 |
32.5 ± 4.03 |
35.87 ± 3.71** |
38.79 ± 6.52** |
40.87 ± 7.23** |
| T (X103/µL) |
Oreochromis niloticus |
473.69 ± 53.08 |
467.99 ± 72.46 |
429.86 ± 45.40 |
393.19 ± 60.71 |
351.24 ± 59.88 |
321.88 ± 62.5* |
| Clarias gariepinus |
425.13 ± 99.64 |
404.65 ± 51.62 |
408.74 ± 46.75 |
386.25 ± 70.29 |
307.45 ± 64.48* |
371.93 ± 72.83 |
Significance is comparable to Aswan at (*p<0.05, **p<0.01).
Table 2: Mean values ± SD of red-blood-cells (RBCs) count, hemoglobin (Hb) content, hematocrit (HCT) value, mean corpuscular value (MCV), mean corpuscular hemoglobin (MCH), mean corpuscular hemoglobin concentration (MCHC) and thrombocytes (T) concentrations of Nile tilapia and African catfish collected from the whole course of the river Nile, Egypt.
Table 3 shows the mean leukocytes, monocytes, lymphocytes, neutrophils and eosinophils concentrations in the peripheral blood of Nile tilapia and African catfish collected from the river Nile, Egypt. The number of WBCs decreased significantly (p<0.01) from upstream to downstream river Nile recording the lowest values at Rosetta and/or Damietta (Table 3). In the same way, significant (p<0.01) reductions in the percentage distribution of lymphocytes and monocytes were observed from upstream to downstream river Nile (Table 3). In contrast, the percentage distribution of neutrophils and eosinophils increased significantly (p<0.01) from upstream to downstream river Nile recording the highest values in the blood of fish sampled from Rosetta (Table 3). The mean number of leukocytes and the mean percentage distribution of neutrophils, monocytes, lymphocytes and eosinophils were higher in the blood of African catfish than those in the blood of Nile tilapia collected from the same sites and at the same sampling time (Table 3).
| Parameters |
Species |
Aswan |
Kena |
Assiut |
Bany-Suef |
Damietta |
Rosetta |
| WBCs(X103/µL) |
Oreochromis niloticus |
47.22 ± 10.89 |
50.65 ± 8.15 |
46.41 ± 7.44 |
42.59 ± 7.64* |
35.67 ± 7.55** |
36.29 ± 9.2** |
| Claris gariepinus |
53.13 ± 8.94 |
59.16 ± 8.22 |
49.57 ± 6.8 |
47.21 ± 9.01* |
39.21 ± 7.58** |
37.94 ± 8.05** |
| Lymphocytes (%) |
Oreochromis niloticus |
59.5 ± 4.17 |
59.4 ± 5.21 |
59.3 ± 4.61 |
59.6 ± 4.53 |
57 ± 4.98* |
56.6 ± 5.64** |
| Claris gariepinus |
61.4 ± 6.83 |
60.5 ± 4.45 |
59.9 ± 4.79 |
59.1 ± 5.49 |
56.1 ± 5.06 |
54.7 ± 4.39 |
| Monocytes (%) |
Oreochromis niloticus |
14.47 ± 4.06 |
13.15 ± 4.08 |
10.51 ± 3.24** |
8.09 ± 2.96** |
5.59 ± 2.01** |
4.78 ± 1.72** |
| Claris gariepinus |
16.29 ± 9.28 |
13.73 ± 3.78 |
10.33 ± 3.19** |
8.35 ± 2.11** |
5.97 ± 1.83** |
4.93 ± 1.66** |
| Neutrophils (%) |
Oreochromis niloticus |
24.22 ± 4.12 |
25.64 ± 5.02 |
28.22 ± 3.97 |
30.11 ± 4.49** |
35.2 ± 4.26** |
36.79 ± 5.44** |
| Claris gariepinus |
25.7 ± 8.81 |
23.94 ± 4.43 |
27.82 ± 2.97 |
30.34 ± 4.61 |
35.87 ± 5.46** |
38.35 ± 4.2** |
| Eosinophils (%) |
Oreochromis niloticus |
1.8 ± 0.95 |
1.79 ± 0.87 |
1.93 ± 0.72 |
2.16 ± 0.87 |
2.23 ± 0.79** |
1.9 ± 1.01** |
| Claris gariepinus |
1.79 ± 8.3 |
1.88 ± 0.94 |
1.98 ± 0.86 |
2.17 ± 1.08 |
2.1 ± 0.91** |
1.98 ± 0.87** |
Significance is comparable to Aswan at (*p <0.05, **p< 0.01).
Table 3: Mean values ± SD WBCs count, lymphocytes, monocytes, neutrophils and eosinophils concentration of Nile tilapia and African catfish collected from the whole course of the river Nile, Egypt
Erythron profile
In the circulating blood of Nile tilapia and African catfish, erythrocytes in various stages of differentiation were recorded; mature, intermediate and immature (Figure 2A and 2B). Significant differences (p<0.01) were recorded in the relative abundance of the three maturity stages in the peripheral blood of both fish species among the selected sites (Figure 2C and 2D). The percentage of the immature stages increased significantly (p<0.01) from upstream to downstream river Nile recording the highest values in the blood of fish sampled from Rosetta site (Figure 2C and 2D). In contrast, the percentage distribution of the mature erythrocyte recording the highest value in the blood of fish collected from Kena at upstream river Nile (Figure 2C and 2D).
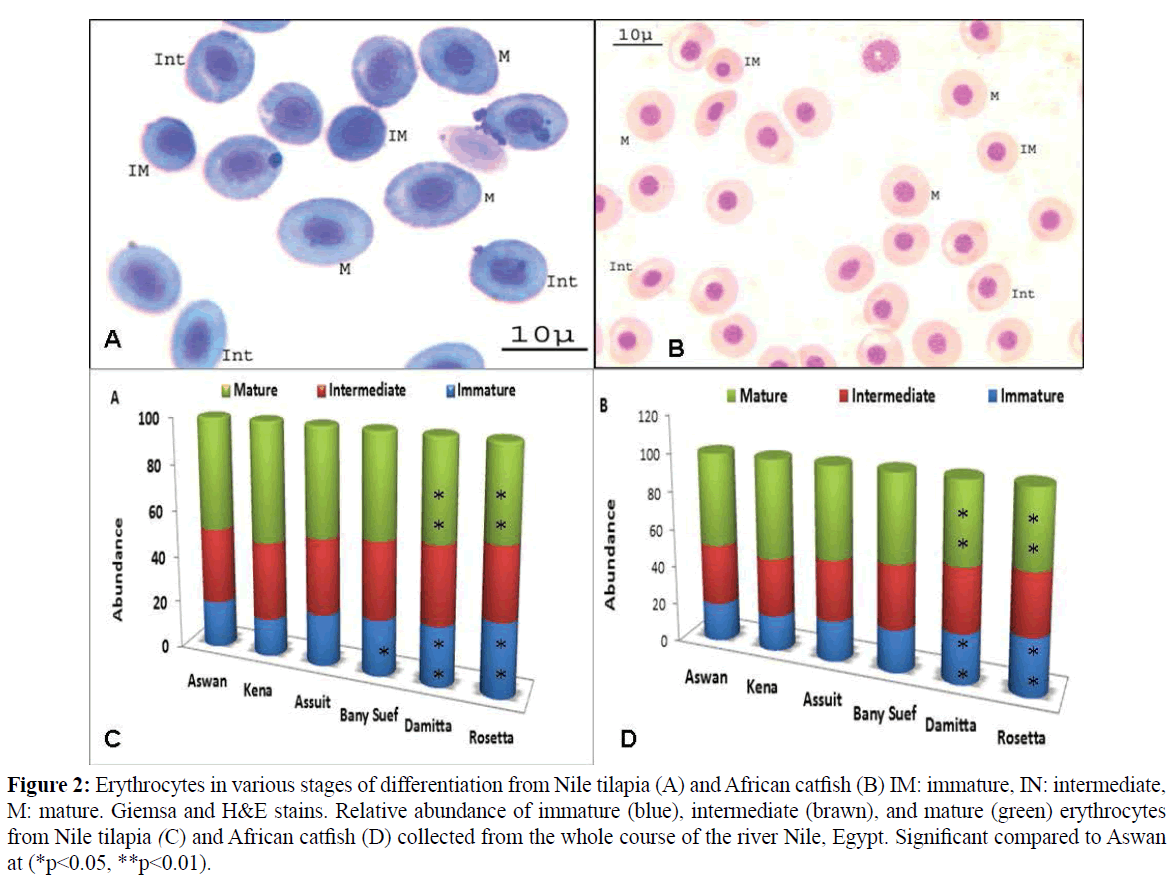
Figure 2: Erythrocytes in various stages of differentiation from Nile tilapia (A) and African catfish (B) IM: immature, IN: intermediate, M: mature. Giemsa and H&E stains. Relative abundance of immature (blue), intermediate (brawn), and mature (green) erythrocytes from Nile tilapia (C) and African catfish (D) collected from the whole course of the river Nile, Egypt. Significant compared to Aswan at (*p<0.05, **p<0.01).
The following classification for erythrocytes were found in the circulating blood of both fish species: karyorrhectic or degenerating erythrocytes (Figure 3A and 3B), dividing erythrocytes (Figure 3C), and enucleate erythrocytes (Figure 3D). Three forms of karyorrhectic or degenerating erythrocytes were observed during the present study in the blood of Nile tilapia and African catfish namely cytoplasmic swelling, membrane disintegration (nuclear deformation), and nuclear shadow (smudge cell remaining after cell death) (Figure 3A and 3B). Significant differences (p<0.05) in the mean numbers of karyorrhectic erythrocytes were recorded among the selected sites (Table 4) for both fish species. The highest number of karyorrhectic erythrocytes were recorded in the blood of fish sampled from Rosetta compared to other sites. Few numbers of the divided erythrocytes were recorded in the blood of Nile tilapia and African catfish along the whole course of the river Nile. No significant differences in the number of dividing erythrocytes were observed among the selected sites for both fish species (Table 4). Enucleate erythrocytes were rarely observed in the blood of fish during the period of the current work. Enucleate cells completely disappeared in the blood of fish sampled form upstream river Nile (Aswan and Kena). Significant differences (p<0.01) in the mean number of enucleate erythrocytes in the blood of Nile tilapia and African catfish among the selected sites were recorded (Table 4). The mean numbers of the malformed erythrocytes (karyorrhectic, dividing and enucleate) were higher in the blood of Nile tilapia than those in the blood of African catfish collected from the same sites and at the same sampling time.
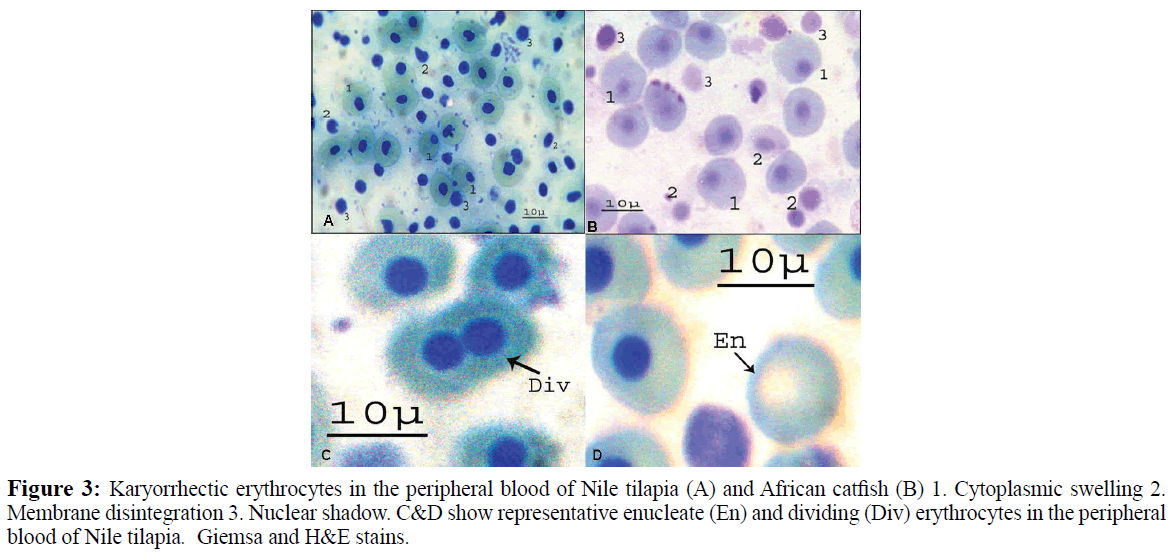
Figure 3: Karyorrhectic erythrocytes in the peripheral blood of Nile tilapia (A) and African catfish (B) 1. Cytoplasmic swelling 2. Membrane disintegration 3. Nuclear shadow. C&D show representative enucleate (En) and dividing (Div) erythrocytes in the peripheral blood of Nile tilapia. Giemsa and H&E stains.
| Parameters |
Species |
Aswan |
Kena |
Assiut |
Bany-Suef |
Damietta |
Rosetta |
| karyorrhectic erythrocytes Per 7 fields |
Oreochromis niloticus |
7.94 ± 2.24 |
9.47 ± 2.95 |
10.1 ± 2.58 |
13.41 ± 3.09* |
20.57 ± 4.15** |
24.7 ± 4.75** |
| Claris gariepinus |
9.44 ± 2.32 |
7.75 ± 2.55 |
8.84 ± 2.53 |
13.78 ± 3.25* |
19.3 ± 3.79** |
23 ± 4.58** |
| Dividing erythrocytes Per 7 fields |
Oreochromis niloticus |
1.13 ± 0.84 |
1.91 ± 1.04 |
3.28 ± 1.12 |
3.38 ± 1.29 |
3.63 ± 1.16 |
4.58 ± 1.89 |
| Claris gariepinus |
2.03 ± 1.09 |
1.19 ± 0.81 |
2.31 ± 1.22 |
3.19 ± 1.07 |
3.63 ± 1.28 |
3.99 ± 1.58 |
| Enucleate erythrocytes Per 7 fields |
Oreochromis niloticus |
0 |
0 |
0.094 ± 0.20 |
0.22 ± 0.36 |
0.51 ± 0.63* |
0.76 ± 0.79** |
| Claris gariepinus |
0 |
0 |
0.031 ± 0.09 |
0.38 ± 0.56** |
0.48 ± 0.59** |
0.69 ± 0.82** |
Significance is comparable to Aswan at (*p<0.05, **p<0.01).
Table 4: Mean number ± SD of karyorrhectic, dividing and enucleate erythrocytes of Nile tilapia and African catfish collected from the whole course of the river Nile, Egypt
Measurements of cellular and nuclear major and minor axis length, cellular and nuclear area, and cellular and nuclear shape factor were exhibited remarkable variations in size and shape of the erythrocytes among sites (Table 5). The lower cellular and nuclear area and the lower cellular and nuclear shape factor were recorded in the blood of fish collected from Damietta and Rosetta sites compared to other sites (Table 5). Cellular factor shape of the erythrocytes inversely correlated (R=-0.72, p=0.0002) with immature erythrocytes and directly correlated (R=0.070, p=0.0002) with mature erythrocytes of Nile tilapia and African catfish collected from the whole course of the river Nile.
| Cell |
| Parameters |
Species |
Aswan |
Kena |
Assiut |
Bany-Suef |
Damietta |
Rosetta |
| Major axis (μm) |
Oreochromis niloticus |
12.06±2.05 |
12.65±2.05 |
12.11±1.46 |
11.42±0.82* |
11.45±1.5 |
11.37±1.46* |
| Claris gariepinus |
11.1±0.39 |
11.33±1.18 |
10.86±1.29 |
11.2±2.06 |
10.63±2.55 |
10.56±1.25* |
| Minor axis(μm) |
Oreochromis niloticus |
8.32±0.93 |
8.92±0.69 |
8.47±1.19 |
8.79±0.43 |
8.43±0.91 |
8.34±1.07 |
| Claris gariepinus |
9.88±0.57 |
9.66±0.66 |
9.74±0.64 |
9.9±0.52 |
8.81±0.94* |
8.86±0.75* |
| Area(μm2) |
Oreochromis niloticus |
78.82±19.19 |
88.67±11.44* |
80.55±12.18 |
78.86±6.96 |
75.75±13.59 |
74.41±14.36 |
| Claris gariepinus |
86.15±3.75 |
85.98±11.25 |
83.13±10.91 |
87.16±17.02 |
73.54±24.23* |
73.34±11.69** |
| Shape factor |
Oreochromis niloticus |
0.88 |
0.92 |
0.8* |
0.75** |
0.74** |
0.7** |
| Claris gariepinus |
0.89 |
0.91 |
0.77** |
0.76** |
0.69** |
0.66** |
| Nucleus |
| Parameters |
Species |
Aswan |
Kena |
Assiut |
Bany-Suef |
Damietta |
Rosetta |
| Major axis (μm) |
Oreochromis niloticus |
4.81±0.47 |
5.14±0.92 |
4.71±0.67 |
4.73±0.87 |
4.26±1.37* |
4.65±0.69 |
| Claris gariepinus |
4.36±0.29 |
4.25±0.41 |
4.14±0.37 |
4.16±0.76 |
4.01±0.75 |
3.89±0.73* |
| Minor axis (μm) |
Oreochromis niloticus |
3.69±0.37 |
3.74±0.74 |
3.58±0.73 |
3.33±0.78 |
3.35±0.99 |
3.39±0.59 |
| Claris gariepinus |
3.83±0.45 |
3.88±0.26 |
3.56±0.27* |
3.47±0.59** |
3.59±0.56* |
3.58±0.46* |
| Area (μm2) |
Oreochromis niloticus |
13.98±2.14 |
15.19±4.91 |
13.22±4.05 |
12.41±4.49 |
11.19±6.01* |
12.23±3.19 |
| Claris gariepinus |
13.11±1.37 |
12.98±1.79 |
11.57±1.38* |
11.27±3.46** |
11.24±3.67** |
10.97±2.91** |
| Shape factor |
Oreochromis niloticus |
0.88 |
0.87 |
0.78** |
0.73** |
0.69** |
0.7** |
| Claris gariepinus |
0.86 |
0.9 |
0.8 |
0.77* |
0.71** |
0.65** |
Table 5: Means ± SD of major and minor axis length, area, and shape factor of red blood cells and their nuclei of Nile tilapia and African catfish collected from the whole course of the river Nile, Egypt.
Biochemical variables
The mean concentrations of cholesterol, triglyceride, total protein, alanine aminotransferase (ALT), aspartate aminotransferase (AST), alkaline phosphatase (ALP), glucose, calcium (Ca), chloride (Cl), uric acid, creatinine, urea and sodium (Na) in blood serum of Nile tilapia and African catfish are shown in Table 6. Significant (p<0.01) differences were observed in the mean values of all the detected biochemical variables for both fish species among the selected sites. The mean concentrations of all the biochemistry parameters increased significantly (p<0.01) in the blood serum of fish collected from downstream river Nile compared to those sampled from upstream sites (Table 6).
| Parameters |
Species |
Aswan |
Kena |
Assiut |
Bany-Suef |
Damietta |
Rosetta |
| Cholesterol (mg/dl) |
Oreochromis niloticus |
117.4 ± 13.27 |
123.1 ± 18.9 |
157.9 ± 15.8* |
178.3 ± 20.3** |
226.9 ± 23.9** |
204.9 ± 22.7** |
| Clarias gariepinus |
162.1 ± 20.9 |
178.6 ± 13.3 |
195.2 ± 21.1* |
227.1 ± 15.8** |
229.5 ± 22.7** |
261.7 ± 22.8** |
| Triglycerides (mg/dl) |
Oreochromis niloticus |
111.6 ± 11.13 |
122.9 ± 15.4 |
155.6 ± 12.2** |
182.2 ± 16.5** |
204.7 ± 18.9** |
200.2 ± 18.4** |
| Clarias gariepinus |
129.6 ± 10.95 |
149.14 ± 10.9 |
175.79 ± 16.3** |
181.6 ± 16.5** |
176.7 ± 13.12** |
195.2 ± 21.9** |
| Total protein (g /dl) |
Oreochromis niloticus |
5.26 ± 0.94 |
5.1 ± 0.99 |
5.65 ± 1.22 |
6.1 ± 0.96* |
6.69 ± 1.1** |
6.9 ± 0.99** |
| Clarias gariepinus |
5.44 ± 1.03 |
6.31 ± 0.92 |
6.64 ± 0.93** |
6.1 ± 1.33** |
6.7 ± 1.95** |
7.0 ± 1.2** |
| Alanine aminotransferase (ALT) U/I |
Oreochromis niloticus |
8.41 ± 2.47 |
8.97 ± 2.76 |
14.55 ± 3.73** |
19.09 ± 3.68** |
28.3 ± 4.55** |
31.14 ± 5.99** |
| Clarias gariepinus |
10.16 ± 3.07 |
11.38 ± 3.07 |
14.94 ± 4.3** |
19.47 ± 4.48** |
24.28 ± 4.35** |
26.3 ± 5.28** |
| Aspartate aminotransferase (AST) U/I |
Oreochromis niloticus |
11.34 ± 3.58 |
15.34 ± 4.43 |
21.59 ± 3.99* |
25.63 ± 5.6** |
39.97 ± 5.87** |
39.39 ± 6.43** |
| Clarias gariepinus |
13.53 ± 3.1 |
15.8 ± 4.15 |
22.34 ± 4.08** |
27.88 ± 5.15** |
34.6 ± 4.97** |
35.84 ± 6.8** |
| Alkaline phosphates (ALP) mg/dl |
Oreochromis niloticus |
90.36 ± 10.99 |
85.01 ± 9.51 |
105.9 ± 13.3* |
110.9 ± 8.75** |
137.4 ± 12.6** |
136.2 ± 16.6** |
| Clarias gariepinus |
83.24 ± 8.45 |
95.1 ± 10.84 |
109.1 ± 9.97** |
128.2 ± 12.3** |
147.6 ± 15.3** |
150.7 ± 17.8** |
| Uric acid |
Oreochromis niloticus |
4.57 ± 0.84 |
3.9 ± 0.71 |
4.18 ± 0.9 |
4.8 ± 1.1 |
4.88 ± 0.92 |
4.8 ± 0.94 |
| Clarias gariepinus |
4.03 ± 0.75 |
4.5 ± 0.94 |
4.73 ± 0.78 |
5.23 ± 1.16** |
4.84 ± 0.94* |
5.46 ± 1.1** |
| Calcium |
Oreochromis niloticus |
11.67 ± 3.37 |
14.09 ±2.63 |
21.98 ± 4.3** |
33.3 ± 5.1** |
31.19 ± 5.69** |
39.29 ± 7.5** |
| Clarias gariepinus |
17.1 ± 4.89 |
15.97 ± 4.07 |
32.11 ± 5.57** |
41.03 ± 6.71** |
41.96 ± 6.04** |
48.5 ± 9.1** |
| Chlorides |
Oreochromis niloticus |
81.2 ± 8.5 |
83.34 ± 9.39 |
80.29 ± 11.4 |
98.89 ± 12.90** |
99.6 ± 10.57** |
114.3 ± 13.9** |
| Clarias gariepinus |
91.65 ± 8.9 |
88.67 ± 11.01 |
87.38 ± 14.42 |
106.64 ± 11.9 |
116.5 ± 8.8** |
111.8 ± 12.57 |
| Creatinine (mg/dl) |
Oreochromis niloticus |
0.66 ± 0.15 |
0.61 ± 0.14 |
0.85 ± 0.22 |
1.55 ± 0.45 |
2.28 ± 0.61* |
2.69 ± 0.57** |
| Clarias gariepinus |
4.14 ± 0.69 |
6.11 ± 1.3 |
5.19 ± 1.14 |
6.03 ± 1.23 |
6.8 ± 1.85 |
8.98 ± 2.3** |
| Urea (mg/dl) |
Oreochromis niloticus |
18.71 ± 2.92 |
15.89 ± 3.85 |
21.57 ± 4.36 |
27.09 ± 5.79** |
31.08 ± 6.11** |
34.57 ± 6.2** |
| Clarias gariepinus |
20.44 ± 3.84 |
21.17 ± 3.65 |
21.44 ± 5.54 |
27.2 ± 4.24 |
31.58 ± 6.49** |
33.22 ± 6.5** |
| Glucose (mg/dl) |
Oreochromis niloticus |
73.39 ± 10.22 |
65.91 ± 12.04 |
108 ± 24.1** |
111.9 ± 11.9** |
144.9± 16.35** |
159.3 ± 17.2** |
| Clarias gariepinus |
77.2 ± 15.41 |
74.19 ± 15.5 |
116.3± 20.3** |
132.6 ± 9.87** |
154.9 ± 15.8** |
146.5 ± 16.3** |
| Sodium (mmol/L) |
Oreochromis niloticus |
98.1 ± 9.84 |
97.6 ± 10.78 |
118.13 ± 9.4** |
147.1 ± 7.69** |
146.5 ± 7.6** |
150.6 ± 8.12** |
| Clarias gariepinus |
98.7 ± 11.41 |
97.2 ± 10.98 |
119.7± 7.95** |
135.7 ± 7.57** |
136.9 ± 8.4** |
147.7 ± 8.1** |
Table 6: Mean concentrations ± SD of the selected biochemical parameters in blood serum of Nile tilapia and African catfish collected from different sites along the whole course of the river Nile, Egypt.
Discussion
Water quality is the major factor responsible for individual variation in fish hematology. Water quality assessment along the whole course of the river Nile concluded higher mean values of nearly all the detected physicochemical parameters in water collected from sampling sites downstream river Nile compared to those collected from upstream river Nile. Such increase proves the presence of large quantities of organic and inorganic pollutants in Rosetta and Damietta water. Mean values of conductivity, chemical oxygen demand, total organic carbon, ammonia, nitrate, total solid, sulphate, chloride, and orthophosphate were recorded to be significantly (p<0.05) higher in the water of downstream sites compared to other sampled sites. Also most of the detected heavy metals exhibited highest values at Damietta and Rosetta sites. The levels of chemical oxygen demand, phenol, Pb, Cd, Cr and Hg were above the permissible limits in the water of downstream river Nile (Rosetta and/or Damietta sites. This finding was expected due to the fact that the level of contamination is greater downstream river Nile, compared to upstream sampling sites, where more domestic and industrial effluents have been released into the Nile without adequate treatment (Osman and Kloas, 2010). It was estimated that the aquatic environment of downstream areas receives more than 3 million cubic meters daily of untreated or partially treated domestic, industrial wastes, and, in addition, agricultural drainage water (El-Naggar et al., 2009).
Hematological variables
Since hematological and blood biochemical parameters are influenced by a variety of environmental stressors, they have the potential to be used as biomarkers of the detected river Nile pollution. Their evaluation in fish has become an important means of understanding the toxicological impacts of exposure hazards (Borges et al., 2007; Sudova et al., 2009; Li et al., 2011). In the present study significant reductions in the values of RBCs, Hb, Hct and MCV were observed in the blood of Nile tilapia and African catfish collected from downstream sites (polluted sites) compared to those collected from less polluted upstream areas. The present results find supports from Summarwar (2012) who recorded remarkable reduction in the levels of RBCs, Hb, Hct and MCV in the blood of Clarias batrachus inhabiting polluted sites compared to those caught from clean site. Numerous studies have shown that the peripheral RBCs, Hb, Hct and MCV of fish displayed decrease incidence after exposure to different pollutants under field and lab conditions (Svoboda et al., 2001; Singh and Tandon, 2009; Vinodhini and Narayanan, 2009; Zutshi et al., 2010; Mekkawy et al., 2011; Gupta and Chandra, 2013). The observed reduction in RBCs, Hb, Hct and MCV values may be attributed to one or more of the following factors: (i) heam-dilution of blood due to damage and later bleeding in the gills (Heath 1996) (ii) the destruction of mature RBCs and the inhibition of erythrocyte production (Musa et al., 2013) (iii) hemolytic crisis that results in severe anemia in fish exposed to heavy metals (Desai and Parikh, 2012).
MCH and MCHC values increased in blood of Nile tilapia and African catfish collected from the estuaries of the river Nile at Damietta and Rosetta sites (contaminated sites) compared to upstream sites. Similarly, Adeyemo (2007) found significant increase in MCH and MCHC values of African catfish exposed to lead. The increase in MCH with decrease in RBC, Hb and MCV values (observed here) was previously recorded by Mukherjee and Shiha (1993) for major carp exposed to cadmium. The perturbation in these blood indices may be attributed to a defense reaction against toxicity.
Thrombocytes are comparable to mammalian blood platelets and play an important role in blood clotting and general defense mechanisms (Kayode and Shamusideen, 2010). It has been reported that the exposure of fish to heavy metals such as lead (Adeyemo, 2007), zinc (Kori-Siakpere and Ubogu, 2008) mercury (Mekkawy et al., 2010) usually decrease thrombocytes indices. In the present study, a lowest concentration of thrombocytes was recorded in the blood of Nile tilapia and African catfish collected from contaminated sites (downstream river Nile) compared to other sites. The present results were supported by the results of Seriani et al. (2011) who recorded a remarkable reduction in thrombocytes of Nile tilapia collected at the polluted pond. Secombes et al. (1992) also found that the thrombocyte fraction has been significantly reduced after exposure to sewage sludge.
Hematological variables in the peripheral blood of Oreochromis niloticus niloticus and Clarias gariepinus exhibited significant (p<0.05) correlation with nearly all the detected chemical and physical parameters along the Nile course. The mean values of RBCs, Hb, Hct and MCV of Nile tilapia and African catfish were inversely correlated (R=from -0.51 to-0.85, p<0.01) with nearly all the detected physico-chemical variables. Non-significant correlations (R=from 0.1 to 0.36) were recorded between the mean concentration of thrombocytes and the mean values of nearly all the detected chemical and physical water parameters (excluding conductivity (R=-0.66, p<0.01), total solid (R=-0.61, p<0.01), chloride (R=-0.59, p<0.01) for Nile tilapia and/or African catfish).
White blood cells play a major role in the defense mechanism in fish. In the present study, leukocytes count in blood collected from Nile tilapia and African catfish was significantly (p<0.01) decreased in contaminated sites (Rosetta and Damietta branch) compared to other sites. Similarly, Jeronimo et al. (2009) observed a reduction in the WBC count in fishes collected from polluted river. Significant reductions in white blood cell count were previously reported in the common carp after acute exposure to diazinon-based pesticide (Adedeji et al., 2009). Also, the white blood cells count was decreased in Nile tilapia and African catfish after exposure to nickel (Ololade and Oginni, 2010). The reduction in white blood cells may result from bioaccumulation of the pollutants in the liver (Agrawal and Srivastava, 1980). It was evident previously (Osman and Kloas, 2010; Osman, 2012) that the liver of Nile tilapia and African catfish was the site of maximum accumulation for the heavy metals examined. On the other hand, some authors (Singh and Tandon, 2009; Zutshi et al., 2010; Musa et al., 2013) observed a remarkable increase in the number of WBC in fishes collected from polluted sites, which mean an opposite answer to the present work. Possibly, the African catfish and Nile tilapia are well adapted and more resistant to water quality parameters at downstream rive Nile. In the present work, Significant correlations (R=from -0.51 to-0.82, p<0.01) between WBCs count and nearly all the detected chemical and physical parameters (excluding chemical oxygen demand) were recorded.
Changes in differential leukocyte count are recognized as a sensitive indicator of environmental stress (Cole et al., 2001; Li et al., 2011). The lymphocytes are reported to be responsible for immune response (Singh and Tandon, 2009) producing antibodies and chemical substances serving as a defense against infection (Musa et al., 2013). An increase in lymphocyte numbers may be a compensatory response of lymphoid tissues to the destruction of circulating lymphocytes (Shah and Altindag, 2005). Singh and Tandon (2009) observed a high number of lymphocytes in fishes collected from polluted river. However, our study registered different responses when compared to the one above, since significant decrease in the number of lymphocytes were recorded in the blood of Nile tilapia and African catfish collected from the contaminated sites compared to other sites. This trend may be related to fish that live in the polluted site as it, in fact, occurred in the polluted area (Jeronimo et al., 2009). This fact is supported by Hoeger et al. (2004) who showed that fish exposed to sewage effluent had a decrease in circulating lymphocytes.
Monocytes and neutrophils are important white blood cells to protect the body through their phagocytic activities against bacterial infection in damaged cells (Singh and Tandon, 2009). The percentage of monocytes and neutrophil generally decreases after exposure to pollutants (Nussey et al., 2000). In the present study, significant decreases in the number of monocytes were recorded in the blood of Nile tilapia and African catfish collected from the contaminated sites compared to other sites. Significant increases (p<0.01) of neutrophil counts were recorded in the present work in the blood of both fish species collected from the contaminated sites (Rosetta and Damietta branch). The same results were previously recorded by Davis et al. (2008) and Mekkawy et al. (2011). In contrast, (Rowan, 2007) reported significant reduction in the neutrophil numbers in brown bullheads collected from a contaminated site compared to a reference site. Eosinophils are considered to play a role in defense mechanism, phagocytizing activities, and inflammation (Matos et al., 2014). They display the same trend as neutrophils are being increased from upstream to downstream river Nile.
Lymphocytes and eosinophils showed non-significant (R=from 0.06 to 0.32, p>0.05) correlation with nearly all the detected water quality parameters. Most of the detected water quality parameters exhibited significant correlation (R=from -0.44 to-0.79, p<0.01) with monocytes and neutrophil in the blood of Nile tilapia and African catfish. Many studies have shown a relationship between the fish leukocytes variables and the exposure to single pollutant (Mekkawy et al., 2010; Osman et al., 2010b; Musa et al., 2013). The river Nile in this work is contaminated with a variety of pollutants (multiple stressors). So, the differential leukocytes count may be not suitable as stand-alone biomarkers of aquatic pollution, but it is a sensitive biomarker of detecting immunological changes in fishes if combined to other non-invasive biomarkers (Valon et al., 2012).
Erythron profile
Various environmental factors play an important role in determining the erythrocyte size (Altman and Dittmer, 1961). The concentrations of water and sediment contaminants were negatively associated with the erythrocyte cellular and nuclear area and positively associated with ratio of immature erythrocytes (Rowan, 2007). In the present study, lower cellular areas and cellular shape factors were recorded in the erythrocytes of fish collected from Damietta and Rosetta branch compared to those sampled from Aswan and Kena (upstream). This was confirmed by higher immature ratios of red cells in the blood of fish sampled from downstream sites. These relationships indicated that pollution might have stimulated erythropoiesis and increased the abundance of immature red blood cells in the circulation of fish collected from contaminated locations. Rowan (2007) also recorded a positive correlation between the ratios of immature cells in blood of Ameiurus nebulosus collected from contaminated sites.
Three forms of karyorrhectic or degenerating erythrocytes were observed during the present study in the blood of Nile tilapia and African catfish namely cytoplasmic swelling, membrane disintegration (nuclear deformation), and nuclear shadow (smudge cell remaining after cell death). The swollen blood cells were recorded as common alteration. Degeneration of erythrocytes can be described as pathological conditions in fishes exposed to toxicants (Buckley et al., 1976). It was previously reported in fishes after exposure to sub lethal concentrations of pesticides (Adedeji et al., 2009) and heavy metals (Adeyemo, 2007; Ololade and Oginni, 2010). The present study, however, showed significant correlations (R=from 0.47 to 0.82, p<0.01) between karyorrhectic erythrocytes and physico-chemical parameters in water samples collected from the whole course of the river Nile. Karyorrhectic cells in the blood of Nile tilapia and African catfish were higher in Rosetta and Damietta sites (contaminated sites) compared to other sites. Similarly, Rowan (2007) and Valon et al. (2012) reported an increase in karyorrhectic erythrocyte in blood of fish collected from contaminated sites. Also, Houston et al. (1993) reported an increased number of karyorrhectic erythrocytes in goldfish (Carassius auratus) due to chronic exposure to cadmium. According to the available literatures, the presence of karyorrhectic erythrocytes (degenerated) is an indicator of chronic pollution in the site (Valon et al., 2012). This fact is supported in the present study by the increased number of neutrophils and decreased number of leukocytes observed in the downstream sites (contaminated).
In the present study very few numbers of dividing erythrocytes were recorded in the blood of Nile tilapia and African catfish collected from the whole course of the river Nile. The presence of dividing erythrocytes in peripheral blood of fish were previously reported by Murad and Houston (1992) and Rowan (2007). According to the present result, dividing cells do not show the classic characteristics of eukaryotic mitosis. More research is needed to determine the exact mechanism of the dividing erythrocytes formation. Since the numbers of dividing cells were not correlated (R=from -0.1 to-0.37, p>0.05) with water quality parameters collected from the selected sites, it seems unlikely that dividing cells could be useful indicator of contaminant exposure.
It is known that fish have, normally, nucleated erythrocytes in their peripheral blood (Niimi and Imada, 2008) representing a special mechanism for the increasing oxygen carrying efficiency, particularly in contaminated water, by improving surface and/ or volume ratio (Valon et al., 2012). In the present work, enucleate red cells were recorded only in the blood of Nile tilapia and African catfish collected from downstream river Nile and absent in the blood of fish collected from upstream areas. Enucleated erythrocytes were significantly correlated (R=from 0.54 to 0.91, p<0.05) with physiochemical parameters collected from the same sites and at the same sampling time.
Biochemical parameters
To see if there was any correlation between fish altered physiological fitness and environmental stress, we measured serum biochemical variables namely; AST, ALT, ALP, total protein, cholesterol and triglyceride concentration, glucose level, creatinine, and uric acid. According the available literatures, alteration of fish blood biochemistry is indicative of unsuitable environmental conditions or the presence of stress factors (Yang and Chen, 2003; Barcellos et al., 2004; Kamal and Omar, 2011). Therefore the measurement of serum biochemical parameters is useful for biomarkers in toxicology (McDonald and Grosell, 2006).
AST and ALT belong to the plasma nonfunctional enzymes, which are normally localized within the cells of liver, heart, gills, kidneys, muscle and other organs (Hadi et al., 2009). ALP enzyme is a sensitive biomarker for metallic salts since it is a membrane bound enzyme related to the transport of various metabolites (Lakshmi et al., 1991). In the present study, ALT, AST and ALP concentrations in blood serum of Nile tilapia and African catfish were significantlyy higher (p<0.01) in the contaminated sites (Rosetta and Damietta branch). Environmental contamination with heavy metals and other sources, recorded in Rosetta and Damietta branches (Osman and Kloas, 2010), could lead to such elevation in ALT, AST, ALP concentration in the blood of both fish species. The same results were previously recorded in the blood of Nile tilapia and African catfish after exposure to pesticides (Adedeji et al., 2009), heavy metals (Oner et al., 2008; Mekkawy et al., 2010), nonylphenols (Mekkawy et al., 2011) and UV rays (Osman et al., 2010b). Increased levels of ALT indicate an adaptive response to its leakage into the blood stream due to the presence of water toxicity. It has been reported that alterations in enzymes activities in the serum directly indicates major pathologic changes or liver damage (Bhattacharya et al., 2008). Previously Osman (2012) recorded a severe cellular degeneration and necrosis in the livers of Nile tilapia collected from downstream river Nile, explaining the remarkable increase in the level of AST, ALT, and ALP observed in the present work.
The protein synthesis of an organism is of important diagnostic significance because of its involvement in enzymes, hormones, and antibodies. Thus, the influence of toxicants on total protein concentration of fish has been taken into consideration to evaluate the response to stressors and consequently the increasing demand for energy (Hadi et al., 2009). In the present study, the total protein concentration in the blood of Nile tilapia and African catfish were significantly increased from upstream to downstream sites (Rosetta and Damietta branch). Such increase in total protein reflects liver dysfunction due to higher heavy metal concentrations (Zaki et al., 2010). The levels of Pb, Cd, Cr and Hg were above the permissible limits in the water of downstream river Nile (Rosetta and/or Damietta sites) explaining higher total protein level in the blood of fish sampled from downstream areas.
Cholesterol is the most important sterol occurring in animal fats. Change in the blood cholesterol and triglyceride concentration is a sensitive indicator of liver dysfunction because homeostasis of lipids is one of the principle liver functions (Sayed et al., 2011). It has been reported that exposure of fish to heavy metals (Vinodhini and Narayanan, 2009) increased cholesterol and triglyceride concentrations in the blood. In the present work, the blood cholesterol and triglyceride levels were significantly (p<0.05) higher in Nile tilapia and African catfish collected from the contaminated sites (downstream areas) as compared to upstream areas. Such increase could be explained as a result of liver damage previously detected in fish sampled from downstream river Nile (Osman 2012), leading to inhibition of enzymes that converts cholesterol into bile acid (Murray et al. 1991).
Blood glucose level has been used as an indicator of environmental stress to reflect changes in carbohydrate metabolism under stress conditions (Kamal and Omar, 2011). The levels of glucose were significantly higher in the blood of African catfish and Nile tilapia collected from downstream river Nile (polluted area) compared to upstream sites. The chemical pollutants such as heavy metals modulate the metabolism of carbohydrates, causing hyperglycemia by stimulating the glycogenolysis in fish (Levesque et al., 2002). This was supported by higher level of all the detected heavy metals in downstream river Nile. Increased levels of glucose were previously recorded in blood of fishes exposed to ultraviolet radiation (Sayed et al., 2007; Osman et al., 2010b), heavy metals (Levesque et al., 2002; Mekkawy et al., 2010), and other pollutants (Poléo and Hytteørd, 2003; Adedeji et al., 2009). This can be attributed to the alteration in the activity of glucose-6-phosphate dehydrogenase and lactate dehydrogenase previously detected by (Osman et al., 2010a).
The results of the present work exhibited higher levels of creatinine, urea and uric acid in the blood of fish sampled from polluted sites. Similar findings were reported by Zaki et al. (2009) who recorded a significant increase in these parameters in Nile tilapia due to cadmium exposure. Increased levels of plasma creatinine and uric acid can be used as rough indicators of glomerular filtration rate and kidney functions (Abu et al., 2009; Zaki et al., 2010; Kamal and Omar, 2011).
Concentrations of individual ions and total osmolarity in blood plasma are physiological variables that have been used as indicators of the effects of pollution on fish (Abel, 1989). Ions are very important for any organism because they involved in most biological processes (Sayed et al., 2011), and responsible for the maintenance of osmotic pressure in blood (Mohanty and Mishra, 1983). In the present study, the levels of calcium, sodium, chloride were significantly increased from upstream to downstream sites in correlation with the increase in the level of physico-chemical variables in these sites. Similarly, significant increase in sodium and chloride, were recorded in the blood of Prochilodus lineatus collected from contaminated site compared to reference one (Camargo and Martinez, 2006). The observed increase in the levels of ions and blood sugar in the blood of fish collected from polluted sites lead to an increase in osmolarity. This probably reflects the high conductivity of the water found at this site, which is usually associated with the discharge of large quantities of salt (Winkaler et al., 2001). Increased plasma ion concentrations are due to altered enzyme activities (Osman et al., 2010a) and it has been an indicator of impending death (Woodling, 1999).
The selection of fish species is a critical issue in routine application of blood biomarkers for bio monitoring purposes. Rodriguez-Cea et al. (2003) noted that some fish species are more sensitive to aquatic pollutants than other species. This hypothesis is supported by data in this study. Species specific differences between polluted and non-polluted sites were obtained for Nile tilapia and African catfish. The number of leucocytes was higher in the blood of African catfish than that in the blood of Nile tilapia collected from the same site and at the same sampling time. This indicates that African catfish are more resistant than Nile tilapia toward environmental stress. At the same time the frequency distribution of erythrocytes malformation was recorded to be higher in the blood of Nile tilapia than that in the blood of African catfish, indicating Nile tilapia was more sensitive to aquatic pollutants than African catfish.
Acknowledgments
This work was partially supported by Science and Technology development fund (STDF), Egypt (Project ID 448). The first author is grateful for the continuous support from the Alexander von Humboldt Foundation, Germany.
21796
References
- Abel, P.D. (1989) Water Pollution. (Ellis Horwood Limited: Chinchester, UK) pp: 231.
- Abu, O.M.G., Gabriel, U.U., Sanni, L.O., Akinrotimi, O.A. (2009) Evaluatoin of Biochemical Changes Associated with Replacement of Maize with Whole Cassava Root Meal in the Diet of Hybrid Catfish. J Aquacult Feed Sci and Nutr1, 68-72.
- Adedeji, O.B., Adeyemo, O.K., Agbede, S.A. (2009) Effects of diazinon on blood parameters in the African catfish (Clariasgariepinus). African J Biotechnol8, 3940-3946.
- Adeyemo, O.K. (2007) Haematological Profile of Clariasgariepinus (Burchell, 1822) Exposed to Lead. Turkish J Fisheries and Aquatic Sci7, 163-169.
- Agrawal, S.J., Srivastava, A.K. (1980) Haematological responses in a freshwater fish to experimental manganese poisoning. Toxicol17, 97-100.
- Aliko, V., Qirjo, M., Sula, E., Berdica, L. (2012) Early Detection of Pollution Stress through Evaluation of Some Metabolic and Histopathological Biomarkers in Carp Fish (Cyprinuscarpio l.) from Shkodra Lake, Albania. In ' BALWOIS 2012', Ohrid, Republic of Macedonia.
- Altman, P.L., Dittmer, D. (1961) 'Blood and other body fluids.' (Federation of American Societies for Experimental Biology: Washington. D.C.).
- APHA (2005) Standard methods for the examination of water & wastewater. (Amer Public Health Assn)
- Barcellos, L., Kreutz, L., de Souza, C., Rodrigues, L., Fioreze, I. et al. (2004) Hematological changes in jundia (RhamdiaquelenQuoy and GaimardPimelodidae) after acute and chronic stress caused by usual aquacultural management, with emphasis on immunosuppressive effects. Aquaculture 237, 229–236.
- Beyer, J., Sandvik, M., Hylland, K., Fjeld, E., Egaas, E., et al. (1996) Contaminant accumulation and biomarker responses in flounder (Platichthysflesus L) and Atlantic cod (Gadusmorhua L) exposed by caging to polluted sediments in Sorfjorden, Norway. Aquatic Toxicol36, 75-98.
- Bhattacharya, H., Xiao, Q., Lun, L. (2008) Toxicity studies of nonylphenol on rosy barb (Puntiusconchonious): A biochemical and histopathological evaluation. Tissue Cell 40, 243-249.
- Bitten-Court, L.J.G., Kreutz, L.C., De Souza, C., Rodrigues, L.B., Fioreze, I. et al. (2003) Haematological Changes in Jundia (Rhamdiesquelen) after acute and chronic stress caused by usual aquacultural management, with emphasis on immuno suppressive effects Aquaculture 237, 229-236. .
- Borges, A., Scotti, L.V., Siqueira, D.R., Zanini, R., Do Amaral, F., et al. (2007) Changes in hematological and serum biochemical values in jundiaRhamdiaquelen due to sub-lethal toxicity of cypermethrin. Chemosphere 69, 920-926.
- Buckley, J.A., Whitmore, C.M., Matsuda, R.I. (1976) Changes in blood chemistry and blood cell morphology in coho salmon, Oncorhynchuskisutch following exposure to sublethal levels of total residual chlorine in municipal wastewater. J fish research board Canada 33, 776-782.
- Camargo, M.M.P., Martinez, C.a.B.R. (2006) Biochemical and physiological biomarkers in Prochiloduslineatus submitted to in situ tests in an urban stream in southern Brazil. Environ ToxicolPharmacol21, 61–69.
- Cole, M.B., Arnold, D.E., Watten, B.J., Krise, W.F. (2001) Haematological and physiological responses of brook charr, to untreated and limestoneneutralized acid mine drainage. J Fish Biol59, 79–91.
- Dacie, S.J.V., Lewis, S.M. (2002) 'Practical haematology 11th edition.' (Churchill Livingstone: UK).
- Davis, A.K., Maney, D.L., Maerz, J.C. (2008) The use of leukocyte profiles to measure stress in vertebrates: a review for ecologists. Functional Ecol22, 760–772.
- Desai, B., Parikh, P. (2012) Impact of Curzate (fungicide) on Hematological Parameters of Oreochromismossambicus. International J Scientific Engineering Res 3, 2229-5518.
- El-Naggar, A., Mahmoud S., Tayel, S. (2009) Bioaccumulation of Some Heavy Metals and Histopathological Alterations in Liver of Oreochromisniloticus in Relation to Water Quality at Different Localities along the River Nile, Egypt. World Journal of Fish and Marine Sciences 1, 105-114.
- Ezeri, G.N., Gabriel, U.U., Opabunmi, O.O. (2004) Haematological response of cultured and wild Clariasgariepinus to acclimation. Environment and Ecology 22, 628-632.
- Gupta, A., Chandra, R. (2013) Impact of effluent of River Ramganga on the haematology of fresh water fish (Heteropneustesfossilis). International JEnvironmental Sci4, 19-22.
- Hadi, A., Shokr, A., Alwan, S. (2009) Effects of aluminum on the biochemical parameters of freshwater fish Tilapia zillii. JScientific Applications 3, 33-41.
- Heath, A. (1996) 'Water pollution and fish physiology.' (Lewis Publs.: CRC Press, Boca Raton, Fla.).
- Heier, L.S., Teien, H.C., Oughton, D., Tollefsen, K.E., Olsvik, P.A et al. (2013)Sublethal effects in Atlantic salmon (Salmosalar) exposed to mixtures of copper, aluminium and gamma radiation. JEnvironment Radioactivity 121, 33-42.
- Hoeger, B., van den Heuvel, M., Hitzfeld, B.C., Dietrich, D.R. (2004) Effects of treated sewage effluent on immune function in rainbow trout (Oncorhynchusmykiss). Aquatic Toxicol70, 345-355.
- Houston, A.H. (1997) Review: Are the classical hematological variables acceptable indicators of fish health? Transactions of the American Fisheries Society 126, 879-894.
- Houston, A.H., Blahut, S., Murad, A., Amirtharaj, P. (1993) Changes in erythron organization during prolonged cadmium exposure: an indicator of heavy metal stress? Canadian Journal of Fisheries and Aquatic Sciences 50, 217-222.
- Jeronimo, G.A., Martins, M.L., Bachmann, F., Greiner-Goulart, J.A., Schimitt-Junior, A.A., et al. (2009) Hematological parameters of Pimelodus maculates (Osteichthyes: Pimelodidae) from polluted and non-polluted sites in the Itajaı-Acu River, Santa Catarina State, Brazil. ActaSciBiolSci31,179–183.
- Kamal, S.M., Omar, W.A. (2011) Effect of Different Stocking Densities on Hematological and Biochemical Parameters of Silver Carp, Hypophthalmichthysmolitrix Fingerlings. Life Science J 8, 580-586.
- Kayode, S.J.,Shamusideen, S.A. (2010) Haematological studies of Oreochromisniloticus exposed to diesel and drilling fluid in Lagos, Nigeria. International JBiodiversity and Conservation 2, 130-133.
- Kori-Siakpere, O., and Ubogu, E.O. (2008) Sublethalhaematological effects of zinc on the freshwater fish, Heteroclarias sp. (Osteichthyes: Clariidae). African J Biotechnology 7, 2068-2073.
- Lakshmi, R., Kundu, R., Thomas, E., Mansuri, A.P. (1991) Mercuric chloride induced inhibation of acid and alkaline phosphatase activity in the kidney of Mudskipper; BoleophthalmusdentatusActahydrochimica et hydrobiologica3, 341-344.
- Levesque, H.M., Moon, T.W., Campbell, P.G.C., Hontela, A. (2002) Seasonal variation in carbohydrate and lipid metabolism of yellow perch (Percaflavescens) chronically exposed to metals in the field. Aquatic Toxicol60, 257-267.
- Li, Z.H., Velisek, J., Grabic, R., Li, P.,Kolarova, J et al. (2011) Use of hematological and plasma biochemical parameters to assess the chronic effects of a fungicide propiconazole on a freshwater teleost. Chemosphere 83, 572-578.
- Lowe-Jinde, L., Niimi, A.J. (1983) Influence of sampling on the interpretation of haematological measurements of rainbow trout, Salmogairdneri. Canadian JZoology 61, 396-402.
- Matos, N.A., Silva, J.F., Damasceno, K.A., Cassali, G.D., Lemos, V.S., et al. (2014) Proteinase-activated receptor 2 blockade impairs CCL11-or allergen-induced eosinophil recruitment in experimental pleurisy. European J Pharmacol 740, 627-633.
- McDonald, M., Grosell, M. (2006) Maintaining osmotic balance with an aglomerular kidney. Comparative BiochemPhysiol143, 447-458.
- Mekkawy, I.A., Mahmoud, U.M., Sayed, A.E.-D.H. (2011) Effects of 4-nonylphenol on blood cells of the African catfish Clariasgariepinus (Burchell, 1822). Tissue and Cell 43, 223-229.
- Mekkawy, I.A.A., Mahmoud, U.M., Wassif, E.T., Naguib, M. (2010) Effects of cadmium on some haematological and biochemical characteristics of Oreochromisniloticus (Linnaeus, 1758) dietary supplemented with tomato paste and vitamin E. .Fish physiolBiochem37, 71-84.
- Mohanty, B.K., Mishra, B.N. (1983) Effects of Mercurial drug (Kajyoli) on Albino rat blood. J Environmental Biol4, 201-206.
- Mukherjee, J.R., Shiha, G.M. (1993) Cadmium toxicity on haematological and biochemical aspects in an Indian freshwater major carp, Labeorohita (Hamilton). J Freshwater Biol5, 245-251.
- Murad, A.,Houston, A.H. (1992) Maturation of the goldfish (Carassiusauratus) erythrocyte. Comparative BiochemPhysiolA102, 107-110.
- Murray, R.K., Granner, D.K., Mayes, P.A., Rodwell, V.W. (1991) 'Harpers Biochemistry. 22 nd edition ' (Lange Medical Books/McGraw-Hill: New York).
- Musa, S., Aura, C., Ogello, E., Omondi, R., Charo-Karisa, H., et al. (2013)Haematological Response of African Catfish (Clariasgariepinus, Burchell 1822) Fingerlings Exposed to Different Concentrations of Tobacco (Nicotianatobaccum) Leaf Dust. Zoologypp: 7.
- Niimi, G., Imada, H. (2008) Observation of non-nucleated erythrocytes in the peripheral blood of medaka, Oryziaslatipes. Okajimas Folia Anatomica Japonica 85, 1-3.
- Nussey, G., van Vuren, J., du Preez, H. (2000) Bioaccumulation of chromium, manganese, nickel and lead in the tissues of the moggel, Labeoumbratus (Cyprinidae), from Witbank Dam, Mpumalanga. WATER SA 26, 269-284.
- Ololade, I.A., Oginni, O. (2010) Toxic stress and hematological effects of nickel on African catfish, Clariasgariepinus, fingerlings. JEnviron ChemEcotoxicol2, 014-019.
- Oner, M., Atli, G., Canli, M. (2008) Changes in serum biochemical parameters of freash water fish Oreochromisniloticus following prolonged metal (Ag, Cd, Cr, Cu, Zn) exposures. Environmental toxicol and chemistry / SETAC 27, 360-336.
- Osman, A., Abd ElReheem, A., AbuelFadl, K., GadEl-Rab, A. (2010a) Enzymatic and histopathologic biomarkers as indicators of aquatic pollution in fishes. Natural Sci2, 1302-1311.
- Osman, A.G., Koutb, M., Sayed, A.H. (2010b) Use of hematological parameters to assess the efficiency of quince (Cydoniaoblonga Miller) leaf extract in alleviation of the effect of ultraviolet--A radiation on African catfish Clariasgariepinus (Burchell, 1822). J photochemphotobiol B-biol99, 1-8.
- Osman, A.G.M. (2012) Biomarkers in Nile tilapia Oreochromisniloticusniloticus (Linnaeus, 1758) to assess the impacts of river Nile pollution: bioaccumulation, biochemical and tissues biomarkers. JEnvironmental Protection 3, 966-977.
- Osman, A.G.M., Abd El Reheema, A.-E.-B.M., Moustafa, M.A., Mahmoud, U.M., Abuel-Fadld, K.Y., et al. (2011) In situ evaluation of the genotoxic potential of the river Nile: I.Micronucleus and nuclear lesion tests of erythrocytes of Oreochromisniloticusniloticus (Linnaeus, 1758) and Clariasgariepinus (Burchell, 1822). Toxicol Environ Chem93, 1002-1017.
- Osman, A.G.M., Kloas, W. (2010) Water Quality and Heavy Metal Monitoring in Water, Sediments, and Tissues of the African Catfish Clariasgariepinus (Burchell, 1822) from the River Nile, Egypt. JEnviron Protection 1, 389-400.
- Poléo, A., Hytteørd, S. (2003) The effect of aluminium in Atlantic salmon (Salmosalar) with special emphasis on alkaline water. J Inorganic Biochem97, 89-96.
- Rodriguez-Cea, A., Ayllon, F., Garcia-Vazquez, E. (2003) Micronucleus test in freshwater fish species: an evaluation of its sensitivity for application in field surveys.Ecotoxicology and environmental safety 56, 442-8.
- Rowan, M.W. (2007) Use of blood parameters as biomarkers in brown bullheads (Ameiurusnebulosus) from lake Erie tributaries and cape cod ponds. Ohio University, Ohio State
- Ruas, C.B.G., Carvalho, C.D., de Araujo, H.S.S., Espindola, E.L.G., Fernandes, M.N. (2008) Oxidative stress biomarkers of exposure in the blood of cichlid species from a metal-contaminated river.Ecotoxicol environment safety 71, 86-93.
- Sadauskas-Henrique, H., Sakuragui, M.M., Paulino, M.G., and Fernandes, M.N. (2011).Using condition factor and blood variable biomarkers in fish to assess water quality. Environmental Monitoring and Assessment 181(1-4), 29-42. [In English]
- Sayed, A.H., Ibrahim, A.T., Mekkawy, I.A.A., Mahmoud, U.M. (2007)Acute effects of Ultraviolet-A radiation on African Catfish Clariasgariepinus (Burchell, 1822). JPhotochemPhotobiolB-Biol89, 170-174.
- Sayed, A.H., Mekkawy, I.A., Mahmoud, U.M. (2011) Effects of 4-nonylphenol on metabolic enzymes, some ions and biochemical blood parameters of the African catfish Clariasgariepinus (Burchell, 1822) African JBiochem Res 5, 287-297.
- Secombes, C.J., Fletcher, T.C., White. A., Costello, M.J., Houlihan, D.F., et al. (1992) Effect of sewage sludge on immune responses in the dab Limandalimanda L. Aquatic Toxicol23, 217-230.
- Seriani, R., Abessa, D.M.S., Kirschbaum, A.A., Pereira, C.D.S., Romano, P., et al. (2011) Relationship between water toxicity and hematological changes on Oreochromisniloticus. Brazilian JAquatic SciTechnol15, 47-53.
- Shah, S.L., Altindag, A. (2005) Alterations in the immunological parameters of tench (Tincatinca) after acute and chronic exposure to lethal and sublethal treatments with mercury, cadmium and lead Turkish J Veterinary and Animal Sciences 29, 1163-1168.
- Shaw, A.F. (1930) A direct method for counting the leucocytes, thrombocytes and erythrocytes of birds blood.Journal of pathology and Bacteriology 33, 833-835.
- Singh, B.P., Tandon, P.K. (2009) Effect of river water pollution on hematological parameters of fish, Wallagoattu. Research in Environment and Life Sciences 2, 211-214.
- Sudova, E., Piackova, V.,Kroupova, H., Pijacek, M., Svobodova, Z. (2009) The effect of praziquantel applied per os on selected haematological and biochemical indices in common carp (Cyprinuscarpio L.). Fish PhysiolBiochem35, 599–605.
- Summarwar, S. (2012) Comparative heamatological studies of Clariasbatrachus in Bisalpur reservoir and Pushkarlake. Indian JFundamental Applied Life Sci2, 230-233.
- Svoboda, M., Luskova, V., Drastihova, J., Zlabek, V. (2001) The effect of diazinon on haematologicalindces of common carp (Cyprinuscarpio). ActaVeterinaria BRNO 70, 457-465.
- Valon, M., Valbona, A., Fahri, G., Dhurata, K. (2012) Use of Blood Parameters as Biomarkers of Contaminant Exposure in Fish Specimens from Sitnica River, Kosovo. J International EnvironApplication Sci7, 971-977.
- Vinodhini, R.,Narayanan, M. (2009) The impact of toxic heavy metals on the hematological parameters in common carp (cyprinuscarpio l.). Iranian JEnvironmental Health Sci Engineering 6, 23-28.
- Winkaler, E.U., Silva, A.G., Galindo, H.C., Martinez, C.B.R. (2001)Biomarcadoreshistol´ogicos e fisiol´ogicospara o monitoramento da sa´ude de peixes de ribeir˜oes de Londrina, Estado do Paran´a. ACTA Scientiarum23, 507-514.
- Woodling, J.D. (1999) Physiological and weight changes of wild brown Trout inhabiting water with acutely toxic cadmium and zinc concentration : An insitu study. Proc World Fish Convention 23, 232-238.
- Yang, J.L., Chen, H.C. (2003) Effects of gallium on common carp (Cyprinuscarpio): acute test, serum biochemistry, and erythrocyte morphology. Chemosphere 53, 877-882.
- Zaki, M.S., Mostafa, S.O., Fawzi, O.M., Khafagy, M., and Bayumi, F.S. (2009)Clinicopathological, Biochemical and Microbiological Change on Grey Mullet Exposed to Cadmium Chloride. American-Eurasian JAgriculture EnvironSci5, 20-23.
- Zaki, M.S., Moustafa, S., Fawzi, O.M., El Bellbasi, H., Syame, S., et al. (2010) Assessment of the hazardous effect of lead Pollution on tilipiazilli , including hematological, Biochemical and immunological parameters. Report Opinion2, 82-89.
- Zutshi, B., Prasad, S.G.R., Nagaraja, R. (2010) Alteration in hematology of Labeorohita under stress of pollution from Lakes of Bangalore, Karnataka, India. Environmental Monitoring and Assessment 168, 11-19.


