Keywords
Polymerase chain reaction; Processed shrimp; Mitochondrial DNA; Cytochrome b gene; Partial least square PLS1 regression
Introduction
The prevalence of mitochondrial DNA use for species differentiation and foodstuffs traceability is fairly well established (Chandrika et al., 2010). Although nuclear DNA is more powerful, mtDNA was more extensively exploited as it is more stable over time and conditions due to its circular configuration, presence in thousands of copies within mitochondria and is extractable from highly degraded source such as processed food (Brown et al., 1979, Wiesne et al., 1991, Prado et al., 2005, Kaniak-Golik et al., 2015).
Various different methods can be applied for DNA extraction from diverse sources of samples, but the recuperation of highquality of DNA represents a challenging step for subsequent applications such as electrophoresis, polymerase chain reaction (PCR) and sequencing. Difficulty in isolating intact and sufficient DNA from samples differs with the physico-biochemical natures of the tissue (Rumpho et al., 1994). For instance, polysaccharides, naturally present in tissue may not completely be removed using classical DNA extraction, causing inhibition of DNA amplification (Cawthorn et al., 2011; Besbes et al., 2015). Thus, DNA-based methods are highly dependent on the extraction and purification techniques (Lockley et al., 2002; Di Pinto et al., 2007) and selection of the appropriate method according to sample matrix type is crucial. For instance, for canned pelagic fish such as tune and sardines, sample pre-treatment including tissues defatting is necessary before DNA extraction (Bauer et al., 2003; Jérôme et al., 2003; Chapela et al., 2007).
During the last decades, various protocols have been described including the phenol–chloroform-based approaches (Besbes et al., 2011), the CTAB extraction method with modifications and the use of commercial kit (Jérôme et al., 2003, Jérôme et al., 2003, Olexová et al., 2004). For the specific shrimp matrix, seven DNA extractions were performed and were followed by purification procedures. For the comparative investigation, discussion was made on the basis of the best extraction, DNA purity and DNA suitability for amplification from fresh and processed shrimp. The aim of this work is to define the adequate, but relatively easy, reliable and cheap method to extract high quality and quantity of DNA from various types of shrimp products, for subsequent application including PCR and sequencing.
Materials and Methods
Commercial food products
Freshly caught shrimp (Parapenaeus longirostris, Metapenaeus kerathurus) along the Tunisian coast and refrigerated shrimp (Metapenaeus monoceros, Plezionika heterocarpus) bought from seafood plant; were taxonomically identified with respect to external characters. Three shrimp-type products were purchased from Tunisian supermarkets in frozen state (cooked, peeled precooked and breaded). Upon arrival in the laboratory, all samples were stored at -80°C until analysis.
The extraction of mt-DNA from the flesh (cephalo-thorax part) was performed for all samples according to the different protocols (EX1- EX7). Careful attention of flesh sampling was given for breaded shrimp to avoid matrix contamination.
DNA Extraction
Kit fast DNA (EX1)
The DNA was extracted following the Kit -manufacturer’s instructions. To the weighed subsample (0.1 g); 800 μl Genomic Lyse buffer was added (to lyse the cells and solubilise the proteins, DNA and other cellular constituents) in the presence 0.1 mg (3.2 U) of Proteinase K (to digest the protein) and incubated at 65°C for 10 to 30 minutes. The DNA-containing solution was mixed with the genomic binding buffer (100 μl), then eluated on a column which binds the DNA.
Method using the phenol–chloroform–isoamyl alcohol: SDS/PCI (EX2)
The extraction of DNA was performed according to Besbes et al., 2011 with the following modifications. As shrimp muscle contains fewer lipids, a one step DNA extraction was performed. Sample (0.1 g) was homogenised with 500 μL of the buffer A (50 mM Tris–HCl, 100 mM EDTA and 1% SDS with pH 8.0) and 0.1 mg (3.2 U) of proteinase K (Sigma Aldrich, France). The mixture was incubated at 55°C with continuous shaking during 4 h, cooled on ice and then centrifuged at 12,000g for 10 min. The supernatant was extracted with phenol–chloroform–isoamylic alcohol in a 25:24:1 ratio, then precipitated with 600 μL of isopropanol at -20°C and mixed by inversion. Using ethanol (70%), the pellet was washed and dried, then resuspended in 50 μL TE buffer.
Method using the SDS/PCI/NaCl (EX3)
In this case, the same procedure was applied to 0.1 g of sample using the SDS/PCI method (Hsieh et al., 2005), but with the addition of NaCl to the buffer A (final concentration of 0.2 M NaCl).
Method using Chelex (EX4)
The sample (0.1 g) was homogenised in 300 μL of a Chelex water solution (5% -Chelex 100 resin Qiagen) mixed with 20 μL of proteinase K (0.1 mg) and 30 μL TE buffer; incubated at 56°C during 4 h and followed by a heating (100°C) for 15 min (Jérôme et al., 2003). The solution was centrifuged (12,000 g for 10 min), the DNA pellet for PCR amplification was stored at 4°C until use.
Method using CTAB/CI (EX5)
The shrimp sample (0.1 g) was grinded in 500 μL pH 8- CTAB buffer (100 mM Tris–HCl, 20 mM EDTA, 2% hexadecyl– trimethyl ammonium bromide, and 1.4 M NaCl), to which was added 50 μL ß-mercaptoethanol 0.2% at final concentration, 0.1 mg (3.2 U) of proteinase K (modified method of Quinta et al., 2004), and incubated at 65°C for 12 h. The solution was then centrifuged at 12,000 g (10 min), the supernatant was extracted with chloroform–isoamylic alcohol and precipitated with ethanol. The pellets were finally re-suspended in TE buffer.
Method using TRITON/CI chloroform–isoamyl alcohol (EX6)
The muscle tissue (0.1 g) was homogenized in 500 μL of pH 8.0-buffer B (2 mM EDTA,10 mM Tris–HCl), to which was added 50 μL ß-mercaptoethanol 0.2% at final concentration and 50 μL Triton X-100 at 1% final concentration and 0.1 mg (3.2 U) of proteinase K (Besbes et al., 2011). The mixture was incubated at 65°C for 12 h, and then centrifuged at at 12,000 g (4°C-10 min). The suspended DNA was mixed vigorously with an equal volume of chloroform–isoamylic alcohol and then centrifuged at 12,000g (10 min). For DNA precipitation, ethanol and sodium acetate were added to the supernatant, the pellets were then resuspended in 50 μL TE buffer.
Method using DNeasy tissue kit (EX7)
DNA was extracted by means of a commercial kit (DNeasy Tissue kit, Qiagen, Darmstadt, Germany), as previously described (Prado et al., 2005), 25 mg of sample were homogenized with 180 μl of lysis buffer ATL and 20 μl proteinase K. The homogenate was incubated during 3 h at 56°C and then Vortex for 15 s. 200 μl Buffer AL were then added to the sample, and thoroughly mixed by vortexing. The supernatant, obtained after centrifugation at 6000 g for 5 min at room temperature, was added to 200 μl ethanol. The mixture (400 μl) was then eluated on the DNeasy Mini spin column where DNA was bonded to the silica-gel membrane during the centrifugation steps. The bounded DNA-DNeasy Mini spin membrane was washed using two different washing buffers, and then eluted using the elution buffer.
Evaluation of DNA quantification and purity
The quantification of DNA was measured using a spectrophotometer (absorbance at 260 nm) and its purity was checked using the ratio A260/A280 as described by Sambrock et al. (1989).
PCR Amplification
The purified DNA was used for PCR amplification. As processing cause DNA degradation, the primers UnivPF (50-GACAATACCAATTCGTAAATC) and UnivPR (50- CCATAATAAATACCTCGTCC-30) designed using Mega software and based on the highly conserved sequence among the target species and were used for this study, allowed the amplification of a 315 bp fragment. A final reactional volume of 5 μL was used for PCR amplification. For each reaction, 100 ng of extracted DNA template were mixed with 5 μL of 5xPCR buffer, 2 μL of dNTP mix (10 mM of each); 50 pmol of each primer, 3 mM of MgCl2 and 5 U of Taq DNA polymerase (Go-Taq, Promega, France). The PCR conditions used for amplification passed by a step of denaturation (94°C for 5 min), ensued by 35 cycles consisting of 94°C for 30s, 55°C for 30s, 72°C for 40s, and finally by an extension step (72°C for 7 min). Eelectrophoresis (2% agarose gel, TBE buffer containing 1 mM EDTA, 45 mM Tris borate, pH 8, and 0.2 μg/mL ethidium bromide) was used to check DNA amplification. Before sequencing, the PCR products were visualised via ultraviolet trans-illumination. A commercial 100pb DNA ladder (Fermentas, France) was used to compare the size of the resulting DNA fragments.
Statistical Analysis
All results were presented as mean ± standard deviation (n=6) and statistical analyses were performed using ANOVA with an SPSS Statistical Software System 11.01 (SPSS Chicago, IL, USA). Eventual significant differences among mean values (5% level) were checked using Tukey’s test. Data were treated by partial least squares (PLS1) regression using multivariate statistical software (Unscrambler version 9.8, CAMO Software AS, Oslo, Norway), and were subjected to Leverage correction and cross validation. In order to compensate for the different scales of the variables, they were weighted with the inverse of the standard deviation of all the objects. The influence of the studied variables on PCR amplification was examined using Martens Uncertainty test.
Results and Discussion
Evaluation of DNA yield, purity and amplificability
The different samples used to evaluate the DNA yield and purity, included the tissue of fresh shrimp and that of moderately (frozen) and highly processed (breaded and cooked) products. Gel electrophoresis and spectrophotometry analysis revealed significant differences (p<0.05) in DNA yield and purity according to the procedure of extraction and sample matrix (Table 1). In the process of DNA extraction, 3 steps are necessary including breaking cell walls, nucleic material release from the nuclei into the media and DNA precipitation. In this study, the highest precipitated amount of DNA was obtained following the PCI/SDS protocol and that, independently of fresh or processed shrimp (Table 1). However, adding NaCl to the PCI/SDS medium induced a significant decrease in DNA levels in all analysed sample. Such result could be due to the inadequate concentration used in this experiment as NaCl has either dispersive or binding effects on DNA fragment causing its precipitation along with proteins (Bauer et al., 2013, Besbes et al., 2011). However, no optimisation of NaCl concentration was performed in this study as sufficient quantity of DNA level with good purity (A260/A280 ratio >1.81) was obtained in all cases.
| Sample |
Extraction methods |
DNA (ng/µl extract) |
A260/ A280 |
PCR |
| Penaeuskerathurus |
Kit Fast DNA MP |
32.9 ± 1.47a |
2.08 ± 0.0125 |
+ |
| PCI/SDS |
1691.78 ± 15.48b |
2.05 ± 0.03 |
+ |
| PCI/SDS/NaCl |
277.41 ± 9.41c |
1.97 ± 0.02 |
+ |
| CHELEX |
308.1 ± 16.66c |
1.87 ± 0.06 |
+ |
| CTAB |
617.5 ± 39.56e |
1.87 ± 0.065 |
+ |
| TRITON |
635.8 ± 37.2e |
1.86 ± 0.01 |
+ |
| DNeasy Tissue kit |
92.9 ± 1.52f |
1.88 ± 0.01 |
+ |
| Parapenaeuslongirostris |
Kit Fast DNA MP |
41.6 ± 1.8a |
2.08 ± 0.062 |
+ |
| PCI/SDS |
1486.46 ± 14.44b |
2.01 ± 0.035 |
+ |
| PCI/SDS/NaCl |
228.26 ± 8.17c |
1.97 ± 0.02 |
+ |
| CHELEX |
290.1 ± 32.4c |
1.82 ± 0.015 |
+ |
| CTAB |
440.1 ± 21.93d |
2.01 ± 0.015 |
+ |
| TRITON |
601.75 ± 28.49e |
1.98 ± 0.005 |
+ |
| DNeasy Tissue kit |
84.9 ± 2.7f |
1.72 ± 0.02 |
+ |
| Metapenaeusmonoceros |
Kit Fast DNA |
41.1 ± 0.50a |
1.86 ± 0.015 |
- |
| PCI/SDS |
1411,46 ± 13,10b |
2.01 ± 0.015 |
+ |
| PCI/SDS/NaCl |
284.5 ± 17.03c |
2.05 ± 0.045 |
- |
| CHELEX |
220.3 ± 3.61c |
1.91 ± 0.045 |
+ |
| CTAB |
585.8 ± 22.69d |
1.90 ± 0.055 |
+ |
| TRITON |
625.35 ± 30.05d |
1.98 ± 0.01 |
+ |
| DNeasy Tissue kit |
105.67 ± 1.4e |
1.88 ± 0.04 |
+ |
| Plesionikaheterocarpus |
Kit Fast DNA MP |
41.7 ± 0.71a |
1.87 ± 0.06 |
- |
| PCI/SDS |
1679.5 ± 26.52b |
1.98 ± 0.015 |
+ |
| PCI/SDS/NaCl |
233.2 ± 17.34c |
1.95 ± 0.015 |
+ |
| CHELEX |
89.0 ± 2.67d |
1.39 ± 0.02 |
- |
| CTAB |
412.3 ± 13.57e |
1.99 ± 0.005 |
+ |
| TRITON |
588.61 ± 29.98f |
1.84 ± 0.025 |
+ |
| DNeasy Tissue kit |
84.17 ± 0.6d |
1.82 ± 0.01 |
+ |
| Cooked shrimp |
Kit Fast DNA MP |
12.5 ± 7.24a |
1.61 ± 0.01 |
- |
| PCI/SDS |
1015.6 ± 4.95b |
2.01 ± 0.005 |
+ |
| PCI/SDS/NaCl |
130.86 ± 7,58c |
2.02 ± 0.015 |
- |
| CHELEX |
53.03 ± 11.16d |
1.13 ± 0.02 |
- |
| CTAB |
450.26 ± 12.46e |
2.01 ± 0.02 |
- |
| TRITON |
328.1 ± 11.96e |
2.00 ± 0.02 |
+ |
| DNeasy Tissue kit |
87.17 ± 3f |
1.71 ± 0.01 |
+ |
| Frozen peeled precooked shrimp |
Kit Fast DNA MP |
10.8 ± 0.16a |
1.69 ± 0.01 |
- |
| PCI/SDS |
1090.03 ± 11.05b |
1.82 ± 0 |
+ |
| PCI/SDS/NaCl |
59.51 ± 7.39e |
1.73 ± 0.01 |
- |
| CHELEX |
44.53 ± 15.10 c |
1.21 ± 0.01 |
- |
| CTAB |
62.3 ± 1.20e |
1.97 ± 0.03 |
+ |
| TRITON |
391.9 ± 17.8d |
1.92 ± 0.015 |
+ |
| DNeasy Tissue kit |
64.13 ± 8e |
1.41 ± 0.01 |
+ |
| Breaded Shrimp |
Kit Fast DNA MP |
19.4 ± 0.3a |
1.71 ± 0.005 |
- |
| PCI/SDS |
1079.53 ± 7.16b |
2.01 ± 0.01 |
+ |
| PCI/SDS/NaCl |
47.35 ± 8.70c |
1.36 ± 0.005 |
- |
| CHELEX |
91.3 ± 19.52d |
1.14 ± 0.015 |
- |
| CTAB |
52,7 ± 37.83e |
1.50 ± 0.01 |
- |
| TRITON |
263.1 ± 12.52f |
1.63 ± 0.015 |
- |
| DNeasy Tissue kit |
58.87 ± 6.2e |
1.52 ± 0.01 |
+ |
Table 1: Comparison of DNA yield, purity, PCR positive amplification for several foodstuffs of shrimp extracted with six different methods studied.
Significant lower DNA contents were obtained for cooked and breaded shrimp when using specific method such as the Chelex or DNeasy Tissue Kit procedure (Table 1). Moreover for such processed samples, both methods yielded poor DNA quality (A260/A280 <1.21) which may be attributed to interferences with substances such as protein and flavouring aromatic compounds added to shrimp preparation.
Similarly, both CTAB and Triton methods revealed considerable low DNA quantities, especially in breaded shrimp with poor DNA quality (A260/A280=1.50–1.63 respectively). In addition, poor reproducibility of DNA extraction was noticed as generally high standard errors were found for DNA quantification for fresh and processed shrimp. Among all trials, Fast DNA kit method yielded the lowest DNA recovery in all samples with values ranging from 10.8 to 41.7 ng DNA/μL of extract. Such kit was found inappropriate to DNA precipitation and recovery in shrimp matrix. The quantity and quality of the extracted DNA from shrimp clearly depended on the type of matrix and on the level of processing. Several parameters including the degree of DNA damage occurring during processing and the extraction procedure, as well as the average length of DNA fragments, affect considerably the success of DNA amplification. In this study, the DNA extracted from the different shrimp matrices were differently amplified with a set of primers amplifying the 315 bpcytochrome b fragments as shown in Table 1 and Figure 1. The amplification was successful particularly in fresh shrimp which was used as reference, but was difficult in breaded and cooked shrimp; proving that processing may damage the DNA. Thus DNA-fragments from fresh shrimp tissues were amplified by PCR independently of the extracting methods (Table 1). Concerning the DNA from the various processed shrimp matrices, only DNA extracted with the PCI/SDS and DNeasy Tissue kit gave a PCR product of the 315 bp-expected size for all the analysed samples (Figure 1 and Table 1).
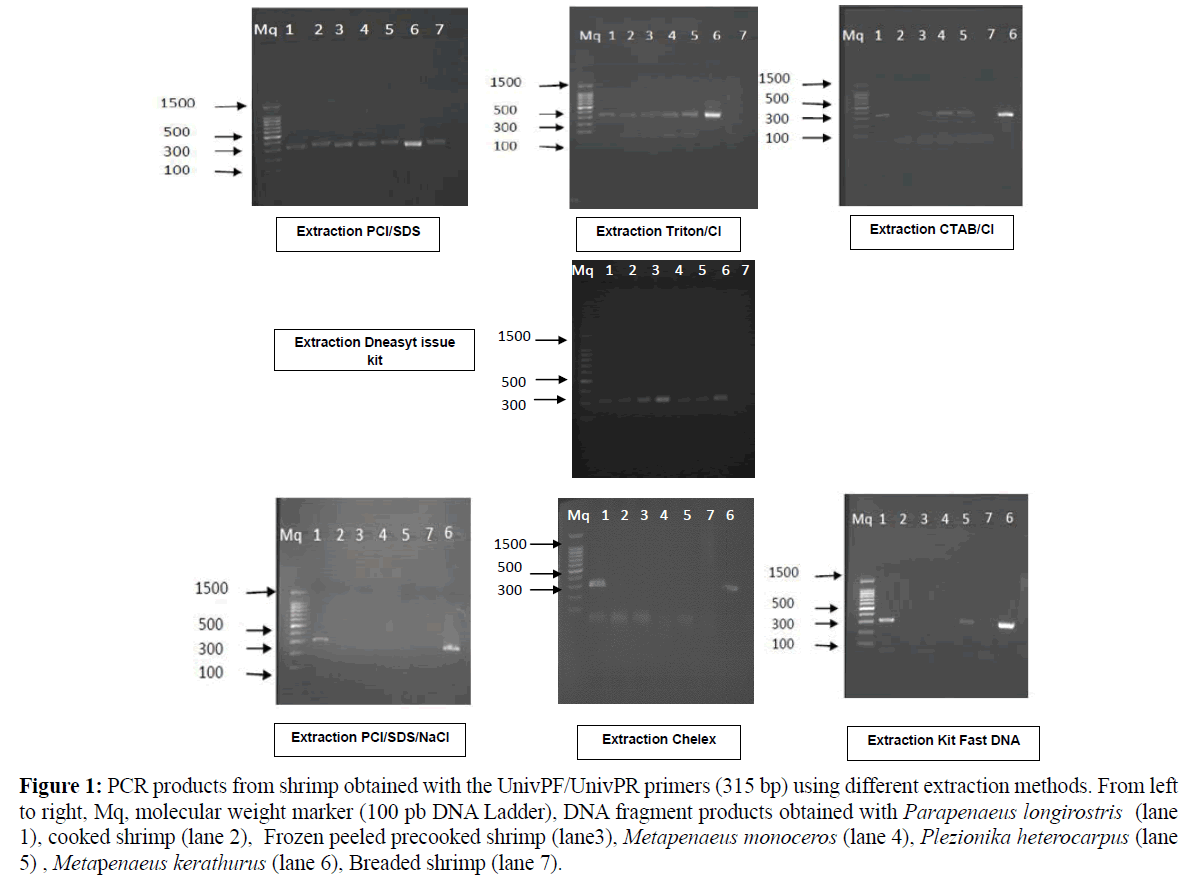
Figure 1: PCR products from shrimp obtained with the UnivPF/UnivPR primers (315 bp) using different extraction methods. From left to right, Mq, molecular weight marker (100 pb DNA Ladder), DNA fragment products obtained with Parapenaeus longirostris (lane 1), cooked shrimp (lane 2), Frozen peeled precooked shrimp (lane3), Metapenaeus monoceros (lane 4), Plezionika heterocarpus (lane 5) , Metapenaeus kerathurus (lane 6), Breaded shrimp (lane 7).
Partial least square regression analysis
In this study, Partial least squares regression models (PLSR) were performed to identify the most significant variable relative to the different extraction method to PCR amplification of fresh and shrimp products (Martens & Næs, 1989). The PCR amplification was used as Y-matrix; all the others parameters (DO, A260/A280, DNA Yield, extraction methods and shrimp sample type) as X-variables.
The loading plot of shrimp (Figure 2) corresponded to a variance in PCR result of 62%, of which 59% was along PC1 and 3% along PC2. Of the total variation of all other variables (28%), 16% was along PC1 and 12% along PC2. Such result highlighted that fresh tissue (right upper region) is a discriminating parameter. The comparison of the different shrimp products revealed that, DO A260/A280, DNA YIELD, fresh shrimp (right hand side) and Breaded/Cooked shrimp (left hand side) contribute the most to important variations on PC1. The PC2 was mainly describing processed shrimp product. When comparing the extraction methods, results showed that DO, A260/A280, DNA YIELD, EX2, EX7, EX5 and EX6 (right hand side) and EX1, EX3, EX4 (left hand), contribute the most to the significant variation on PC1. Results showed that EX2, EX7, EX5 and EX6 were positively correlated with PCR amplification, while EX1, EX3, EX4 were negatively correlated with results of PCR. Such data confirmed results previously recorded for the DNA yield/purity and amplicon observed on agarose gel. In conclusion, comparing all products, the fresh shrimp yielded the highest amounts of DNA independently of the extraction methods; while matrices with high degree of processing such as breaded shrimp and cooked shrimp, yielded the lowest amounts of DNA.

Figure 2: Loading plots from partial least square PLS1 regression carried out on all X-variables DO: A260/A280, DNA YIELD, EX1:Kit fast DNA method, EX2: PCI/SDS method, EX3: SDS/PCI/NaCl method, EX4: CHELEX method, EX5: CTAB/CI method, EX6: TRITON/CI method, EX7: DNeasy Tissue kit method and all shrimp sample foodstuff and the Y-variable (PCR RESULT: PCR amplification). All data in the PCA projections represent the means value of 6 replicates for each parameter.
The quality of DNA, with the highest amplicon length obtained from the fresh and the different shrimp food product, was best preserved using the SDS/PCI precipitation method, with the advantage of being the fastest and simplest protocol and is less expensive than the commercial kit. The relatively high values of the PLS1 of all the data (62%), suggest substantial difference between the extraction procedures and matrices when all the studied parameters were compared. Such statistical data confirm results previously recorded. Thus, the SDS/PCI method can be a good choice for processed shrimp products. Based on the present result, amplification of cyt b gene of a species particularly in processed food; dependent on the applied processing technique. When all studied parameters were compared, Partial least squares regression models (PLSR) suggested substantial difference between the extraction procedures and matrices; confirming previously recorded results. Among all tested protocols, the PCI/ SDS was identified as the most suitable method for the extraction of DNA from shrimp: with high DNA yields, a relative ease of use, less expensive than the commercial kit and the applicability for high throughput extraction from multiple specimens especially from highly processed foodstuffs.
Conflict of Interests
The authors declare no conflict of interest.
Acknowledgments
This work was conducted within the project entitled Biotechnologie Marine Vecteur d’Innovation et de Qualité - BIOVecQ PS1.3_08 co-financed by the European Union through the European Neighborhood and Partnership Instrument (ENPI) Italy-Tunisia program and the Tunisian Ministry of Higher Education.
21279
References
- Bauer, T., Weller, P., Hammes, W.P., Hertel, C. (2003) The effect of processing parameters on DNA degradation in food. Eur Food Research Tech 217, 338-343.
- Besbes, N., Fattouch, S., Sadok, S. (2011) Comparison of methods in the recovery and amplificability of DNA from fresh and processed sardine and anchovy muscle tissues. Food Chem129, 665-671.
- Besbes, N, Jérôme, M., Bergé, J.P., Amri, M., Sadok, S. (2015)Authenticating the origin of different shrimp products on the Tunisian markets by PCR/RFLP method. African Journal of Biotechnology 14.
- Brown, W.M., Jr G.M., Wilson, A.C. (1979) Genetics Rapid evolution of animal mitochondrial DNA. Proc. NatlAcadSci76,pp: 1967-1971.
- Cawthorn, D.M., Steinman, H.A., Witthuhn, R.C. (2011) Comparative study of different methods for the extraction of DNA from fish species commercially available in South Africa. Food Control 22, pp: 231-244.
- Chapela, M.J., Sotelo, C.G., Ricardo, I.P.M., Miguel, A.P., Begoña, P.V., et al. (2007) Comparison of DNA extraction methods from muscle of canned tuna for species identification. Food Control 18, pp: 1211-1215.
- Chandrika, M., Maimunah, M., Zainon, M.N., Son, R. (2010) Identification of the species origin of commercially available processed food products by mitochondrial DNA analysis. International Food Research 17,pp: 867-876.
- Di Pinto, A., Forte, V., Guastadisegni, M.C., Martino, C., Schena, F.P. (2007) A comparison of DNA extraction methods for food analysis. Food Control 18, pp: 76-80.
- Hsieh, H.S., Chai, T.J., Hwang, D.F. (2005) Rapid PCR–RFLP method for the identification of 5 billfish species. J Food Science 70, pp: 246-249.
- Jérôme, M., Lemaire, C., Bautista J.M., Fleurence, J.L., Etienne, M. (2003) Molecular Phylogeny and Species Identification of Sardines. J Agric Food Chem51, pp: 7326-7332.
- Jérôme, M., Lemaire, C., Verrez-Bagnis, V., Etienne, M. (2003) Direct sequencing method for species identification of canned sardine and sardine-type products. J Agric Food Chem51, pp: 7326-7332.
- Kaniak-Golik A.,Skoneczna A. (2015) Mitochondria–nucleus network for genome stability. Free Radical Biology and Medicine2,pp: 73-104.
- Lockley, A.K., Bardsley, R.G. (2000) DNA-based methods for food authentication. Trend Food Sci11, pp:67-77.
- Martens, H., Næs, T. (1989) Multivariate calibration. Chichester, UK: Wiley.
- Olexová, L., Dovicovicová, L., Kuchta, T. (2004).Comparison of three types of methods for the isolation of DNA from flours, biscuits and instant paps.Eur Food Research Tech 218, pp: 390-393.
- Pascoal, A., Barros-Velazquez, J., Cepeda, A., Gallardo, J.M., Calo-Mata, P. (2008) A polymerase chain reaction-restriction fragment length polymorphism method based on the analysis of a 16S rRNA/tRNA(Val) mitochondrial region for species identification of commercial penaeid shrimps (Crustacea: Decapoda: Penaeoidea) of food interest. Electrophoresis 29, pp: 499-509.
- Prado, M., Pascoal, A., Calo-Mata, P., Barros-Velázquez, J. (2005). Molecular methods for meat species identification and its application to foodstuffs and animal feeds. In A. P. Riley (Ed.), Food research, safety and policies. New York: Nova Science Publishers Incpp: 199-221.
- Quinta, R., Gomes, L., Teia dos Santos, A. (2004)A mitochondrial DNA PCR-RFLP marker for population studies of the black scabbard fish (Aphanopuscarbo). J. Marine Sci61, pp: 864-867.
- Rumpho, M.E., Mujer, C.V., Andrews, D.L., Manhart, J.R., Pierce, S.K. (1994) Extraction of DNA from mucilaginous tissues of a sea slug (Elysiachlorotica). Biotechniques17,pp: 1097-1101.
- Sambrock, J., Fritsch, E.F., Maniatis, T. (1989) Molecular cloning: a laboratory manual (2nd ed.). Cold Spring Harbor, New York: Cold Spring Harbor Laboratory press.
- Wiesner,R.J., Swift, H., Zak, R. (1991) Purification of mitochondrial DNA from total cellular DNA of small tissue samples. Gene. 98,pp:277-281.


