Keywords
Vibrio, tilapia, fish tank water, RAPD, typing
Introduction
Previous reported studies have indicated that the intestinal microflora of fish reared in fresh water or seawater were composed of just one or only a few principal bacterial species. Trust et al. (1978) demonstrated the Aeromonas hydrophila complex to be the predominant bacteria in the intestine of fresh water salmonids. Yoshimizu et al. (1976) reported that Aeromonas and Enterobacteriaceae were the principal genera in the intestinal microflora of fresh water salmonids while Vibrio was found to be the major genus in the intestine of seawater salmonids. Sakata et al. (1984) found Vibrio, Aeromonas and Pseudomonas to be the dominant genera in the intestine of tilapia reared in fresh water. It may be inferred that the intestinal flora will greatly influence the bacterial flora of the fish tank water of farm raised fish.
In the present study, we determined the predominant bacterial genera in samples from an inland fresh water tilapia farm located in Amherst, Massachusetts, U.S.A. This tilapia farm has certain unique features including nitrifying tanks housing sand particles coated with nitrifying bacteria (Nitrosomonas europa and Nitrobacter winogradskyi) for conversion of ammonia sequentially to nitrite and then to nitrate. The resulting nitrate is then consumed by hydroponically grown basil plants. This allows the fish tank water to be constantly recirculated with a loss of no more than about 2% of the total tank water daily (Figure. 1).
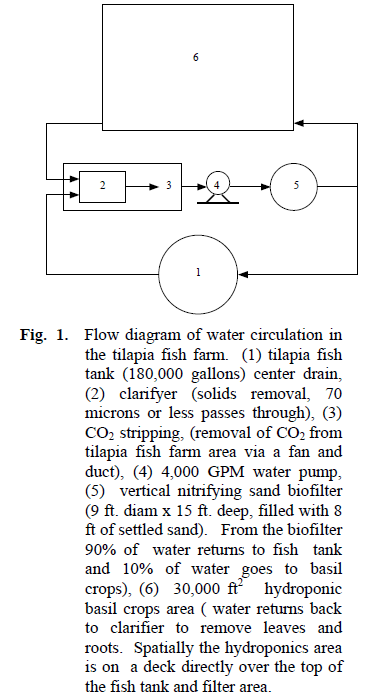
Figure 1. Flow diagram of water circulation in the tilapia fish farm. (1) tilapia fish tank (180,000 gallons) center drain, (2) clarifyer (solids removal, 70 microns or less passes through), (3) CO2 stripping, (removal of CO2 from tilapia fish farm area via a fan and duct), (4) 4,000 GPM water pump, (5) vertical nitrifying sand biofilter (9 ft. diam x 15 ft. deep, filled with 8 ft of settled sand). From the biofilter 90% of water returns to fish tank and 10% of water goes to basil crops), (6) 30,000 ft2 hydroponic basil crops area ( water returns back to clarifier to remove leaves and roots. Spatially the hydroponics area is on a deck directly over the top of the fish tank and filter area.
The bacterial isolates were derived from various locations of this tilapia fish farm and identified on the basis of a number of biochemical tests derived mainly from the identification scheme of Shewan et al. (1960a,b). In addition, the isolates of Vibrio obtained from tilapia fish tank water on March 5, 2003 were characterized with respect to RAPD analysis.
Materials and Methods
Sources of bacterial isolates
All samples for bacterial analysis were obtained and processed in 2003. Samples of tilapia fish tank water (about 75 ml) derived from 180,000 gallons in a 250,000 gallon tank maintained at 30°C were collected in sterile 100 ml milk dilution bottles. All commercial culture media were Difco. Within 1 hr after collection the samples were decimally diluted in Tryptic Soy Broth (TSB) and 0.1 ml of each dilution surface smeared in triplicate onto Tryptic Soy Agar plates containing a total of 1.0% glucose (TSA+) for determination of total aerobic CFU. Plates were incubated at 32°C for 24 hr. One hundred colonies were picked at random and purified by successive streaking onto TSA plates. Pure isolated colonies were then picked and transferred to TSA slants for incubation and refrigerated storage.
Sand particles suspended in water from the nitrifying tank were collected in a 400 ml sterile beaker, covered with sterile aluminum foil, and then transported to the laboratory. The entire beaker of sand was poured onto sterile filter paper in a sterile Buchner funnel and then washed twice with 100 ml of sterile TSB to remove unattached bacteria using a vacuum filtration system. Wet sand (15.0 g) was then blended with 100 ml of TSB for 1 min to detach bacterial cells from the sand particles. Decimal dilutions were then prepared and plated as above.
Basil roots (50 g) were blended with 250 ml of TSB for 30 sec. Decimal dilutions were prepared with TSB and then cultured for CFU as described above.
Physiological-biochemical Characterization and identification of the isolates
Observation of cell morphology and motility were done under dark phase-contrast microscopy and with motility test agar respectively (Rosen and Levin, 1970). DNase production was determined with the use of DNase test agar and Gram stains were performed with fresh cells on TSA slants incubated for 24 hr at 32°C (Sadovski and Levin, 1969). Cytochrome oxidase, catalase, gelatinase caseinase, and gas production from glucose were performed according to the procedures previously described (Kovacs, 1956; Baumann et al, 1971; Simidu, 1990; Smibert et al 1994).
Acid production from fermentation of glucose was assessed using the medium of Hugh and Leifson (1953) under both aerobic and anaerobic conditions (tubes overlayed with mineral oil). The cultures were examined for turbidity and color changes after 3 days of incubation at 32°C. Sensitivity to the vibriostatic agent O/129 (2,4-diamino-6, 7-diisopropylpteridine, Sigma, cat. no. 1511) was tested on inoculated smear plates of TSA using the disc diffusion method. 50 μl of filter sterilized O/129 (150 mg/50 ml) in deionized water were applied to 14 mm diameter filter paper discs which were than placed onto the center of the plates followed by incubation at 32°C for 24hr.
PCR-RAPD analysis of Vibrio isolates
All of the 69 Vibrio isolates obtained from the tilapia fish tank water on March 5, 2003 were subjected to PCR-RAPD analysis. Each Vibrio isolate was inoculated into a tube (16 x 150 mm) containing 5 ml of TSB and incubated overnight at 32°C with rotary agitation (200 rpm) to the stationary growth phase. 1.5 ml of the broth culture was centrifuged at 12,000 rpm in a microcentrifuge for 5 min and the supernatant discarded. The pellet was washed once first with sterile 0.85% NaCl solution solution (w/v) and then twice with 1 ml of sterile dH2O. The pellet was then suspended and the cell density was subsequently adjusted to an absorbance of 1.6 at 600nm with an appropriate amount of sterile milli-Q H2O (around 250-300 μl). This suspension was used directly as the source of template DNA for PCR-RAPD or kept frozen at -20°C until used.
Three 10-bp oligonucleotide primers (synthesized by Sigma/Genesis, the Woodlands, TX, USA) were used independently with each Vibrio isolate for PCR-RAPD. The primers selected for RAPD typing of the Vibrio isolates had the following sequences respectively: PB4 5’-AAGGATCAGC, PB1 5’-GGAACTGCTA (Mazurier et al. 1992), and HLWL74 5’-ACGTATCTGC (Farber et al. 1994).
For the amplification procedure, each 50.0 μl PCR-RAPD reaction mixture contained the following reagents: 5.0 μl of 10x reaction buffer (containing 15 mM MgCl2) (Qiagen), 33.75 ml of sterile Milli-Q H2O, 2.0 μl of 25 mM MgCl2 (Qiagen), 2.0 μl of a solution containing each of the 4 deoxynucleoside triphosphates (Takara Shuzo, Fisher Scientific, cat. no. TAK4030) at a concentration of 2.5 mM, 2.0 μl of 10 mM primer (Sigma/Genesis), 1.25 U (0.25 μl) of Taq DNA polymerase (Qiagen, Fisher Scientific, cat. no. 201203), and 5 μl of Vibrio cell suspension (A600 = 1.6). Sterile 0.5 ml PCR tubes were used for PCR reactions. The reaction mixtures were cycled through the following temperature profile: one cycle consisting of 94°C for 4 min, 35°C for 2 min and 72°C for 2 min followed by 43 cycles consisting of 94°C for 1 min, 35°C for 2 min and 72°C for 2 min; and a final cycle consisting of 94°C for 1 min, 35°C for 2 min and 72°C for 10 min. All amplifications were performed in a DNA thermocycler (Techgene Ltd., Cambridge, UK).
The PCR-RAPD products (13 ml) were added to agarose wells and electrophoresed by using a Fisher Biotech Electrophoresis Horizontal Gel System FB MSU-1 (Fisher Scientific, Pittsburgh, PA) at 70 V for 1.5 hr on a 1.6% agarose gel (Agarose DNA Grade, Fisher Biotech; Fisher Scientific) with TBE electrophoreses running buffer (89 mM Tris-Base, 89 mM boric acid, 2 mM EDTA, pH8.4). The gels were stained with ethidium bromide solution (1 mg/ml) for 30 min. Electrophoresis banding patterns of PCR-RAPD products were visualized under a UV transilluminator and photographed with a Canon PowerShot G3 digital camera (Japan) with orange filter. A DNA marker ranging from 50-bp to 2000-bp (Sigma, cat. no. P9577) was included on each gel as a molecular weight standard. PCRRAPD was performed at least twice for each Vibrio isolate to confirm reproducibility of the results. The numerical index of the discriminatory ability of the RAPD typing method was calculated according to the equation described previously by Hunter (1988).
Computer analysis of RAPD profiles for Vibrio isolates
All of the PCR-RAPD gel photographs were downloaded directly from the digital camera to a Macintosh iMac computer with Canon Utilities ImageBrowser program (version 2.7). The images were processed after calibration and adjustment of the background with Photoshop Elements 2.0. The presence or absence of bands on the gel photographs for each RAPD profile was transcribed and recorded into computer-readable binary scores (1 and 0 respectively). The levels of similarities between RAPD profiles were calculated by using the Phylip phylogeny inference package (Version 3.6b; Joseph Felsenstein, Department of Genome Sciences University of Washington, Seattle, USA). Data were clustered with the unweighted pair group method using the arithmetic averaging (UPGMA) algorithm (Neighbor-Joining/UPGMA method version 3.6a3).
Results and Discussion
Viable aerobic counts
The viable aerobic counts of bacteria in the tilapia fish tank water were determined on March 5, July 9, September 9, and October 8 respectively from the same fish tank. The viable counts of aerobic bacteria in the water of the fish tank increased with time from 2.0 x 10⁴ to 8.9 x 10⁴ over the course of 7 months (Table 1). This was presumably due to the increase in fish size and daily fecal mass over this time period. The sand particles in the nitrifying tank yielded a notably higher bacterial count compared to the water in the sand tank by 3 orders of magnitude (Table 1). This is most likely due to the biofilm formed as a coating around the surface of the sand particles. The viable aerobic count on the basil roots was also higher (Table 1) by 2 orders of magnitude compared to the fish tank water, most likely reflecting an enhanced nutritional environment afforded by the root surface and resulting colonization.
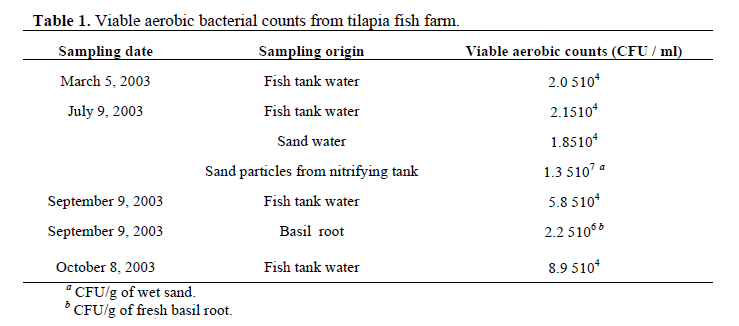
Table 1. Viable aerobic bacterial counts from tilapia fish farm.
Predominant genera of the aerobic microflora of the tilapia farm
The predominant bacterial genera present at different locations of the tilapia fish farm are shown in Table 2. Vibrio, Aeromonas, Pseudomonas, and Shewanella were identified as the predominant genera in the samples tested with some isolates designated unknown. These results are similar to those of Sakata et al. (1984) who found that Vibrio, Aeromonas, and Pseudomonas were the dominant flora in the intestine of tilapia reared in fresh water. The percentage of Vibrio in the fish tank water was higher on March 5 and October 8 than that of Aeromonas, Pseudomonas, and Shewanella. The sand particles from the nitrifying tank, however, yielded a predominance of Pseudomonas (60.9%) with only 15.6% Vibrio, 5.2% Aeromonas, 0.9% Shewanella and 17.4% unknown. The basil roots were found to harbor 29% Aeromonas, 19.6% Vibrio, 17.8% Pseudomonas and 0% Shewanella.
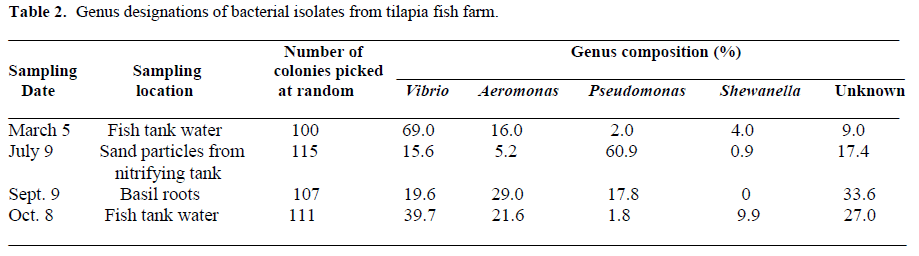
Table 2. Genus designations of bacterial isolates from tilapia fish farm.
Metabolic reactions of 100 isolates from March 5, 2003
The metabolic results for the 100 randomly picked isolates from March 5 are given in Table 3. All 100 isolates were Gram-negative. Most of the isolates were motile, DNase positive, catalase positive, and cytochrome oxidase positive. Sensitivity to O/129, acid production in the Hugh-Leifson sealed tubes, and glucose fermentative without gas production were used as the major criteria for identification of vibrios. Isolates that were resistant to O/129, produced acid in the Hugh-Leifson sealed tubes, and fermented glucose with gas production were designated aeromonads. Obligately aerobic organisms resistant to O/129, and that attacked glucose without gas production were designated pseudomonads. Very few of the Vibrio isolates were found to hydrolyze casein or gelatin. However, more than half of the Aeromonas and Pseudomonas isolates hydrolyzed casein and gelatin, as did all of the Shewanella isolates. Identification of Shewanella isolates was based on production of salmon pigment, cytochrome oxidase, protease, DNase, and H2S.
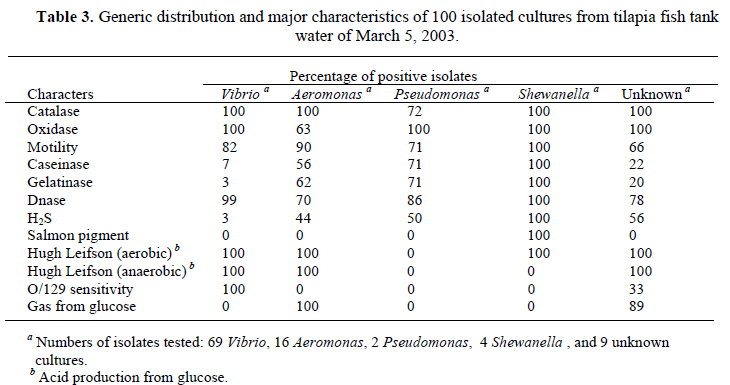
Table 3. Generic distribution and major characteristics of 100 isolated cultures from tilapia fish tank water of March 5, 2003.
RAPD analysis for Vibrio isolates
All of the 69 Vibrio isolates obtained from the tilapia fish tank water on March 5 were subjected to PCR-RAPD analysis with thethree primers PB4, PB1, and HLWL74 independently. The PCR-RAPD assays were repeated at least twice for all 69 Vibrio isolates and the RAPD profiles were found to be highly reproducible. Diagrams of the RAPD banding profiles obtained with each of the three primers are given in Figure 2A, B, and C. The RAPD profiles obtained were considered to be different when there was a difference of one or more bands between each isolate. Most banding patterns included 3-8 distinct bands with primer PB4 (Figure. 2A), 2-5 distinct bands with primer PB1 (Figure. 2B), and 3-7 distinct bands with primer HLWL74 (Figure. 2C). Most of the 69 Vibrio isolates had a band of about 1000-bp with primer PB4 (Figure. 2a). Primer PB4 resulted in 32 RAPD profiles derived from the 69 Vibrio isolates, with profile 32 failing to exhibit any bands (Figure. 2A). Primer PB1 yielded 40 banding profiles derived from all 69 Vibrio isolates (Figure. 2B) with profile 11 failing to exhibit any bands, and primer HLWL74 yielded 38 profiles (Figure. 2C) with profile 2 failing to yield any bands.
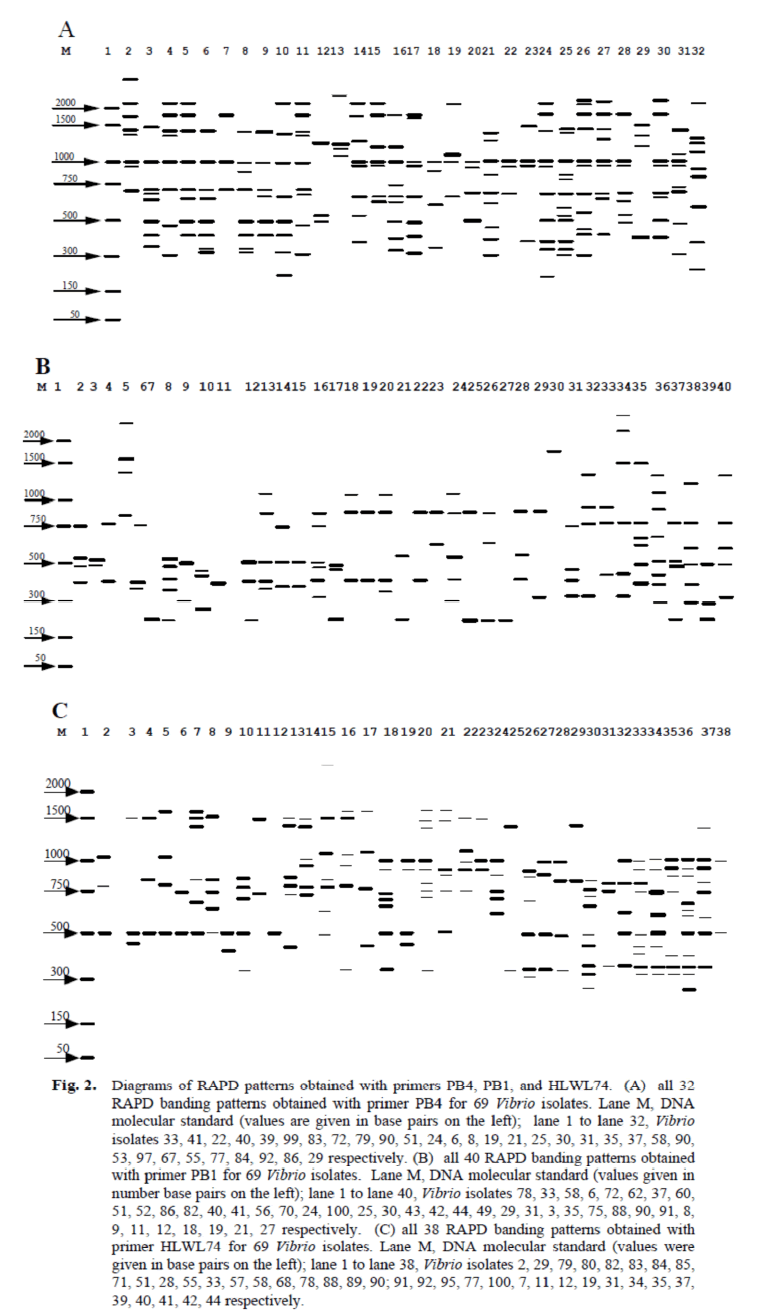
Figure 2. Diagrams of RAPD patterns obtained with primers PB4, PB1, and HLWL74. (A) all 32 RAPD banding patterns obtained with primer PB4 for 69 Vibrio isolates. Lane M, DNA molecular standard (values are given in base pairs on the left); lane 1 to lane 32, Vibrio isolates 33, 41, 22, 40, 39, 99, 83, 72, 79, 90, 51, 24, 6, 8, 19, 21, 25, 30, 31, 35, 37, 58, 90, 53, 97, 67, 55, 77, 84, 92, 86, 29 respectively. (B) all 40 RAPD banding patterns obtained with primer PB1 for 69 Vibrio isolates. Lane M, DNA molecular standard (values given in number base pairs on the left); lane 1 to lane 40, Vibrio isolates 78, 33, 58, 6, 72, 62, 37, 60, 51, 52, 86, 82, 40, 41, 56, 70, 24, 100, 25, 30, 43, 42, 44, 49, 29, 31, 3, 35, 75, 88, 90, 91, 8, 9, 11, 12, 18, 19, 21, 27 respectively. (C) all 38 RAPD banding patterns obtained with primer HLWL74 for 69 Vibrio isolates. Lane M, DNA molecular standard (values were given in base pairs on the left); lane 1 to lane 38, Vibrio isolates 2, 29, 79, 80, 82, 83, 84, 85, 71, 51, 28, 55, 33, 57, 58, 68, 78, 88, 89, 90; 91, 92, 95, 77, 100, 7, 11, 12, 19, 31, 34, 35, 37, 39, 40, 41, 42, 44 respectively.
Each RAPD type profile was assigned an arbitrary number (Figure. 2A, B, and C, Table 4). From the 69 Vibrio isolates examined the resulting 32, 40, and 38 RAPD profiles obtained with primers PB4, PB1, and HLWL74 respectively yielded 67 different composite profiles (Table 4).
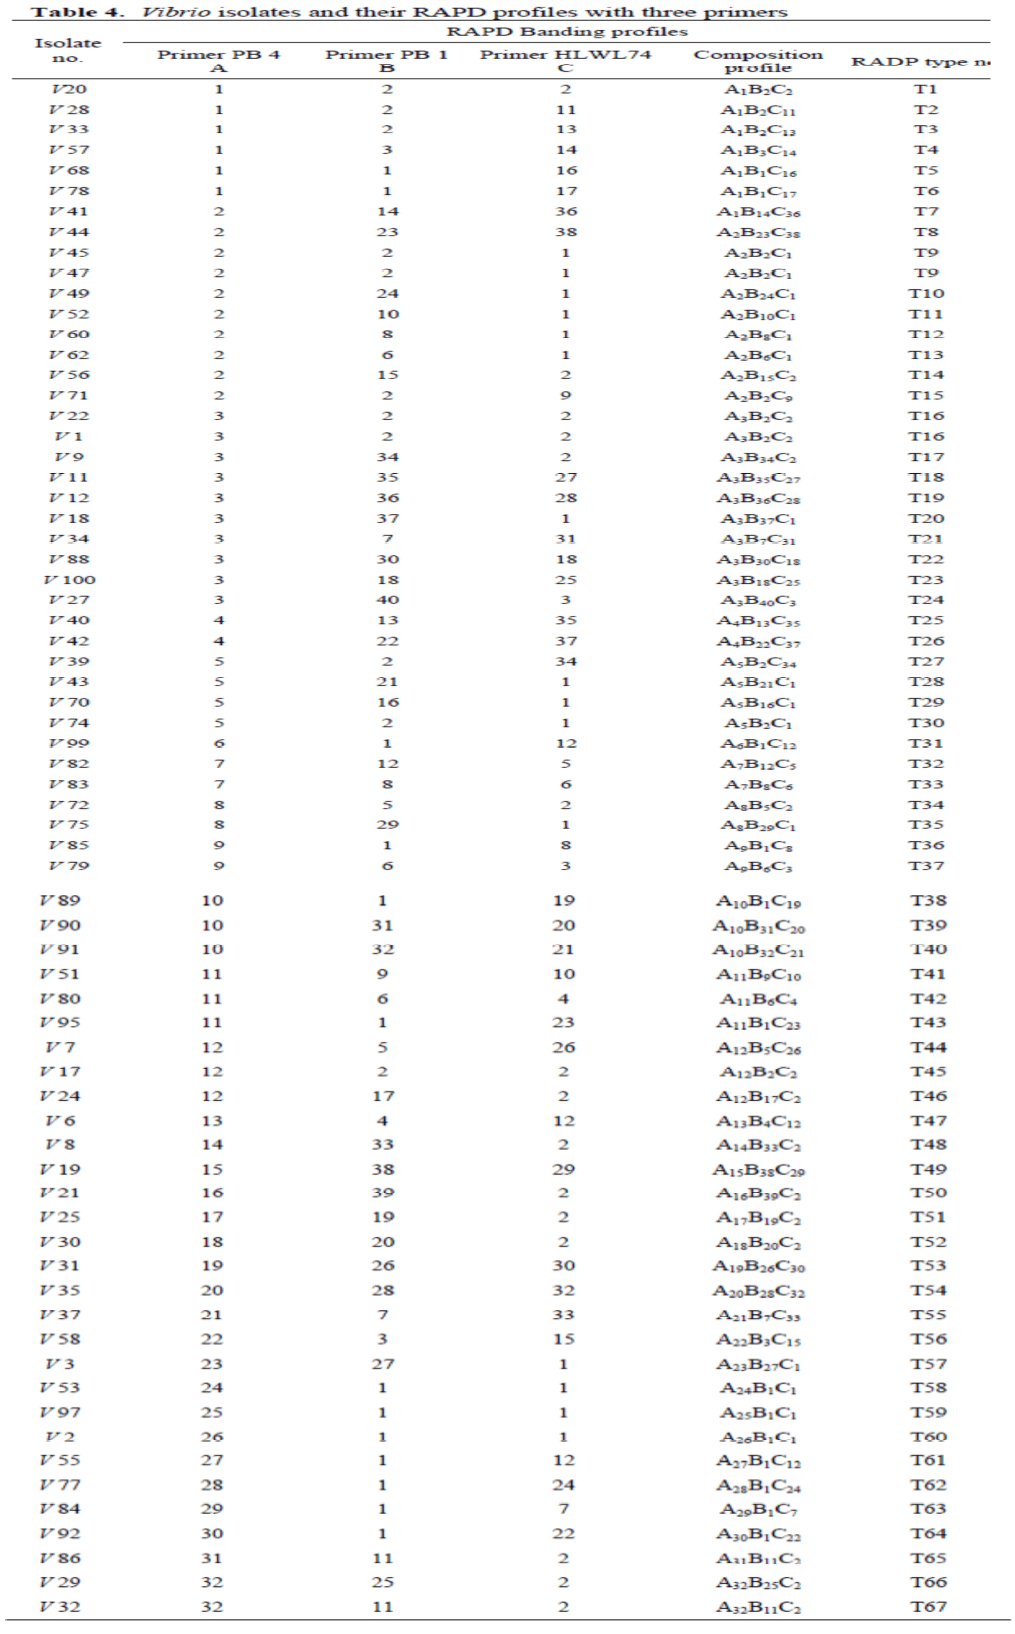
Table 4. Vibrio isolates and their RAPD profiles with three primers
The results of cluster analysis presented in a dendrogram based on the RAPD profiles are shown in Figure 3. Nine clusters were defined at the 25% similarity level (data of similarity between Vibrio isolates are not given), with each cluster containing between two and twenty-one Vibrio isolates. Four Vibrio isolates (V32, V86, V21 and V58) were not included in any cluster. Among the 67 composite RAPD profiles for the 69 Vibrio isolates, four Vibrio isolates were separated into two composite RAPD profiles containing two isolates each (isolates V22/V1, composite profile T16; isolates V45/V47, composite profile T09) (Table 4, Figure. 3). The remaining 65 Vibrio isolates yielded unique RAPD types respectively. This observation indicates that most of the Vibrio isolates was genetically quite heterogeneous. The highest level of similarity among distinct isolates occurred between RAPD types T09 and T30 and was 92.31% (Figure. 3). One Vibrio isolate (V32) remained completely ungrouped.
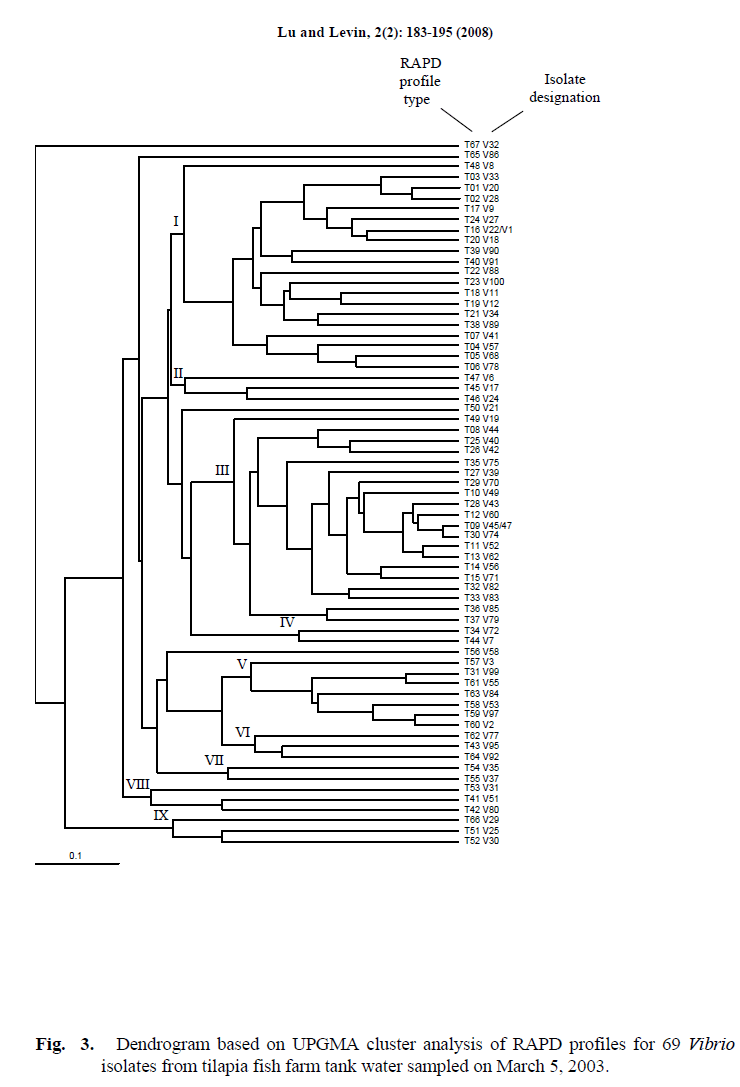
Figure 3. Dendrogram based on UPGMA cluster analysis of RAPD profiles for 69 Vibrio isolates from tilapia fish farm tank water sampled on March 5, 2003.
Each of the 3 primers failed to yield even one DNA band with several of the isolates. However, at least one of the other 2 primers did yield banding profiles with all but one such isolate. Primer PB4 failed to yield DNA bands of Vibrio isolates V29 and V32 and they were allocated to type 32 with primer PB4 (Figure. 2A). Primer PB1 failed to yield bands with isolates V86 and V32 and they were allocated to type 11 with primer PB1 Figure. 2B). Primer HLWL74 failed to yield bands with isolates V1, V8, V9, V17, V20, V21, V22, V24, V25, V29, V30, V56, V72, V86, V32 and they were allocated to type 2 with primer HLWL74 (Figure. 2C). All 3 primers failed to yield even one band with isolate V32 accounting for the inability to group this isolate.
The numerical index of the discriminatory ability of the RAPD typing method with primers PB4, PB1, and HLWL74 for the 69 Vibrio isolates was 94.67%, 94.03%, 90.88% respectively and 99.91% with the three primers combined (Hunter and Gaston, 1988).
Conclusions
The major bacterial genera predominating in the fish tank water of an inland tilapia farm were found to be Vibrio, Aeromonas, Peudomonas, and Shewanella in decreasing order of percent occurrence. PCR-RAPD analysis of 69 Vibrio isolates from the same water sample utilizing three random primers indicated that most of the Vibrio isolates were genetically heterogeneous, with no particular clonal type predominating.
Acknowledgments
This study was supported by a Special U.S.D.A. grant on Seafood Safety #200- 34423-13151. It is paper no. #3354. from the Massachusetts Agricultural Experiment Station, University of Massachusetts, Amherst, MA, 01003, U.S.A. The authors wish to thank John Reed, owner of the Bioshelters tilapia farm in Amherst, Massachusetts, for allowing us access for sampling and for informative discussions.
1640
References
- Baumann, P., Baumann, L. and Mandel, M. (1971). Taxonomy of marine bacteria: the genus Beneckea, Journal of Bacterioogy, 107: 268-294.
- Farber, J.M. and Addison, C.J. (1994). RAPD typing for distinguishing species and strains in the genus Listeria, Journal of Applied Bacteriology, 77: 242-250.
- Hugh, R. and Leifson, E. (1953). The taxonomic significance of fermentative versus oxidative metabolism of carbohydrates by various Gram negative bacteria, Journal of Bacteriology, 66: 24-26.
- Hunter, P. R. and Gaston, M. A. (1988) Numerical index of the discriminatory ability of typing systems: an application of Simpson’s index of diversity, Journal of Clinical Microbiology, 26: 2465-2466.
- Kovacs, N. (1956). Identification of Pseudomonas pyocyanaeby the oxidase reaction, Nature, 178: 703.
- Mazurier, S. and Wernars, K. (1992). Typing of Listeria strains by random amplification of polymorphic DNA (RAPD) analysis, Journal of Medical Microbiology, 38: 322- 327.
- Rosen, A. and Levin, R.E. (1970). Vibriosfrom fish pen slime which mimic Escherichia coli on violet red bile agar. Applied Microbiology, 20: 107-112.
- Sadovski, A.Y. and Levin, R.E. (1969). Extracellular nuclease activity of fishspoilage bacteria, fish pathogens, and related species. Applied Microbiology, 17: 787-789.
- Sakata, T., Uno, K. and Kakimoto, D. (1984). Dominant bacteria of the aerobicmicroflora in tilapia intestine, Bulettin of the Japan Society of Scientific Fisheries, 50: 489-493.
- Shewan, J.M., Hobbs, G. and Hodgkiss, W. (1960a). A determinative scheme for the identification of certain genera of Gramnegativebacteria, with special reference to the Pseudomonadaceae. Journal of Applied Bacteriology, 23: 379-390.
- Shewan, J.M., Hobbs, G. and Hodgkiss, W. (1960b). The Pseudomonas and Achromobactergroups of bacteria in the spoilage of marine white fish, Journal of Applied Bacteriology, 23: 463-468.
- Simidu, U., Kita-Tsukamoto, K., Yasumoto, T. and Yotsu, M. (1990). Taxonomy of four marine bacterial strains that producetetrodotoxin, International Journal of Systematic Bacteriology, 40: 331-336.
- Smibert, R.M. and Krieg, N.R. (1994). Systematics: phenotypic characterization. In Manual of Methods for General and Molecular Bacteriology, pp. 607-654. Edited by P. Gerhardt. Washington, DC: American Society for Microbiology.
- Trust, T.J., Macinnes, J.I. and Bartlett, K.H. (1978). Microbial Ecology, ed. by Loutit, M.W. and Mile, J.A. pp. 250-254. Spring- Verlag, Berlin.
- Yoshimizu, M., Kamiyama, K., Kimura, T. and Sakai, M. (1976). Studies on the intestinal microflora of salmonids-IV. The intestinal microflora of fresh water salmon, Bulettin of the Japan Society of Scientific Fisheries, 42: 1281-1280.
- on the intestinal microflora of salmonids, Fish Pathology, 10: 243-259.


