Keywords
Natural additives; Essential oil; Black seed; Grape seed jojoba; Chitosan; Common carp; Frozen storage
Introduction
The Essential Oils (EOs) are extracted from plants and are attracting interest as natural additives due to antimicrobial and antioxidant properties [1]. Moreover, EOs are approved by the Food and Drug Administration and “generally recognized as safe” [2]
Cultivated fish has poly unsaturated fatty acids, easily digestible proteins, vitamins, and various other nutrients like other types of fish, thus, it is gaining increasing importance in terms of healthy food 3].
Freezing has been considered the most popular method of conservation and successfully employed to retain the quality of food products, especially fish and other seafood, over long storage periods [4,5]. Freezing minimizes microbial and enzymatic activity and hence preserves the flavor and the nutritional properties [6]
In the fish technology industry too, replacement of synthetic additives by natural additive is being widely encouraged by researchers and processors [7].
Thus, the objective of this study aimed to evaluated the effects of natural additives (essential oil and chitosan) on the chemical composition and physicochemical quality during frozen storage at -18°C for 180 days.
Material and Methods
Fish samples
Approximately 15 kg of fresh common carp (Cyprinus carpio) was from fish farms at Fuwaa, Kafr El-Sheikh Governorate, Egypt during winter, 2017. Fresh fish samples were carefully washed with potable water, then packed in ice boxes and transported to Laboratory.
The average of total lengths and weight (Mean ± SD) of common carp fish were 55.10 ± 2.53 cm and 4034.39 ± 233.54 g in the former. Fish samples were re-washed thoroughly with potable water, beheaded, gutted, filleted
and rewashed carefully and drained (Figures 1 and 2).
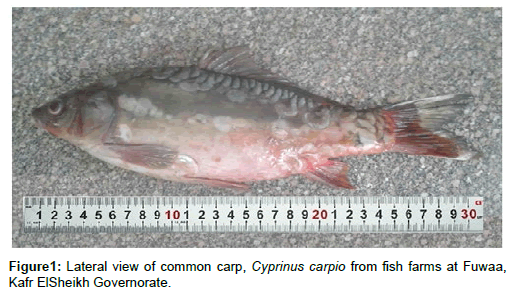
Figure 1:Lateral view of common carp, Cyprinus carpio from fish farms at Fuwaa, Kafr ElSheikh Governorate.
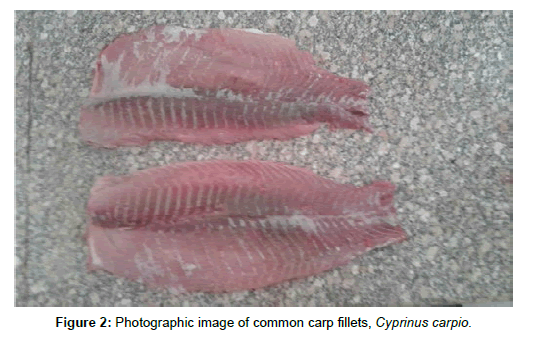
Figure 2:Photographic image of common carp fillets, Cyprinus carpio.
Natural additives
Chitosan was extracted from shrimp shells. However, essential oils; black seed (Nigella sativa), grape seed (Vitis vinifera) and jojoba (Simmondsia chinensis), oils were purchased from Harraz Company for food industries and natural products, Cairo, Nasr City, Egypt.
Frozen fish processing
Common carp fillets were weighted and divided into equal five groups which were dipped for 10 min. at ambient temperature (23 ± 2°C); (1) in the distilled water (control) (2) in 1.0% of black seed oil solution, (3) in 1.0% of grape seed oil solution, (4) in 1.0% of jojoba oil solution and (5) in 1.0% chitosan solution. Treated fillet groups were drained on sterilized stainless-steel grill for 2 min. Drained fillets groups were packaged in air tight polyethylene bags and kept in a freezing at -18 ± 1°C for 180 days and chemical composition and physico-chemical analysis were carried out immediately after preparation (zero time) 30, 60, 90, 120, 150 and 180 days of storage.
Analytical methods
Chemical composition (Moisture, crude fat, ash, carbohydrates and calorific value) were determined according to the methods described by [8] pH value was measured using pH-meter (Type JENWAY 3510) according to the method described by [9]. Total Volatile Bases Nitrogen (TVB-N) was described by using [10]. Thiobarbituric Acid (TBA) value was determined by the distillation method [11].
Statistical analysis
Results were expressed in tables as mean ± SD. Data were analyzed by using Microsoft Excel 2010 and SPSS 20, Statistical Software. It was subjected to Analysis of Variance (ANOVA).
Results
Chemical composition of the frozen fishes
Moisture content: Results revealed that, the initial values of moisture content in the common carp fillets showed no negligible alternation in all samples treated with natural additives, compared with the control ones after processing during zero time. During frozen storage at -18 ± 1°C, however, the moisture of control samples decreased rapidly and reached the value of 68.46 ± 0.54% compared with 69.86 ± 0.55, 70.37 ± 0.73, 69.56 ± 0.82 and 69.78 ± 0.62%, respectively of samples treated with black seed, chitosan, grape seed and Jojoba oils after 180 days of storage. At the end of storage period (180 days), however, the lowest loss rate (5.39%) of moisture content was recorded in fish fillets treated with Black seed oil and the highest loss rate (6.16%) was detected in the samples treated with Jojoba oil; it was lower than the control ones (7.45%). Generally, the moisture content in the common carp fillets decreased with the increasing storage periods (Table 1 and Figure 3).
| Storage periods |
0 day |
30 days |
60 days |
90 days |
120 days |
150 days |
180 days |
Loss rate |
| Treatments |
| Control |
75.91 ± 0.72 |
72.69 ± 0.60 |
71.47 ± 0.64 |
70.63 ± 0.69 |
69.15 ± 0.65 |
68.74 ± 0.85 |
68.46 ± 0.54 |
7.45 |
| Black seed oil |
75.25 ± 0.64 |
74.75 ±0.82 |
73.25 ± 0.67 |
71.86 ± 0.58 |
71.1 ± 0.67 |
70.03 ± 0.75 |
69.86 ± 0.55 |
5.39 |
| Grape seed oil |
75.61 ± 0.80 |
73.55 ±0.55 |
72.55 ± 0.75 |
71.56 ± 0.86 |
70.45 ± 0.97 |
70.08 ± 0.65 |
69.56 ± 0.82 |
6.05 |
| Jojoba oil |
75.94 ± 0.92 |
73.8 ±0.56 |
73.49 ± 0.67 |
72.18 ± 0.98 |
70.32 ± 0.88 |
70.16 ± 0.84 |
69.78 ± 0.62 |
6.16 |
| Chitosan |
75.9 ± 0.98 |
74.53 ±0.78 |
73.87 ± 0.65 |
72.97 ± 0.72 |
71.99 ± 0.54 |
71.59 ± 0.85 |
70.37 ± 0.73 |
5.53 |
Table 1: Changes of moisture content (%, on wet weight basis) in the common carp, C. carpio, fillets treated with natural additives during frozen storage at -18 ± 1Ë?C up to 180 days.
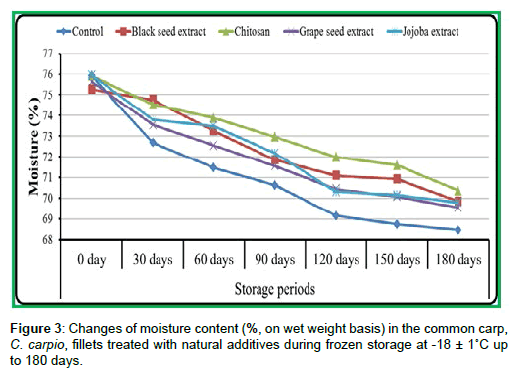
Figure 3: Changes of moisture content (%, on wet weight basis) in the common carp, C. carpio, fillets treated with natural additives during frozen storage at -18 ± 1Ë?C upto 180 days.
Crude protein: Table 2 and Figure 4 revealed that, the initial values of crude protein in the common carp fillets showed no alternations negligible in all samples treated with natural additives, compared with the control ones after processing during zero time. During frozen storage at -18 ± 1°C, however, the crude protein of control samples decreased rapidly and reached the value of 16.01 ± 0.76% compared with 16.87 ± 0.92, 16.95 ± 0.89, 16.58 ± 0.78 and 16.48 ± 0.76%, respectively of samples treated with black seed, chitosan, grape seed and Jojoba oils after 180 days of storage. At the end of storage period (180 days), however, the lowest loss rate (0.77%) of crude protein was recorded in the fish fillets treated with chitosan and the highest loss rate (1.34%) was observed in the samples treated with Jojoba oil; it was lower than the control ones (1.75%). Generally, the crude protein in the common carp fillets decreased with the increasing storage periods.
Storage
periods |
0 day |
30 days |
60 days |
90 days |
120 days |
150 days |
180 days |
Loss rate |
| Treatments |
| Control |
17.76 ± 0.63 |
17.69 ± 0.75 |
17.42 ± 0.73 |
17.04 ± 0.94 |
16.57 ± 0.59 |
16.45 ± 0.67 |
16.01 ± 0.76 |
1.75 |
| Black seed oil |
17.99 ± 0.66 |
17.86 ± 0.59 |
17.61 ± 0.92 |
17.39 ± 0.52 |
17.29 ± 0.90 |
16.94 ± 0.69 |
16.87 ± 0.92 |
1.12 |
| Grape seed oil |
17.79 ± 0.59 |
17.68 ± 0.61 |
17.56 ± 0.66 |
17.4 ± 0.66 |
17.23 ± 0.73 |
16.98 ± 0.55 |
16.58 ± 0.78 |
1.21 |
| Jojoba oil |
17.82 ± 0.71 |
17.64 ± 0.83 |
17.45 ± 0.53 |
17.28 ± 0.53 |
17.03 ± 0.83 |
16.75 ± 0.87 |
16.48 ± 0.76 |
1.34 |
| Chitosan |
17.72 ± 0.65 |
17.63 ± 0.91 |
17.55 ± 0.84 |
17.5 ± 0.63 |
17.45 ± 0.66 |
17.2 ± 0.78 |
16.95 ± 0.89 |
0.77 |
Table 2: Changes of crude protein (%, on wet weight basis) in the common carp, C. carpio, fillets treated with natural additives during frozen storage at -18 ± 1Ë?C up to 180 days.
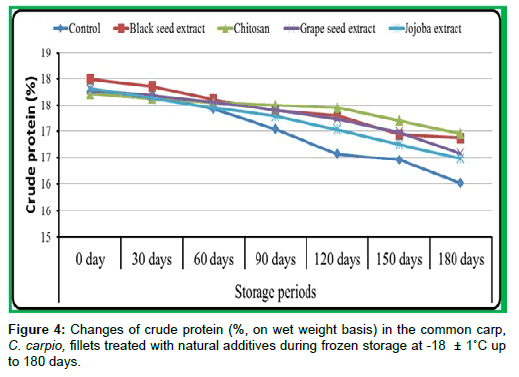
Figure 4:Changes of crude protein (%, on wet weight basis) in the common carp, C. carpio, fillets treated with natural additives during frozen storage at -18 ± 1Ë?C upto 180 days.
Crude fat: The initial values of crude fat in the common carp fillets were slightly increased in all samples treated with natural additives, compared with the control ones after processing during zero time. During frozen storage at -18 ± 1°C, however, the crude fat of control samples increased rapidly and reached the value of 7.29 ± 0.06% compared with 4.00 ± 0.08, 4.75 ± 0.07, 5.00 ± 0.09 and 5.32 ± 0.08%, respectively of samples treated with black seed, chitosan, grape seed and Jojoba oils after 180 days of storage. At the end of storage period (180 days), however, the lowest increase (0.99%) of crude fat was recorded in fish fillets treated with Black seed oil and the highest increase (2.27%) was recorded in the samples treated with Jojoba oil; it was lower than the control ones (4.46%). Generally, crude fat in the common carp fillets increased with the increasing storage periods and increased in all samples treated with natural additives, compared with the control ones, during the different storage periods (Table 3 and Figure 5).
| Storage periods |
0 day |
30 days |
60 days |
90 days |
120 days |
150 days |
180 days |
Increase rate |
| Treatments |
| Control |
2.83 ± 0.05 |
4.01 ± 0.06 |
4.36 ± 0.07 |
4.93 ± 0.08 |
5.19 ± 0.06 |
5.93 ± 0.09 |
7.29 ± 0.06 |
4.46 |
| Black seed oil |
3.01 ± 0.08 |
3.31 ± 0.07 |
3.44 ± 0.05 |
3.5 ± 0.06 |
3.8 ± 0.09 |
3.7 ± 0.07 |
4 ± 0.08 |
0.99 |
| Grape seed oil |
3.04 ± 0.09 |
3.63 ± 0.07 |
3.77 ± 0.09 |
3.91 ± 0.05 |
4.17 ± 0.07 |
4.61 ± 0.08 |
5 ± 0.09 |
1.96 |
| Jojoba oil |
3.05 ± 0.10 |
3.89 ± 0.08 |
3.99 ± 0.05 |
4.09± 0.06 |
4.35 ± 0.09 |
4.79 ± 0.05 |
5.32 ± 0.08 |
2.27 |
| Chitosan |
2.85 ± 0.06 |
3.31 ± 0.09 |
3.57± 0.08 |
3.69± 0.09 |
4 ± 0.06 |
4.25 ± 0.05 |
4.75 ± 0.07 |
1.9 |
Table 3: Changes of crude fat (%, on wet weight basis) in the common carp, C. carpio, fillets treated with natural additives during frozen storage at -18 ± 1Ë?C up to 180 days.
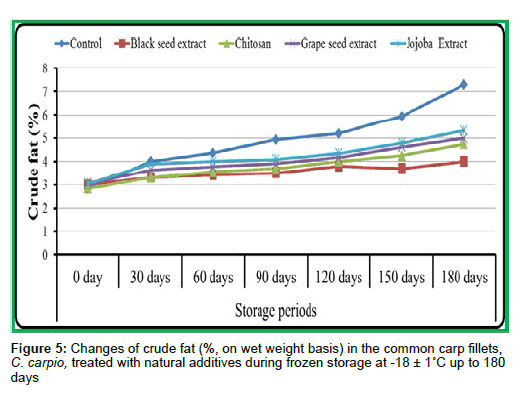
Figure 5:Changes of crude fat (%, on wet weight basis) in the common carp fillets, C. carpio, treated with natural additives during frozen storage at -18 ± 1Ë?C up to 180 days
Ash content: Table 4 and Figure 6 showed the changes of ash content in the common carp fillets treated with antioxidant (black seed, chitosan, grape seed and Jojoba oils) during frozen storage at -20 ± 1Ë?C up to 180 days. Results revealed that, at the beginning of storage period, there were slightly increase in ash content of all samples treated with natural additives, compared with the control ones after processing during zero time. During frozen storage at -18 ± 1Ë?C, however, ash content of control samples decreased rapidly and reached the value of 0.85 ± 0.04% compared with 1.80 ± 0.03, 1.67 ± 0.02, 1.67 ± 0.04 and 1.43 ± 0.03%, respectively of samples treated with black seed, chitosan, grape seed and Jojoba oils after 180 days of storage. At the end of storage period (180 days), however, the lowest loss rate (0.27%) of ash content was recorded in fish fillets treated with Black seed oil and the highest loss rate (0.61 %) was detected in the samples treated with Jojoba oil. It was lower than the control ones (1.14%). Generally, ash content in the common carp fillets decreased with the increasing storage periods and increased in all samples treated with natural additives, compared with the control ones during storage periods.
Storage
periods Treatments |
0 day |
30 days |
60 days |
90 days |
120 days |
150 days |
180 days |
Loss rate |
| Control |
1.99 ± 0.02 |
1.81 ± 0.03 |
1.62 ± 0.02 |
1.45 ± 0.04 |
1.23 ± 0.03 |
1.04 ± 0.02 |
0.85 ± 0.04 |
1.14 |
| Black seed oil |
2.07 ± 0.02 |
1.98 ± 0.04 |
1.93 ± 0.03 |
1.9 ± 0.04 |
1.88 ± 0.02 |
1.83 ± 0.01 |
1.8 ± 0.03 |
0.27 |
| Grape seed oil |
2.06 ± 0.03 |
1.87 ± 0.04 |
1.83 ± 0.01 |
1.79 ± 0.02 |
1.74 ± 0.03 |
1.7 ± 0.02 |
1.67 ± 0.04 |
0.39 |
| Jojoba oil |
2.04 ± 0.03 |
1.85 ± 0.04 |
1.73 ± 0.02 |
1.65 ± 0.03 |
1.57 ± 0.04 |
1.5 ± 0.01 |
1.43 ± 0.03 |
0.61 |
| Chitosan |
2.02 ± 0.04 |
1.93 ± 0.02 |
1.83 ± 0.04 |
1.79 ± 0.03 |
1.74 ± 0.01 |
1.7 ± 0.03 |
1.67 ± 0.02 |
0.35 |
Table 4: Changes of ash content (%, on wet weight basis) in the common carp, C. carpio, fillets treated with natural additives during frozen storage at -18 ± 1Ë?C up to 180 days.
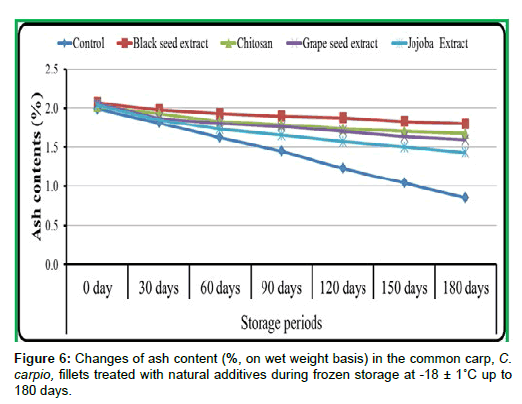
Figure 6:Changes of ash content (%, on wet weight basis) in the common carp, C. carpio, fillets treated with natural additives during frozen storage at -18 ± 1Ë?C up to 180 days.
Carbohydrate contents: Results (Table 5 and Figure 7) revealed that, the initial values of carbohydrate contents in the common carp fillets after processing during zero time showed no alternations negligible in all samples treated with natural additives, compared with the control ones. During frozen storage at -18 ± 1°C, however, the carbohydrate contents of control samples increased rapidly and reached the value of 7.39 ± 0.04% compared with 7.47 ± 0.01, 6.26 ± 0.04 7.27 ± 0.01 and 6.99 ± 0.03%, respectively of samples treated with black seed, chitosan, grape seed and Jojoba oils after 180 days of storage. At the end of storage period (180 days), however, the lowest increase (4.75%) of carbohydrate contents was recorded in fish fillets treated with chitosan and the highest increase (5.84%) was recorded in the samples treated with Jojoba oil. It was lower in black seed than the control ones (5.88%). Generally, carbohydrate contents in the common carp fillets increased with the increasing storage periods and decreased in all samples treated with natural additives, compared with the control ones during storage periods, except jojoba.
| Storage periods |
0 day |
30 days |
60 days |
90 days |
120 days |
150 days |
180 days |
Increase rate |
| Treatments |
| Control |
1.51 ± 0.01 |
3.81 ± 0.04 |
5.13 ± 0.03 |
5.95 ± 0.01 |
7.86 ± 0.04 |
7.84 ± 0.03 |
7.39 ± 0.04 |
5.88 |
| Black seed oil |
1.68 ± 0.03 |
2.1 ± 0.02 |
3.77 ± 0.01 |
5.35 ± 0.04 |
5.93 ± 0.02 |
6.6 ± 0.01 |
7.47 ± 0.01 |
5.79 |
| Grape seed oil |
1.5 ± 0.01 |
3.27 ± 0.01 |
4.32 ± 0.03 |
5.37 ± 0.04 |
6.45 ± 0.01 |
6.7 ± 0.03 |
7.27 ± 0.01 |
5.77 |
| Jojoba oil |
1.15 ± 0.02 |
2.82 ± 0.04 |
3.34 ± 0.01 |
4.8 ± 0.03 |
6.73 ± 0.04 |
6.8 ± 0.03 |
6.99 ± 0.03 |
5.84 |
| Chitosan |
1.51 ± 0.04 |
2.6 ± 0.03 |
3.18 ± 0.04 |
4.05 ± 0.01 |
4.82 ± 0.03 |
5.26 ± 0.04 |
6.26 ± 0.04 |
4.75 |
Table 5: Changes of carbohydrate contents (%, on wet weight basis) in the common carp, C. carpio, fillets treated with natural additives during frozen storage at -18 ± 1Ë?C up to 180 days.
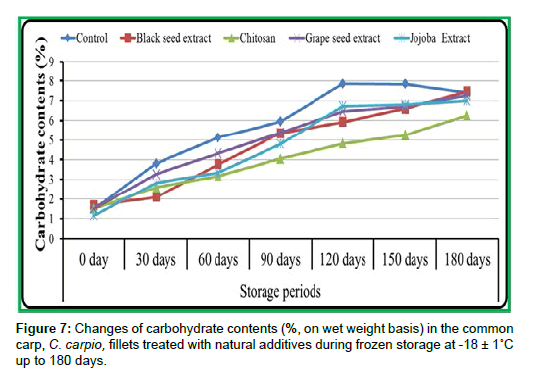
Figure 7:Changes of carbohydrate contents (%, on wet weight basis) in the common carp, C. carpio, fillets treated with natural additives during frozen storage at -18 ± 1Ë?C up to 180 days.
Calorific values: The initial values of calories in the common carp fillets after processing during zero time showed no alternations negligible in all samples treated with natural additives than in the control ones. During frozen storage at -18 ± 1°C, however, the total calories of control samples increased rapidly and reached the value of 159.21 ± 1.45 Kcal./100 g compared with 133.36 ± 1.90, 135.59 ± 1.79, 140.40 ± 1.67 and 141.76 ± 1.84 K cal/100 g, respectively of samples treated with black seed, chitosan, grape seed and Jojoba oils after 180 days of storage. At the end of storage period (180 days), however, the lowest increase (27.59 K cal/100 g) of total calories was recorded in fish fillets treated with black seed and the highest increase (38.43 K cal/100 g) was recorded in the samples treated with Jojoba oil. They were lower than the control ones (56.66 K cal /100 g). Generally, total calories in the common carp fillets increased with the increasing storage periods and decreased in all samples treated with natural additives, compared with the control ones (Table 6 and Figure 8).
Storage
periods |
0 |
30 days |
60 days |
90 days |
120 days |
150 days |
180 days |
Increase rate |
| Treatments |
| Control |
102.55 ± 1.90 |
122.03 ± 1.79 |
129.44 ± 1.67 |
136.33 ± 1.84 |
144.43 ± 1.69 |
150.53 ± 1.58 |
159.21 ± 1.45 |
56.66 |
| Black seed oil |
105.77 ± 1.77 |
109.63 ± 1.69 |
116.48 ± 1.90 |
122.46 ± 1.69 |
127.08 ± 1.79 |
127.46 ± 1.67 |
133.36 ± 1.90 |
27.59 |
| Grape seed oil |
104.52 ± 1.67 |
116.47 ± 1.90 |
121.45 ± 1.69 |
126.27 ± 1.58 |
132.25 ± 1.84 |
136.21 ± 1.90 |
140.4 ± 1.67 |
35.88 |
| Jojoba oil |
103.33 ± 1.55 |
116.85 ± 1.79 |
119.07 ± 1.67 |
125.13 ± 1.90 |
134.19 ± 1.67 |
137.31 ± 1.79 |
141.76 ± 1.84 |
38.43 |
Table 6: Changes of total calories (K cal/100 g) in the common carp, C. carpio, fillets treated with natural additives during frozen storage at -18 ± 1Ë?C up to 180 days.
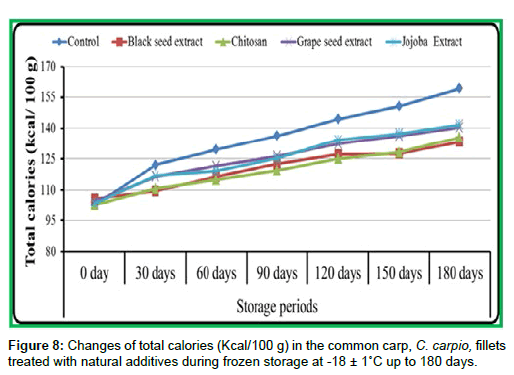
Figure 8: Changes of total calories (Kcal/100 g) in the common carp, C. carpio, fillets treated with natural additives during frozen storage at -18 ± 1Ë?C up to 180 days.
pH values: The initial values of pH values in the common carp fillets after processing during zero time showed no alternations negligible in all samples treated with natural additives, compared with the control ones. During frozen storage at -18 ± 1°C, however, pH values in the control samples increased gradually and reached 6.85 ± 0.06, compared with 6.71 ± 0.07, 6.65 ± 0.05, 6.75 ± 0.05 and 6.79 ± 0.09, respectively of samples treated with black seed, chitosan, grape seed and Jojoba oils after 180 days of storage. At the end of storage period (180 days), however, the lowest increase of pH (0.18) was detected in fish fillets treated with chitosan and the highest increase (0.31) was recorded in the samples treated with Jojoba oil; it was relatively lower than the control ones (0.44). Generally, pH value in the common carp fillets increased with the increasing storage periods and relatively decreased in all samples treated with natural additives, compared with the control ones (Table 7 and Figure 9).
| Storage periods |
0 day |
30 days |
60 days |
90 days |
120 days |
150 days |
180 days |
Increase rate |
| Treatments |
| Control |
6.45 ± 0.03 |
6.55 ± 0.02 |
6.61 ± 0.09 |
6.65 ± 0.01 |
6.7 ± 0.07 |
6.79 ± 0.06 |
6.85 ± 0.06 |
0.4 |
| Black seed oil |
6.45 ± 0.02 |
6.5 ± 0.01 |
6.53 ± 0.09 |
6.55 ± 0.02 |
6.59 ± 0.06 |
6.63 ± 0.09 |
6.71 ± 0.07 |
0.26 |
| Grape seed oil |
6.46 ± 0.05 |
6.55 ± 0.07 |
6.57 ± 0.04 |
6.58 ± 0.08 |
6.63 ± 0.03 |
6.67 ± 0.05 |
6.75 ± 0.05 |
0.29 |
| Jojoba oil |
6.48 ± 0.06 |
6.54 ± 0.03 |
6.57 ± 0.08 |
6.6 ± 0.04 |
6.66 ± 0.02 |
6.74 ± 0.04 |
6.79 ± 0.09 |
0.31 |
| Chitosan |
6.47 ± 0.04 |
6.49 ± 0.09 |
6.5 ± 0.07 |
6.52 ± 0.05 |
6.55 ± 0.09 |
6.6 ± 0.01 |
6.65 ± 0.05 |
0.18 |
Table 7: Changes of pH values in the common carp, C. carpio, fillets treated with natural additives during frozen storage at -18 ± 1Ë?C up to 180 days.
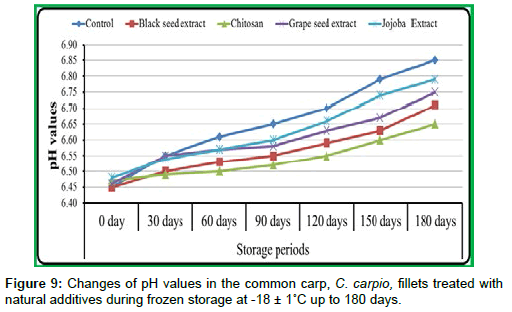
Figure 9: Changes of pH values in the common carp, C. carpio, fillets treated with natural additives during frozen storage at -18 ± 1Ë?C up to 180 days.
Thiobarbituric acid values: Data recorded that, the initial values of thiobarbituric acid in the common carp fillets after processing during zero time showed no alternations negligible in all samples treated with natural additives, compared with the control ones. During frozen storage at -18 ± 1°C, however, the thiobarbituric acid of control samples increased rapidly and reached the value of 8.26 ± 0.002 mg MDA/kg, compared with 3.20 ± 0.002, 3.87 ± 0.004, 4.52 ± 0.005 and 5.59 ± 0.003 mg MDA/kg, respectively of samples treated with black seed, chitosan, grape seed and Jojoba oils after 180 days of storage. At the end of storage period (180 days), however, the lowest increase (2.64 mg MDA/kg) of thiobarbituric acid was recorded in the fish fillets treated with black seed and the highest increase (5.02 mg MDA/kg) was recorded in the samples treated with Jojoba oil; it was lower than the control sample (7.72 mg MDA/kg). Generally, thiobarbituric acid in the common carp fillets increased with the increasing storage periods and decreased in all samples treated with natural additives, compared with the control ones during storage period (Table 8 and Figure 10).
| Storage periods |
0 Day |
30 days |
60 days |
90 days |
120 days |
150 days |
180 days |
Increase rate |
| Treatments |
| Control |
0.54 ± 0.002 |
2.38 ± 0.005 |
3.75 ± 0.003 |
4.54 ± 0.006 |
5.26 ± 0.001 |
6.81 ± 0.003 |
8.26 ± 0.002 |
7.72 |
| Black seed oil |
0.56 ± 0.003 |
1.37 ± 0.005 |
1.96 ± 0.002 |
2.48 ± 0.002 |
2.76 ± 0.001 |
3 ± 0.03 |
3.2 ± 0.002 |
2.64 |
| Grape seed oil |
0.51 ± 0.005 |
1.43 ± 0.005 |
2.32 ± 0.001 |
3.12 ± 0.003 |
3.58 ± 0.008 |
3.9 ± 0.004 |
4.52 ± 0.005 |
4.01 |
| Jojoba oil |
0.57 ± 0.005 |
1.45 ± 0.005 |
2.56 ± 0.006 |
3.58 ± 0.006 |
4.14 ± 0.007 |
4.5 ± 0.006 |
5.59 ± 0.003 |
5.02 |
| Chitosan |
0.55 ± 0.003 |
1.2 ± 0.005 |
2.26 ± 0.001 |
2.72 ± 0.002 |
3.1 ± 0.006 |
3.48 ± 0.004 |
3.87 ± 0.004 |
3.32 |
Table 8: Changes of thiobarbituric acid (TBA, mg MDA/kg) in the common carp, C. carpio, fillets treated with natural additives during frozen storage at -18 ± 1Ë?C up to 180 days.
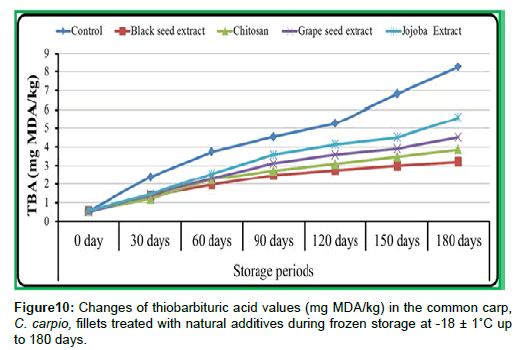
Figure 10: Changes of thiobarbituric acid values (mg MDA/kg) in the common carp, C. carpio, fillets treated with natural additives during frozen storage at -18 ± 1Ë?C up to 180 days.
Total volatile base-nitrogen values: Results (Table 9 and Figure 11) revealed that, the initial values of total volatile base-nitrogen in the common carp fillets after processing during zero time showed no alternations negligible in all samples treated with natural additives, compared with the control ones. During frozen storage at -18 ± 1°C, however, the total volatile base-nitrogen of control samples increased rapidly and reached the value of 49.50 ± 0.06 mg/100 g, compared with 24.08 ± 0.04, 26.01 ± 0.02, 30.12 ± 0.08 and 32.29 ± 0.09 mg/100 g, respectively of samples treated with black seed, chitosan, grape seed and Jojoba oils after 180 days of storage. At the end of storage period (180 days), however, the lowest increase (10.56 mg/100 g) of total volatile base-nitrogen was recorded in fish fillets treated with black seed and the highest increase (18.63 mg/100 g) was recorded in the samples treated with Jojoba oil; it was lower than the control ones (35.61 mg/100 g). Generally, total volatile base-nitrogen in the common carp fillets increased with the increasing storage periods and decreased in all samples treated with natural additives, compared with the control ones.
| Storage periods |
0 day |
30 days |
60 days |
90 days |
120 days |
150 days |
180 days |
Increase rate |
| Treatments |
| Control |
13.89 ± 0.03 |
21.42 ± 0.05 |
25.21 ± 0.03 |
32.99 ± 0.09 |
37.74 ± 0.03 |
43.48 ± 0.04 |
49.5 ± 0.06 |
35.61 |
| Black seed oil |
13.52 ± 0.11 |
14.04 ± 0.03 |
16.91 ± 0.04 |
5.78 ± 0.08 |
21.04 ± 0.09 |
23.29 ± 0.04 |
24.08 ± 0.04 |
10.56 |
| Grape seed oil |
13.71 ± 0.08 |
17.9 ± 0.03 |
20.6 ± 0.05 |
26 ± 0.06 |
26.26 ± 0.02 |
27.22 ± 0.06 |
30.12 ± 0.08 |
16.41 |
| Jojoba oil |
13.66 ± 0.06 |
18.92 ± 0.02 |
33.25 ± 0.04 |
27.98 ± 0.05 |
30.53 ± 0.04 |
31.08 ± 0.09 |
32.29 ± 0.09 |
18.63 |
| Chitosan |
13.66 ± 0. 09 |
17.62 ± 0.07 |
18.25 ± 0.06 |
18.78 ± 0.07 |
22.15 ± 0.04 |
24.01 ± 0.02 |
26.01 ± 0.02 |
12.35 |
Table 9: Changes of total volatile base-nitrogen (TVB-N, mg/100g) in the common carp, C. carpio, fillets treated with natural additives during frozen storage at -18 ± 1Ë?C up to 180 days.
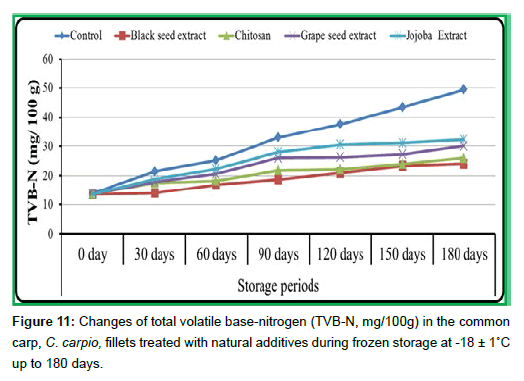
Figure 11:Changes of total volatile base-nitrogen (TVB-N, mg/100g) in the common carp, C. carpio, fillets treated with natural additives during frozen storage at -18 ± 1Ë? up to 180 days.
Statistical analysis for chemical composition of frozen fishes
Analysis of Variance (ANOVA), based on chemical composition (moisture, crude protein, crude fat, ash content, carbohydrate and calorific value) of common carp fillets during frozen storage are shown in Table 10. Data illustrated that, one way (ANOVA, p<0.05) between the different storage periods of common carp fillets, based on chemical compositions, showed very highly significant differences for all parameters. On the other hand, one way of ANOVA (p<0.05) between the different treatments of common carp fillets, based on chemical compositions, showed significant differences for ash content and crude fat and it showed nonsignificant differences for the remaining parameters.
| Chemical composition |
Source of variance |
Df |
F-value |
P-value |
| Moisture |
Storage periods |
6 |
32.63 |
<0.001 |
| Treatments |
4 |
0.79 |
0.543 |
| Crude protein |
Storage periods |
6 |
18.18 |
<0.001 |
| Treatments |
4 |
1.03 |
0.408 |
| Crude fat |
Storage periods |
6 |
6.42 |
<0.001 |
| Treatments |
4 |
2.86 |
0.04 |
| Ash content |
Storage periods |
6 |
4.09 |
0.005 |
| Treatments |
4 |
3.47 |
0.046 |
| Carbohydrates |
Storage periods |
6 |
39.3 |
<0.001 |
| Treatments |
4 |
0.57 |
0.689 |
| Total calories |
Storage periods |
6 |
17.41 |
<0.001 |
| Treatments |
4 |
1.43 |
0.248 |
Table 10: Analysis of variance (ANOVA), based on chemical compositions, of common carp, C. carpio, frozen fillets.
Statistical analysis for physicochemical quality of frozen fishes
Analysis of Variance (ANOVA), based on the physicochemical quality (pH, TBA and TVB-N) of common carp fillets during frozen storage are shown in Table 11. Data recorded that, one way of ANOVA (p<0.05) between the different storage periods of common carp fillets, based on physicochemical quality, showed highly significant differences for all parameters. On the other hand, ANOVA (p<0.05) between the different treatments of common carp fillets, based on physicochemical quality, showed nonsignificant differences for all parameters except TVB-N which showed significant differences.
| Physicochemical quality |
Source of variance |
Df |
F-value |
P-value |
| pH |
Storage periods |
6 |
16.26 |
<0.001 |
| Treatments |
4 |
1.48 |
0.234 |
| TBA |
Storage periods |
6 |
10.4 |
<0.001 |
| Treatments |
4 |
2.02 |
0.117 |
| TVB-N |
Storage periods |
6 |
6.03 |
<0.001 |
| Treatments |
4 |
3.31 |
0.023 |
Table 11: Analysis of variance (ANOVA), based on physicochemical quality, of common carp, C. carpio, frozen fillets.
Discussion
Chemical composition of frozen fishes
Results revealed that, moisture content in the carp fish fillets decreased with the increasing storage periods and increased in all samples treated with natural additives, compared to the control ones, during the different storage periods (Chito>Black seed oil>Jojoba oils>Grape seed oil>control samples). This may be attributed to small reduction in water related to the evaporation, particularly at the low relative humidity that is maintained under freezing conditions. However, the increasing of liquid loss owing to the effect of protein denaturation, these results agree with [12] and differ with [13] whom observed that, the moisture content of washed and unwashed minced silver carp was increased with the increasing storage periods.
Results revealed that, the crude protein in the carp fillets decreased with the increasing storage periods and increased in all samples treated with natural additives when compared with the control ones (Chitosan>Blackseed oil>Grape seed oil>Jojoba oils>control samples). Decreasing in crude protein may be attributed to denaturation of fish protein to more volatile products as Total Volatile Bases (TVB-N), Trimethyl Amine (TMA) hydrogen sulphide and ammonia., i.e., due to the changes in the proportion of chemical compositions and protein breakdown. Denaturation of protein involves the destruction of its secondary, tertiary and quaternary structures, reducing the protein to a simple polypeptide chain [14]. A number of factors, including slow freezing and variability of storage conditions, caused this denaturation. Rate at which denaturation occurs depends largely on freezing temperature. Similar observations were detected by many authors including [13,15,16].
Results showed that, the crude fat in the carp fillets increased with the increasing storage periods and increased in all treated samples when compared with the control ones, during frozen storage periods (Black seed oil 17], the crude fat of sea bass fillets was 1.22% at the beginning of the storage and reported as 2.28, 2.86, and 3.58% in the 3rd, 6th, and 9th month of storage, respectively. Tokur [18] also reported an increase in crude fat during frozen at -18°C storage of rainbow trout. Results disagrees with Asgharzadeh et al. [13] whom observed that, the crude fat of washed and unwashed minced silver carp was decreased during frozen storage and Gandotra et al. [19] whom observed that, crude fat in the carp fillets decreased with the increasing storage periods.
The present study unfolded that, ash content in the carp fillets decreased with the increasing storage periods and decreased in all samples contained antioxidant when compared with the control ones (Black seed oil >Chitosan>Grape seed oil>Jojoba oils>control samples). Results were in agreement with that obtained by Gandotra et al. [19] whom reported that, ash content of muscles of C. carpio decreased with the increasing storage periods. Similarly, Okeyo et al. [20] observed a decrease in total ash content of Nile Perch during frozen storage periods. The decrease in ash content was associated to the drip loss during thawing process [17].
Physicochemical quality of frozen fishes
Results revealed that, pH value in the carp fillets increased with the increasing storage periods and decreased in all samples contained natural additives than in the control ones (Chitosan21,22] whom recorded that, alkaline compounds were accumulated through autolytic activities or microbial metabolism which lead to increasing in pH values during frozen storage and disagree with Asgharzadeh et al. [13] whom stated that, pH profiles for both unwashed and washed silver carp minces did not show significant changes (p>0.05) as a result of the frozen storage. However, pH of antioxidant treated samples was lower than in the control ones in frozen fish fillets during six months of storage. According to Grigorakis et al. [23] post mortem pH can vary from 5.4-7.2, depending on fish species.
The highest incremental rates were found in control samples than treated by natural additives may be due to the effectiveness of these natural additives as an antimicrobial agent so, it can be used as a way of combating the growth of common microorganisms causes of food poisoning [24]. Natural additives (essential oils and chitosan) were more effective in delaying the rate of increasing pH value as antioxidant and antimicrobial agents compared with control and prolong shelf life period during the frozen storage. pH values of investigated fish products were very acceptance until the end of the storage period, where it were between 6.3-7.0 that proposed as acceptance limit of fish and fish products, whereas values above 7.0 were considered to be spoiled. Similar findings were reported by Ibrahim and El- Sherif [25].
The present study showed that, total volatile base-nitrogen in the carp fillets increased with the increasing storage periods and decreased in all samples contained antioxidant than in the control ones (Black seed oil < Chitosan26]. This increase also can be explained as a result of the breakdown of endogenous compounds into non-protein N-compounds. This result agrees with Moral-Rama [13,27] whom reported that, TVB-N used in frozen fish as an indicator of starting fish quality before the freezing step is accomplished since no TVB-N content change during frozen storage would be expected to occur. TVB-N values of the examined samples indicated that all fresh and frozen samples were acceptable according to the Egyptian Organization for Standardization and Quality [28] which recommended that, the permissible limit for TVB-N not more than 30 g/100 g.
Conclusion
The present study showed that, Thiobarbituric Acid (TBA) values in the carp fillets increased with the increasing storage periods and decreased in all samples contained antioxidant than in the control ones (Black seed oil
36171
References
- Atarés L, Chiralt A (2016) Essential oils as additives in biodegradable films and coatings for active food packaging. Trends Food Sci Technol 48: 51-62.
- FDA, Food and Drug Administration (2015) CFR Code of Federal Regulations Title 21, subchapter b- food for human consumption. Part 182 -Substances generally recognized as safe. U.S. Food & Drug Administration.
- Attouchi M, Sadok S (2012) The effects of essential oils addition on the quality of wild and farmed sea bream (Sparus aurata) Stored in Ice Food. Bioprocess Technol 5: 1803-1816.
- Hall GM (2011) Freezing and chilling of fish and fish products. Blackwell Publishing Ltd pp: 77-97.
- Jessen F, Nielsen J, Larsen E (2014) Chilling and freezing of fish. Seafood processing pp: 33-59.
- Alizadeh E, Chapleau N, De lamballerie M, Le-bail A (2007) Effect of different freezing processes on the microstructure of Atlantic salmon (Salmo salar) fillets. Innov Food Sci Emerg Technol 8: 493-499.
- Viji P, Venkateshwarlu G, Ravishankar C, Gopal TS (2017) Role of plant extracts as natural additives in fish and fish products-A review. Fishery Technology 54:145-154.
- AOAC [Association of Official Analytical Chemists] (2012) Official methods of analysis. (15th ed) Association of official analytical chemists, Inc., Washington DC USA 478p.
- Vareltzis K, Koufidis D, Gavriilidou E, Papavergou E, Vasiliadou S (1997) Effectiveness of a natural rosemary (Rosmarinus officinalis) extract on the stability of filleted and minced fish during frozen storage. J Eur Food Res Tech 205:93-96.
- Mwansyemela NA (1973) Report on studies of routine analysis for food chemistry. Institute for fishery products TNO at Ijmuiden Holland 2nd April to 15th Sept.
- Tarladgis BG, Watts BM, Younathan MT, Dugan L (1960) A distillation method for the quantitative determination of malonaldehyde in rancid food. J Am Oil Chem Soc 37: 44-48.
- Goncalves AA, Rech BT, Rodrigues PM, Pucci DMT (2008) Quality evaluation of frozen seafood (Genypterus brasiliensis, Prionotus punctatus, Pleoticus muelleri and Perna perna) previously treated with phosphates. PanAm J Aquatic Sci 3: 248-258.
- Asgharzadeh A, Shabanpour B, Aubourg SP, Hosseini H (2010) Chemical changes in silver carp (Hypophthalmichthys molitrix) minced muscle during frozen storage: Effect of a previous washing process. Grasa Aceite 61: 95-101.
- Careche M, Li-Chan EC (1997) Structural changes in cod myosin after modification with formalaldehyde or frozen storage. J Food Sci 62:717-723.
- Eyo AA (2001) Fish processing technology in the tropics. University of Ilorin Press pp:403.
- Al-Ghanim KA (2016) Effect of different storage temperatures on chemical composition and sensory attributes of the flesh of Cyprinus carpio and Clarias gariepinus. Pakistan J Zool 48: 305-310.
- Beklevik G, Polat A, Ozogul F (2005) Nutritional value of Sea Bass (Dicentrarchus labrax) fillets during frozen (-18°C) storage. Turk J Vet Anim Sci 29: 891- 895.
- Tokur B (2000) The quality changes of trout fillets (Oncorhynchus mykiss) with vegetable sauce during frozen storage. Thesis Ege Univ Natural Sci Inst Üzmir 204pp.
- Gandotra R, Gupta V, Koul M, Gupta S (2013) Quality changes in the muscles of Wallago attu during frozen stoarge (-12 ± 2°C) conditions. Res J Animal Vet Fishery Sci 1: 16-20.
- Okeyo GO, Lokuruka MNI, Matofari JW (2009) Nutritional composition and shelf life of the Lake Victoria Nile perch (Lates niloticus) stored in ice. AFJAND 9: 901-919.
- Pons-Sanchez-Cascado S, Veciana-Nogues MT, Bover-Cid S, Marine-Font A, Vidal-Carou MC (2006) Use of volatile and non-volatile amines to evaluate the freshness of anchovies stored in ice. J Sci Food Agri 86: 699-705.
- Liu S, Fan W, Zhong S, Ma C, Li P, et al. (2010) Quality evaluation of tray-packed tilapia fillets stored at 0°C based on sensory, microbiological, biochemical and physical attributes. Afr J Biotechnol 9: 692-701
- Grigorakis K, Taylor KDA, Alexis MN (2003) Seasonal patterns of spoilage of ice-stored cultured gilthead sea bream (Sparus aurata). J Food Chem 81: 263-268.
- Fisher K, Phillips CA (2006) The effect of lemon, orange and bergamot essential oils and their components on the survival of Campylobacterjejuni, Escherichiacoli O157:H7, Listeria monocytogenes, Bacillus cereus and Staphylococcus aureus in vitro and in food systems. J Appl Microbiol 101: 1232-1240.
- Ibrahim SM, El-Sherif SA (2008) Effect of some plant extracts on quality aspects of frozen tilapia (Oreachromis niloticus L). Global Veterinaria 2: 62-66.
- Sacchetti G, Maietti S, Muzzoli M, Scaglianti M, Manfredini S (2005) Comparative evaluation of 11 essential oils of different origin as functional antioxidants, antiradicals and antimicrobials in foods. Food Chem 91: 621-632.
- Moral-Rama A (1987) Physical and chemical methods for quality control in fish. Aliment Equipos Y Tecno 3: 115-122.
- E.O.S. [Egyptian Organization for Standardization and Quality] (2005) Chilled and frozen fish EOS: 3494 pp: 889-892.


