Keywords
Animal breeding; Aquaculture; Bayesian inference; Heritability; Tambaqui
Introduction
The current expectation in the world is that protein consumption demand is forecast to grow enormously mainly in developing countries (Rothschild and Plastow 2008). To satisfy the increasing demands for animal protein, it is essential to develop strategies to maximize the productivity per area, reducing cost and increasing profitability (Lind et al. 2012). In Brazil, Colossoma macropomun (Cuvier, 1918) is the main native species produced (111.084, 1t) increasing at twice the previous year’s production, standing behind only tilapia's production (253.824,1t). The increasing of C. macropomum production is mainly due a good quality meat, acceptance by the consumer market and easy cultivation by fish farmers (Ministério da Pesca e Aquicultura 2013). However, production of C. macropomum presently is maintained by capturing breeding from nature individuals, which do not perform well in captivity.
To increase productivity of C. macropomum in captive a Genetic Improvement Program (GIP) program was started recently aiming to select animals with high performance for growth. In this sense, genetic improvement in the C. macropomum populations can be a tool for increasing the productivity by animal selection. GIP aims at the dissemination of improved animals to fish farmers, enabling the conservation of species and generating an economic impact; since the improved animals perform better in shorter time farming. Nonetheless, few estimates of additive genetic variance and heritability are available for fish populations (Serbezov et al. 2010). Indeed, aquaculture stocks used are genetically similar or inferior to wild stocks. A large part of the fish species has undergone a limited amount of genetic improvement or domestication, with some exceptions like rainbow trout, salmon or tilapia (Gjedrem 2000, 2010; Brummett et al. 2004).
Knowledge of genetic parameters for growth traits in fish would assist in animal selection allowing accurate prediction of genetic gain. For the estimation of genetic parameters, (co)variance components and genetic values are available in several computer programs that use different methodologies. Bayesian approach has some advantages, such as flexibility in choosing distributions for sample data and unknown parameters (Sorensen 2009). This methodology uses the Gibbs Sampling Method without the need for solutions to the equations of mixed models and provides direct and precise estimates of (co)variance and genetic values as well as estimates of credibility intervals (Van Tassel and Van Vleck 1995; Faria et al. 2010). Sometimes, the maternal genetic effect has been considered an incorporated effect on an individual’s performance for different traits to increase the accuracy of estimated breeding values (EBV) (Bijma 2006; Chen et al. 2007). This approach seems very suitable for populations at the domestication process, as the case of the C. macropomum, where no prior information on the estimation of genetic parameters is available.
Thereby, the aim was to estimate genetic parameters for body weight and morphometric traits measured in two growth stages in C. macropomum by Bayesian inference.
Material and Methods
Data Set
In this study were used the dataset of Genetic Improvement Program of tambaqui (C. macropomum), implemented by Aquabrasil project and coordinated by EMBRAPA (Resende 2009). Were used information from 198 animals half- sib maternal obtained at the reproductive season 2008/2009 from 12 females and 8 males presenting different degrees of domestication from different fish farms (Figure 1).
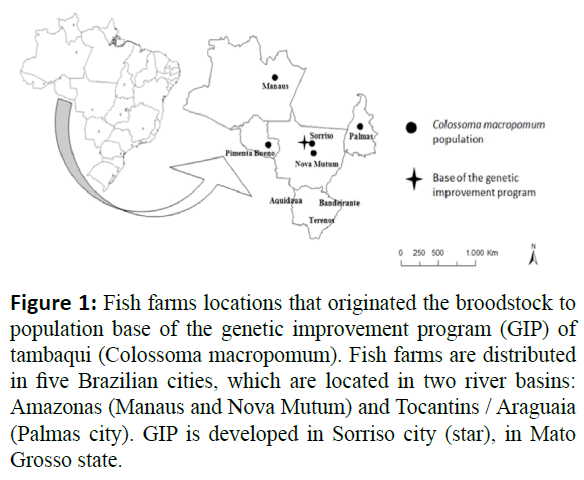
Figure 1: Fish farms locations that originated the broodstock to population base of the genetic improvement program (GIP) of tambaqui (Colossoma macropomum). Fish farms are distributed in five Brazilian cities, which are located in two river basins: Amazonas (Manaus and Nova Mutum) and Tocantins / Araguaia (Palmas city). GIP is developed in Sorriso city (star), in Mato Grosso state.
The families were half- sibs maternal; oocytes of one female were fertilized by semen of two males due a large volume of oocytes produced by this species. However, was not performed analysis per family in this study because the low number of individuals per family. After fertilization, embryos remained in incubator until the complete absorption of the yolk sac (4-6 days). Then, post-larvae were transferred to circular tanks by half-sib maternal groups, kept into laboratory and fed exclusively with artemia. From day 12-16 it was started the introduction of commercial feed (40% of crude protein) ad libitum, together with artemia, until the larvae are able to feed exclusively with commercial feed. After 40 days, the feed was adjusted to 32% of crude protein. So, animals were transferred to breeding units (hapas) (4 m2) into the growth tank (5000 m2), keeping half-sib maternal groups. Upon reaching approximately 20 g in weight the animals were individually identified by passive integrated transponder tags (PIT) and released in the tank to growth fed ad libitum.
Were evaluated biometrics data taken at 12 and 24 months of age (2008-2011) corresponding to average of 475.5 and 854.5 days of age, respectively. Were taken seven measurements to assessing 101 females for 12 and 24 months old; and 96 and 99 males to 12 and 24 months old, respectively. The biometrics data measured in each animal were the head length (cm), weight (grams), width (cm), height (cm), length (cm) of Figure 2. The daily weight gain was evaluated as ratio between weight in the day of measure and initial weight.
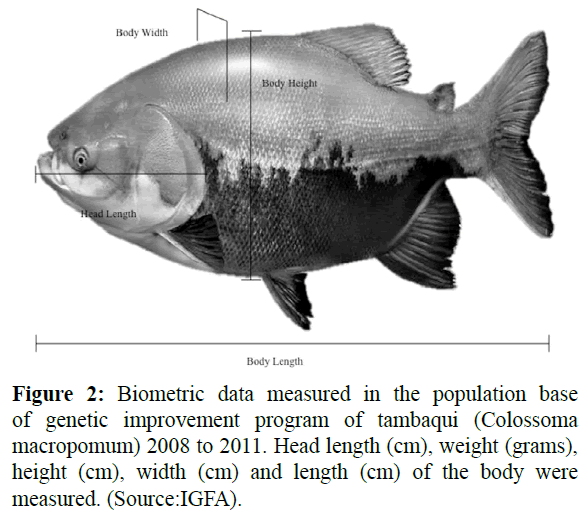
Figure 2: Biometric data measured in the population base of genetic improvement program of tambaqui (Colossoma macropomum) 2008 to 2011. Head length (cm), weight (grams), height (cm), width (cm) and length (cm) of the body were measured. (Source:IGFA).
Statistical Analyses
Statistical model was determinate testing the effects of sex and age, linear and quadratic dependent on age by PROC GLM of SAS statistical package. Estimates of genetic parameter and (co)variance components were performed to 12 months old by animal model: y = XB+ Z1a + Z2m+ e ; where B, a, m, and e are identifiable environmental effects vectors, genetic values, common family environment effects, and residue, respectively. X, Z1 and Z2 are incidence matrices of the identifiable environmental effects (B), genetic additives (a) and common family environment (m). Estimates of genetic parameter and (co)variance components to the data of 24 months was performed using the same animal model described above, but not considering the common family environment effect. Genetic parameters and (co)variance were carried out by MTGSAM (Multiple Trait Gibbs Sampler for Animal Models) system. Distributions a posteriori were obtained from 400.000 cycles, using disposal intervals of 40.000 burned at 50 cycles. Convergence of chains generated by Gibbs sampler was evaluated through graph analysis and estimation of credibility intervals at 95% were carried out through Heidelberger and Welch Test (1983) by CODA library, implemented in the program R (version 2.8.1). Phenotypic correlation between morphometric traits and body weight were obtained by Pearson’s linear correlation coefficient with 95% of confidence interval.
Results
A preliminary exploratory analysis showed that there are effects between sex and age (p<0.05) and indicated a linear and quadratic behavior as function of age for the morphometric traits evaluated (p<0.05). Thus, sex was included as fix effect in the animal model for 12 and 24 months. There was convergence for all analyzed chains, indicating that samples were extracted from a stationary chain.
In general, heritability values estimates were high, ranging from 0.25 to 0.49 at 12 months and from 0.17 to 0.42 at 24 months old, with exception of head length, which showed the moderate heritability value (0.17) (Table 1). Heritability values estimated for body weight and daily weight gain traits were higher of 0.40, indicating that a great proportion of variance observed for these traits has genetic origin. Heritability estimates for head length, height and body width were of 0.25, 0.29, and 0.35, respectively, at 12 months and there was a reduction of heritability at 24 months, decreasing 8%, 7% and 15%, respectively. Inversely, there was a 15% increase in estimate heritability for body length, 0.31 at 12 months to 0.46 at 24 months. Body weight and daily weight gain were the traits that showed highest heritability at 12 months, 0.44 and 0.49, however, heritability estimate for body weight showed the less reduction at 24 months old, being just 2%.
| |
12 months |
24 months |
| |
h2 |
m2 |
σ2p |
h2 |
σ2 |
| DWG |
0.49
|
0.11
|
0.64
|
0.40
|
0.76
|
| BL |
0.31
|
0.09
|
6.37
|
0.46
|
7.40
|
| LH |
0.25
|
0.08
|
0.32
|
0.17
|
0.91
|
| BH |
0.29
|
0.07
|
0.12
|
0.22
|
0.27
|
| BWi |
0.35
|
0.20
|
1.24
|
0.20
|
1.96
|
| BW |
0.44
|
0.06
|
0.13
|
0.42
|
0.55
|
* Daily weight gain (DWG), Body length (BL), Length of head (LH), Body height (BH), Body width (BWi), and Body weight (BW).
Table 1: Genetic parameters in Colossoma macropomum estimated at 12 and 24 months. Estimates a posteriori of the means and credibility intervals (in parentheses) to heritability (h2), common family environment (m2), and phenotypic variance (σ2p) for morphometric and performance traits* are presented below.
Common family environment effect was lesser than 11%, except for body width that had a 20% interest relative at 12 months old. Total phenotypic variance increased with increasing age for all measured traits, overall leading to a reduced importance of the heritability with increasing age. The increase of phenotypic variance was lesser for daily weight gain, just 12%, however, body weight showed the lesser estimate (0.13), indicating a lower environmental relative participation in animal performance for weight. Likewise, all the morphometric traits showed a greater genetic influence on growth performance at 12 months, reflected in high heritability and lesser phenotypic variance values. Inversely, at 24 months the estimates of phenotypic variance were higher, coinciding with the decrease of heritability estimates.
Phenotypic correlations coefficients were high and positive, ranging of 0.3 to 0.9 and 0.4 to 0.7, at 12 and 24 months, respectively (Table 2). Body weight showed the higher correlation coefficient with head length, length and body width (between 0.7 to 0.8) at 12 months, but at 24 months the body weight showed just a moderate correlation coefficient with body length (0.6). The lowest correlation coefficient was observed to body height at 12 months (0.3) while the greatest was observed between head length and body length (0.9).
| |
BL |
LH |
BWi |
BH |
BW |
| BL |
|
0.799 |
0.583 |
0.612 |
0.632 |
| LH |
0.915 |
|
0.522 |
0.559 |
0.542 |
| BWi |
0.822 |
0.802 |
|
0.436 |
0.468 |
| BH |
0.357 |
0.391 |
0.445 |
|
0.360 |
| BW |
0.781 |
0.783 |
0.860 |
0.450 |
|
* Body length (BL), Length of head (LH), Body height (BH), Body width (BWi), and Body weight (BW).
Table 2: Coefficient of phenotypic correlation at 12 and 24 months in Colossoma macropomum. Coefficient of phenotypic correlation for morphometric traits* and body weight at 12 months (below diagonal) and 24 months (above diagonal).
Discussion
The high heritability value estimates in C. macropomum body weight also were observed in the others aquaculture species, such as rainbow trout (Oncorhynchus mykiss) (Gjerde and Schaeffer 1989) and atlantic salmon (Salmosalar) (Fjalestad et al. 1995), for which estimates values were 0.21 and 0.35, respectively. In fact, the heritability for morphometric and performance traits varies at the fish species depending with development stage. For example, in sea bass (Dicentrarchus labrax) was observed a heritability ranged from 0.21 to 0.56 at 11 and 27 months old, respectively (Saillant et al. 2006). In masu salmon (Oncorhynchus masou masou), heritability values for body weight and fork length were 0.41 to 0.51 and 0.46 to 0.54, at 12 and 24 months old, respectively (Zhang et al. 2013). Likewise, heritability for body mass, body standard length and body height using microsatellite data in yellow croaker (Larimichthys crocea) was very close to those estimated in C. macropomum. Heritability estimates at 13 month old was 0.30 for body mass, 0.25 for body standard length and 0.36 for body height (Liu et al. 2013).
Indirect selection for fillet weight can be made using morphometric traits because there are positive correlation coefficients suggesting that these are controlled by the same set of genes and there is a little or any independent genetic variability among traits (Rutten et al. 2005a). In Nile tilapia, for example, there was a strong almost linear relationship between body measurements and fillet weight, genetic correlation between body weight and fillet weight was 0.99 and between body weight and fillet yield 0.74 (Rutten et al. 2005b). Thus, selection for one of traits would result in gain on the others traits, not being necessary use all measurement.
We considered the common family environment effect only at 12 month old because this effect tends to reduce and lose importance conform the animal becomes older. C. macropomum there is not a species with parental care; being expected a low relative contribution of common family environment effect. Even in the species with parental care, such as tilapia (Oreochromis niloticus) the estimate of common family environment effect decrease over time, ranged from 0.30 to 0.12 in five months old (Santos, 2011).
Conclusion
Our results show that the genetic parameters here estimates for body weight, daily weigh gain and morphometric traits indicate that these can be improved by animal selection in both stages analyzed. Morphometric traits have a good potential for selections because the heritability estimates are of medium to high magnitudes and are genetically correlated, therefore, do not require the use of all measurements in a selection program.
Acknowledgements
This research was supported/partially supported by Embrapa Pantanal and Conselho Nacional de Pesquisa e Desenvolvimento (CNPq).The authors would like to thank the technical team of Delicious Fish for their support and assistance with this Project.
9292
References
- Bijma, P. (2006) Estimating maternal genetic effects in livestock. Journal of animal science 84, 800-806
- nBrummett, R.E., Angoni, D.E.,Pouomogne, V. (2004) On-farm and on-station comparison of wild and domesticated Cameroonian populations of Oreochromis niloticus. Aquaculture 242, 157-164
- nChen, C.Y., Johnson, R.K., Newman, S.,VanVleck, L.D. (2007) A general review of competition genetic effects with an emphasis on swine breeding. Genetics and molecular research: GMR6, 594-606
- nFaria, C., Pires, B., Vozzi, A. et al. (2010) Genetic correlations between categorical morphological traits in Nelore cattle by applying Bayesian analysis under a threshold animal model. Journal of Animal Breeding and Genetics 127, 377-384
- nFjalestad, K.T., Gjedrem, T., Refstie, T. (1995) Selection for enhanced disease resistance in Atlantic salmon. Aquaculture 137, 275
- nGjedrem, T. (2000) Geneticimprovement of cold-waterfishspecies. AquacultureResearch31, 25-33
- nGjedrem, T. (2010) The first family-based breeding program in aquaculture. Reviews in Aquaculture 2, 2-15
- nGjerde, B.,Schaeffer, L.R. (1989) Body traits in rainbow trout: II. Estimates of heritabilities and of phenotypic and genetic correlations. Aquaculture 80, 25-44
- nHeidelberger P., Welch PD. (1983) Simulation run length control in the presence of an initial transient. Operations Research 31, 1109-44
- nLind, C.E., Ponzoni, R.W., Nguyen, N.H., Khaw, H.L. (2012) Selective breeding in fish and conservation of genetic resources for aquaculture. Reproduction in domestic animals = Zuchthygiene 47 Suppl 4, 255-263
- nLiu, X.D., Zhao, G.T., Cai, M.Y., Wang, Z.Y. (2013) Estimated genetic parameters for growth-related traits in large yellow croaker Larimichthys crocea using microsatellites to assign parentage. Journal of fish biology 82, 34-41
- nMinistério da Pesca e Aquicultura (2013) Boletim estatístico da pesca e aquicultura: Brasil 2011
- nResende, E.K. de (2009) Research in network in aquaculture: technological basis for sustainable development of aquaculture in Brazil. Aquabrasil. Revista Brasileira de Zootecnia 38, 52-57
- nRothschild, M.F., Plastow, G.S. (2008) Impact of genomics on animal agriculture and opportunities for animal health. Trends in Biotechnology 26, 21-25
- nRutten, M.J.M., Bovenhuis, H., Komen, H. (2005a) Genetic parameters for fillet traits and body measurements in Nile tilapia (Oreochromis niloticus L.). Aquaculture 246, 125-132
- nSantos, A.I., Ribeiro, R.P., Vargas, L., Mora, F., Filho, L.A.,et al. (2011). Bayesian genetic parameters for body weight and survival of Nile tilapia farmed in Brazil. Pesquisa Agropecuaria Brasileira 46, 33-43
- nSaillant, E., Dupont-Nivet, M., Haffray, P., Chatain, B. (2006) Estimates of heritability and genotype-environment interactions for body weight in sea bass (Dicentrarchus labrax L.) raised under communal rearing conditions. Aquaculture 254, 139-147
- nSerbezov, D., Bernatchez, L., Olsen, E.M., Vollestad, L.A. (2010) Quantitative genetic parameters for wild stream-living brown trout: heritability and parental effects. In: J Evol Biol, Vol. 23,1631-41
- nSorensen, D. (2009) Developments in statisticalanalysis in quantitativegenetics. Genetica136, 319-332
- nVan Tassel, C.P., Van Vleck, D.L. (1995) A manual for use of MTGSAM. A set of FORTRAN programs to apply Gibbs sampling to animal models for variance component estimation (DRAFT)
- nZhang, Y.Y., Jia, Z.Y., Bai, Q.L., Chen, S.Q., Shi, L.Y. et al. (2013) [Heritability of body weight and fork length for Oncorhynchus masou masou]. Yi chuan = Hereditas/Zhongguo yi chuan xue hui bian ji 35, 202-207n


