Keywords
Trolling line; Warp line; Towing speed; Mass-spring; Static
Introduction
Similar to long lines, trolling lines are considered relatively benign in terms of their potential impact on the benthos, by catches, and ghost fishing, compared with net gears. Moreover, trolling line and long line gears are somewhat species-selective; the selectivity of such line gears is affected by the fishing strategy used with respect to the vertical and horizontal distribution of the target species (Løkkeborg and Bjordal, 1992). A trolling line is composed mainly of flexible structures-the towing warp line, mainline, and branch lines with artificially or naturally baited hooks. Additionally, it includes other rigid structures, such as sinkers, floats, and other tools. The lengths of the towing rope and branch line and their interval depend on the target species, distribution density, and swimming depth. It is a passive fishing method whereby a line with hooks is attached behind a vessel, trolling at a specific speed, such that the hooks reach at a desired depth where the target species is expected to be present in such a fashion that fish will be attracted to the bait and move voluntarily towards to the gear (Gabriel et al., 2008). For this reason, the towing speed must be slower than the optimum swimming speed of the target species. Additionally, a trolling line is strategically set to cross a swimming school transversely at a certain angle to maximize the fishing band. The trolling speed, current, and static forces affect fishing gear performance. Additionally, the ropes, shape and size of the hook, and the physical properties of the bait also have an impact on gear efficiency. For example, due to its invisibility, a colorless monofilament is used preferably for both the mainline and branch lines. The depth of the hooks in the water is selected based on information on the sizes of individual fish and the species composition of the catch (Lee et al., 2005). Thus, it is always important to control hook depth to avoid by catches and damage to the habitat; the line gear shape is usually adjusted by controlling the length of the float line, with weights rigged to the gear system (Campbell and Young, 2012). It is important to understand and estimate the shape of the trolling line to ensure that the deployed gear arrives at the target depth, to avoid entanglement of the branch lines and ensure that it flows with the current (Miyamoto et al., 2006), rendering the gear environmentally friendly. The elasticity of the rope of the trolling line allows the working shape of the fishing gear to change under external forces (Wan et al., 2002). The hydrodynamic force imposed on trolling depressor (one of the major components of trolling lines) and its six degrees as of motion in the flume tank were measured and compared with predicted results (Keigo Ebata, 2003). The three-dimensional (3D) underwater shape of tuna long line fishing gear has been measured using an ultrasonic positioning system to understand the behavior of gear shape under the water and to monitor changes in the fishing gear in real time (Miyamoto et al., 2006). The hook depth can affect the fishing performance of tuna long line gear. The underwater shapes of tuna long lines have been evaluated experimentally and numerically using a mass-spring model (Lee et al., 2005). The drag and lift forces are mainly hydrodynamic forces that affect the shape of the fishing gear underwater (Lee et al., 2011). The magnitude and direction of the hydrodynamic forces significantly determine the loads imposed on gear components, including the hooks (Fridman and Carrothers, 1986). Song et al. (2006) used stepwise regression to evaluate the relationship between the actual and theoretical hook depths of a long line, considering the influences of current velocity, leeway and drift angle, wind speed and directions, and the relative bearing of the apparent wind.
The hairtail (Trichiurus lepturus) is a commercially important fishery stock in Korea. According to FAO 2015 report, Korea was the second leading nation, after China, in hairtail production across the globe from 2003 to 2013. However, the hairtail capture fishery has shown a declining trend since 1995. This has drawn attention from the government regarding the appropriate management for consistent production and use of modern and environmentally friendly fishing gear. The hairtail trolling line investigated here was originally adapted from the Japanese, who use it for the same species. However, direct use of their technology had drawbacks, because gear performance is affected greatly by the nature of the fishing site, the fishing depth of the target species, and other environmental factors. In the past, researchers in Japan focused on trolling line performance in terms of its practical aspects. Our study goes beyond this in that we focused on detailed engineering aspects of the gear and how the gear shape and hook depth can be affected by various factors, such as towing speed, tidal currents, and sinker size. To address these and other related issues, numerical methods were developed to predict hook depth and underwater gear shape. Moreover, such numerical approaches can assist the skipper with direct efforts to catch species at a specific target depth.
In the present research, the main objectives were as follows:
• Determination of the hook drag coefficient. This was used as an input in the numerical methods and helped to improve the accuracy of the estimates.
• Investigating the underwater behavior of model trolling lines in a flume tank.
• To develop numerical methods specifically for trolling line: static and dynamic (mass-spring) models.
• Verification of numerical approaches by comparing observed and computed data.
• Simulation trials to predict the underwater behavior of an actual full-scale hairtail. Trolling line in response to changes in towing speeds, sinker weights, tidal currents, and hauling speeds.
• Details on operational strategies for attaining a target hook depth by controlling the length of the warp line and weight of the sinker.
Materials and Methods
Flume tank experiment
To determine the drag coefficient of artificially baited hooks of the trolling line under different current conditions, and to observe the real shape and spatial distribution of elements of the trolling fishing gear models in real time at different towing speeds, two levels of experiments were performed using the vertical water circulation tank at the National Institute of Fisheries Science, Busan, Korea. This flume tank is 8.0 m (L)×2.8 m (W)×1.8 m (H) with an observation window of 1.4 m (H) × 3.5 m (L). It has impellers driven by an electro-hydraulic system and a current meter (VOT 2-200-20, KENEK) for flow rate measurements, and the current capacity of the water tank ranges from 0.03 to 2.0 ms-1. To measure resistance forces, an underwater tension meter (Model-SUMM-2K and optimum capacity of 196 N) was used in our experiments. For image analysis, a digital photo camera (EX2F, Samsung, Korea) and a photo digitizer tool were also used.
Experimental setup for drag force analysis: The underwater gear shape and attained hook depth are paramount factors for evaluating the efficiency of trolling line in catching target species. Catch rates on circle hooks used for tuna long line fishing exceeded J-style hooks for most species (Ward et al., 2009). The bait species and size are also important gear parameters affecting species selectivity. Before a fish moves towards a baited hook, it judges the situation based on the chemical, visual, and mechanical aspects of the bait (Løkkeborg and Bjordal, 1992). For the advanced hairtail trolling line system shown in Figure 1a, the artificial baited hook rigged to the mainline has a J style hook, originally adapted from Japan. As seen with other J-style hooks, the eye is not parallel, but rather tangential, to the shank. Another salient feature of this hook is that it stretches horizontally under water, deviating from the normal trend of aligning vertically with the bend at the base. Moreover, in the structural design of the hook, there is an oval shaped like structure at the upper tip of the hook close to an eye. As a result, its center of mass shifts from the middle of the shank towards the eye and achieves a horizontal configuration.
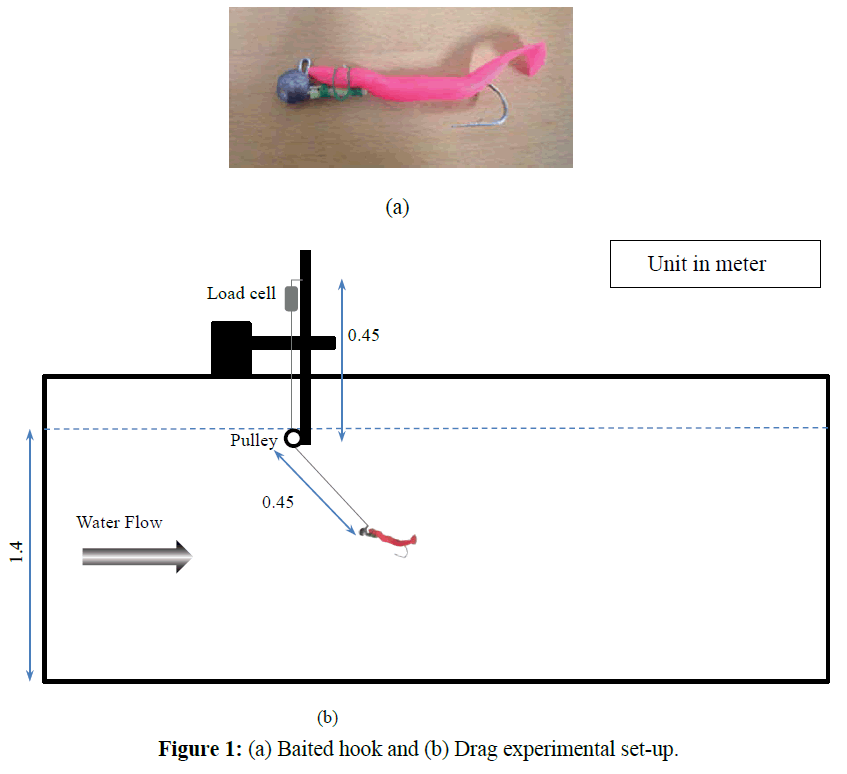
Figure 1: (a) Baited hook and (b) Drag experimental set-up.
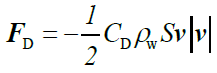
As shown in Figure 1b, an experiment for determining the drag coefficient of artificially baited hooks was carried out in the flume tank. A uniform string of 0.58 mm thick PA monofilament was used to connect an iron post to the load cell. The load cell was stretched downwards, passed over a smooth pulley, and tied with an artificially baited hook, which was 128 mm long with a mass of 2.48×10⁻² kg. In the experiment, the hook is subjected to currents ranging from 0.5 to 1.5 ms-1 at an interval of 0.1 ms-1, and the resistance load on the hairtail trolling line models was measured. Under all test conditions, the sampling time was ~20 s in the equilibrium configuration. Measurements were recorded at a frequency of 100 Hz. In each trial, 2,000 data points were collected, from which the mean hook drag coefficients, it is sometimes called as shape coefficient duet to the flexibility of plastic bait, were calculated empirically for artificially baited hooks, based on general drag equation,
 (1)
(1)
Where CD is the drag coefficient, S is the projected area, ρw is the water density, and V is the water velocity. Because of the smoothness of the pulley and string surfaces, the dynamic friction between them was considered negligible. Moreover, the tension along the string line was assumed to be the same throughout, and the projected area of a thin string, used to connect the hook and load cell, was so small that the hydrodynamic load on the thin string was also ignored in our calculations.
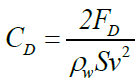
Experimental set-up for models: Model tests were carried out in a flume tank to verify the numerical methods for designing a full-scale trolling line and to examine the effects of sinker weights. The effects of different towing speeds on the underwater shape of the gear were also observed. Images were captured for physical measurements of the working shapes and positions of the model gears in space. A tension meter (load cell) was used to measure resistance forces on the gear system under different test conditions. Two model trolling lines were prepared by scaling down the branch line and the intervals of actual fishing trolling line at a ratio of 1:10 and adjusted to suit the tank size. The materials for the mainline and branch lines of the models were the same as those for a full-scale hairtail trolling line used in Korean fisheries. Two steel cylinders with masses of 0.13 kg and 0.26 kg were used as sinkers. Except for the size of the sinkers rigged to the model gears, other structural members were the same. As shown in Figure 2a, the towing warp line was 1.1 m long with a mainline 1.45 m long and a branch line 0.45 m long and a gap of 0.45 m between them. The artificially baited hook had a mass of 16.57×10⁻³ kg, and three spherical plastic buoys were bundled together to overcome distributed sinking forces along the mainline. The detailed physical specifications of the gear elements are shown in Table 1. Each model was fixed to an iron post and subjected to a stream of uniform water current as if the model gears were being towed in still water. Coded as models 1 and 2, they consisted of a pair of artificially baited hooks but sinker masses of 0.13 kg and 0.26 kg, respectively (Figure 2a). In the flume tank, model gears were trolled at speeds ranging from 1.2 to 1.5 ms-1 at 0.1 ms-1 intervals, which is close to the normal operational speed (i.e., 2 knots or 1 ms-1) of Korean hairtail fishing. Finally, using a digital camera, images at equilibrium were captured for measuring the shape in space and hook depths at each towing speed (Figures 2b and 2c).
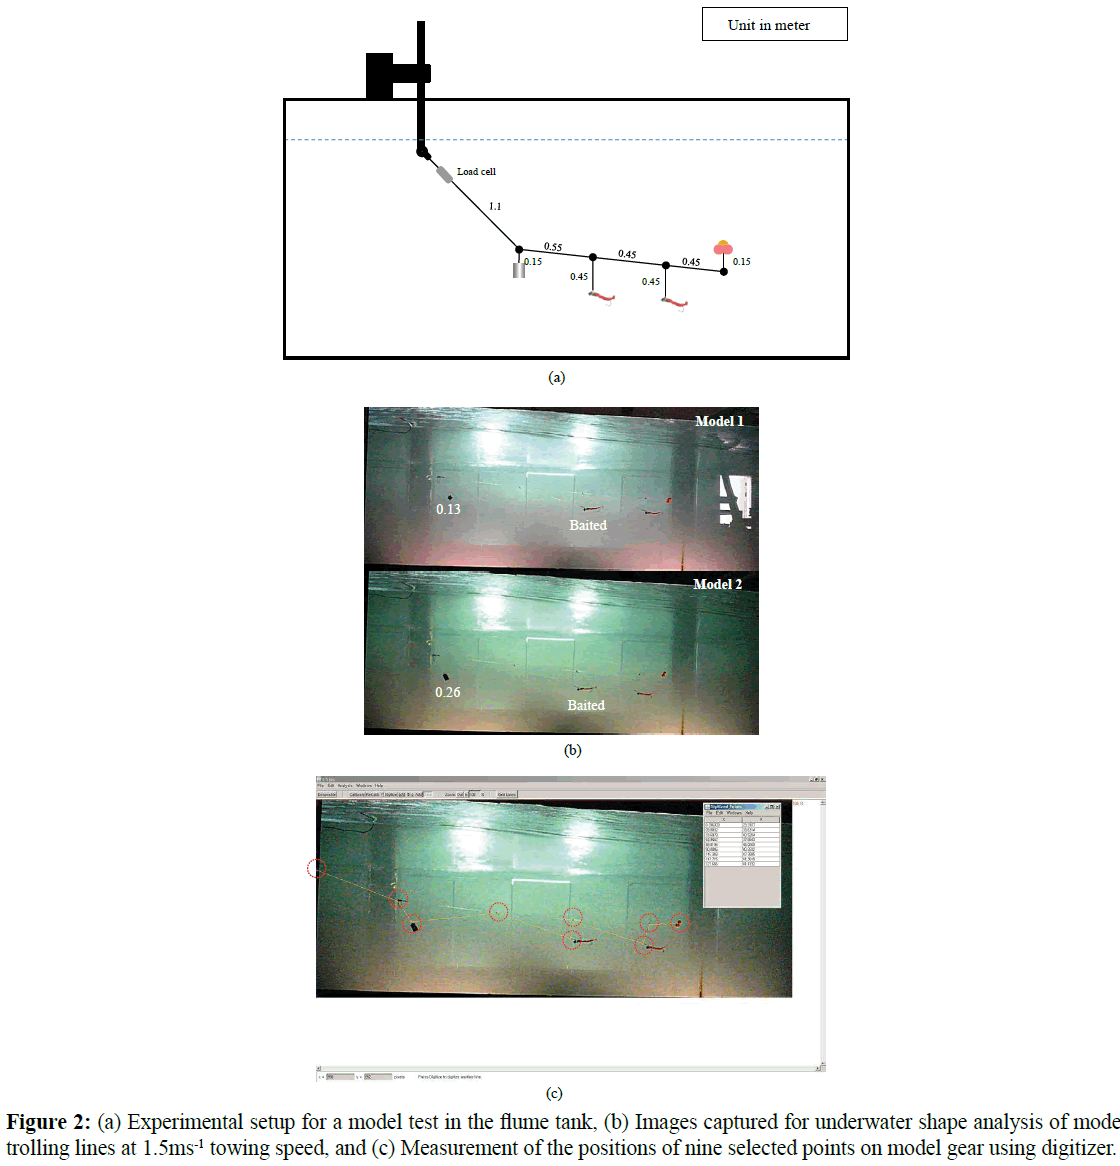
Figure 2: (a) Experimental setup for a model test in the flume tank, (b) Images captured for underwater shape analysis of model trolling lines at 1.5 ms-1 towing speed, and (c) Measurement of the positions of nine selected points on model gear using digitizer.
| Item |
Attributes |
Specification |
| Warp line |
Material |
PA monofilament (ρ = 1140 kg/m3) |
| Length (m) |
1.10 |
| Thickness (mm) |
1.13 |
| Mainline |
Material |
PA monofilament |
| Length (m) |
1.45 |
| Thickness (mm) |
1.13 |
| Branch line |
Material |
PA monofilament |
| Length (m) |
0.45 |
| Thickness (mm) |
0.58 |
| Quantity (EA) |
2 |
| Gap between branch lines (m) |
0.45 |
| Gap between first branch and sinker lines (m) |
0.55 |
| Sinker |
Material |
Steel (ρ = 7850 kg/m3) |
| Length (mm) |
280 and 470 |
| Thickness (mm) |
30 |
| Mass (kg) |
0.13& 0.26 |
| Sinker and Float lines |
Material |
PA monofilament |
| Length (m) |
0.15 |
| Thickness (mm) |
0.58 |
| Buoy |
Material |
Plastic material |
| Mass (kg) |
1.41 × 10⁻³ |
| Buoyancy (N) |
4.87 × 10⁻² |
| Quantity (EA) |
3 |
| Artificially baited hook |
Length (mm) |
128 |
| Mass (kg) |
2.48 × 10⁻² |
| Quantity (EA) |
3 |
Table 1: Detailed physical specifications for model gears.
Computational methods
Static analysis: In the past, a static method was proposed to determine the equilibrium configuration of a submerged rope system under a uniform current based on a non-linear finite element formulation (Wan et al., 2005). However, we made calculations based on a virtual work principle, whereby the motion of the gear system is dependent on the drag and weight in water of the system. All virtual work was done by the external forces, and coupled moments acting on the system or subunits were considered to be zero for any virtual displacements (Hibbeler, 2001). As shown in Figure 3, a rope segment was considered a subsystem moving at a specific velocity when the vessel is in motion. Under equilibrium condition, three forces govern its underwater shape and position in space. The net sinking force or weight in water of the segment has a positive magnitude for sinking objects and a negative for floating objects. Drag force is a function of towing speed, and the tensile force depends on the physical properties of the rope material, which has an equivalent magnitude but opposite in direction to the resultant force of drag and sinking forces.
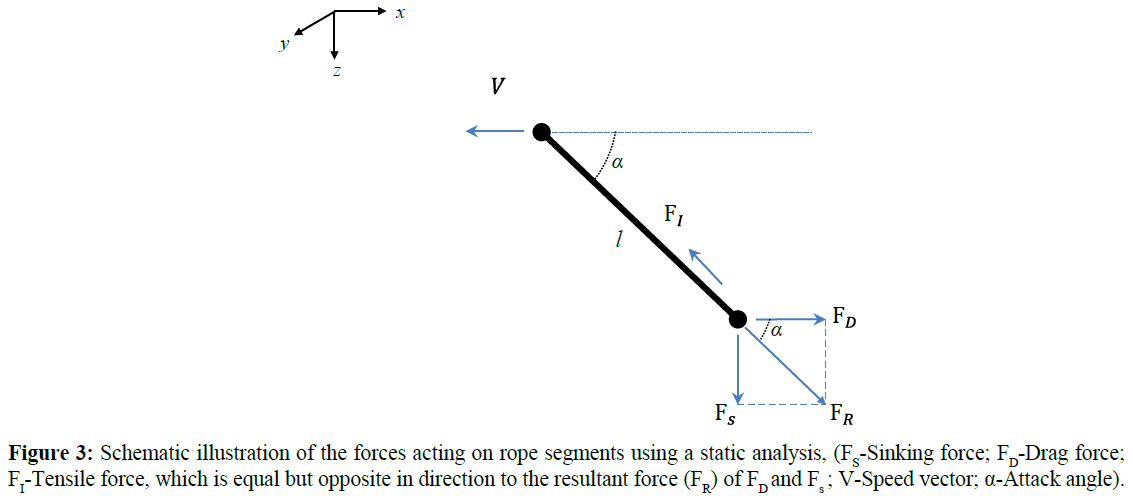
Figure 3: Schematic illustration of the forces acting on rope segments using a static analysis, (FS-Sinking force; FD-Drag force; FI-Tensile force, which is equal but opposite in direction to the resultant force (FR) of FD and Fs ; V-Speed vector; α-Attack angle).
Several assumptions were used in our static analysis method. (1) Each rope between two adjacent ties, or each line with bottom rigging, is represented by a single mass point having the same physical properties. (2) Each mass point was connected to each other by a virtual-extensible massless string. (3) The crosssectional area of a string remains the same after deformation. (4) The rope considered extensible under the action of current force. (5) The working gear configuration is dependent only on the drag, sinking force, and tensile force on the string. From these internal (tensile force) and external forces (drag and sinking forces), the attack angle (α) is related tangentially as the ratio of the weight in water of the system to drag, expressed mathematically as
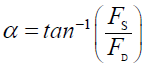 (2)
(2)
Where FD is the drag force, and FS is the weight of the system in water.
According to Lee et al. (2008), the tensile force on the string is related to the elasticity properties of the rope system as
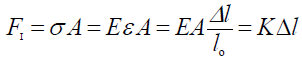 (3)
(3)
Where σ is the stress, ɛ is the strain, E is the elastic modulus, A is the cross-sectional area, K is the stiffness, lo is the initial length before deformation, and l is the length after deformation of the rope.
At a constant trolling speed, the model gears achieve an equilibrium configuration. According to Newton’s first law of equilibrium, the resultant of the drag and sinking forces is equivalent to the tensile force, expressed as
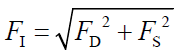 (4)
(4)
The equation to determine the length (l) of the rope after deformation is expressed as
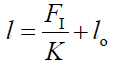 (5)
(5)
The hairtail trolling line depth, for example the depth of the base of the warp line, can represent the minimum hook depth achieved under any operational conditions and can be calculated as
Depth = l sinα (6)
Where lo is the initial length of the towing warp line, K is the stiffness of the towing warp line, and α is the angle of attack as in Equation (6). Similarly, the horizontal displacement of the warp line from the vessel is expressed as:
Horizontal Displacement = l cosα (7)
Similarly, each rope is considered as a line segment, whereby the external forces acting on it depend on the drag force on the system, its weight in the water, and internal force or tensile strength resulted due to elongation of the rope material when external load act on it.
According to Tsukrov et al. 2003, whether a small or large number of virtual elements is considered to represent each section of the gear elements for computation does not significantly affect the prediction of the hydrodynamic loads on the gear system. For this reason, and to reduce the computation time for the underwater shapes of the full-scale trolling line, we divided each gear section into the largest possible size of virtual elements. The towing warp line was divided into six equal elements. Similarly, for the mainline, the first section between the warp line and first branch line was represented by a 9.8 m long element; the remaining sections, such as the branch and floats lines, was each 4.5 m long, and the sinker line was 5 m long. Considering the tensile and sinking forces acting on each element, the underwater gear shape and position in space were calculated in an equilibrium state.
Mass-spring modeling method: Because a hairtail trolling line is large and composed of complex structures, numerical methods such as mass-spring modeling, which we consider here, are important for visualizing the dynamic underwater shapes of the gear and the spatial positions of gear elements in real time and also for designing and improving gear systems. In mass-spring modeling (Lee et al., 2008), line elements, including the towing warp line, mainline, branch lines, sinker line, and float line, are considered as flexible structures, whereas floats, sinkers, and hooks are considered as rigid structures. Flexible structures are segmented into discrete elements and represented by mass points connected by a massless spring. Rigid structures are considered as mass points. Each mass point has the same physical properties as the real gear element it represents. External forces are categorized into dynamic and static forces. The dynamic forces are drag and lift forces, whereas the static forces are gravitational and buoyancy forces that depend on the physical properties of the gear elements. Additionally, internal forces arise due to the elastic nature of the rope structures. The sum of the external and internal forces governs the dynamic working shape and spatial position of each mass point. Based on the modeling technique above, simulations were run, and the 3D shapes of the gear systems, tensions, and lengths of the gear elements were displayed using graphics tools in real time. The computation methods for both the internal and external forces acting on the trolling line system are described below.
Internal force: This is the tensile force (Fint) or spring force acting on mass points by the massless springs that connect adjacent mass points. According to Hook’s law, the extent of spring compression or elongation depends linearly on the action of the force. This is expressed as:
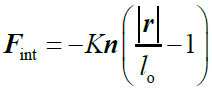 (8)
(8)
The stiffness of rope material (K) can be determined by:
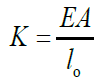 (9)
(9)
Where E is Young’s modulus, A is the effective cross-sectional area, and lo is the initial length of the segment. The effective modulus of the elasticity of braided or twisted rope was assumed to be 0.6-fold the modulus of a monofilament of the same material and cross sectional area (Gere, 2011).
External force: This encompasses the water drag force (FD), lift force (FL), and Sinking force (FS) which is the resultant of buoyancy and gravitational forces, as illustrated in Figure 4. The total external force acting on the mass points of the gear system can be determined by:
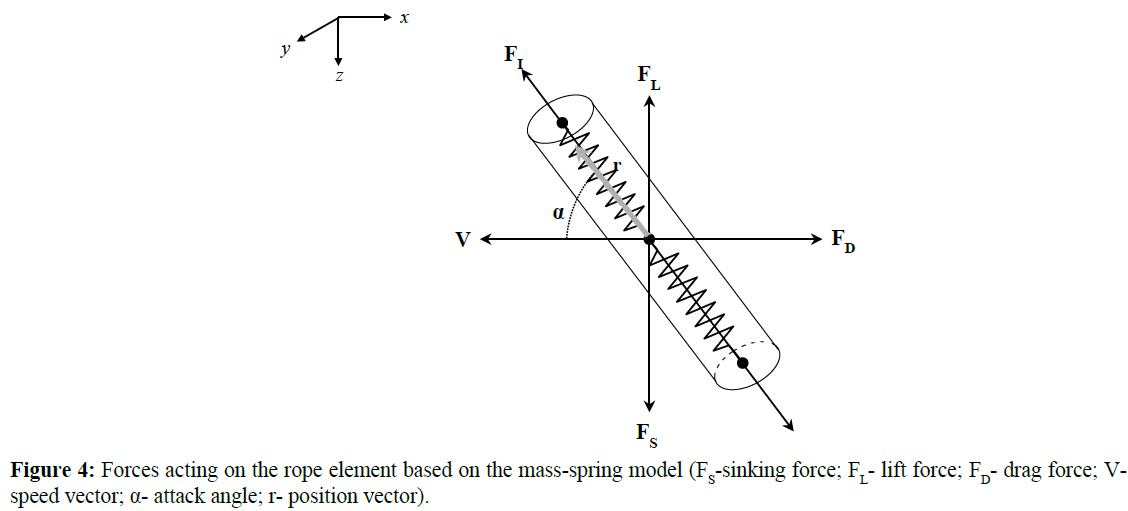
Figure 4: Forces acting on the rope element based on the mass-spring model (FS-sinking force; FL- lift force; FD- drag force; Vspeed vector; α- attack angle; r- position vector).
Fext = FD + FL + FS (10)
The deployment speed of the vessel and trolling speed are assumed to be uniform. Thus, the inertial force is ignored. The drag and lift forces are represented as:
 (11)
(11)
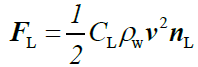 (12)
(12)
Where CD and CL are the coefficients of the drag and lift forces respectively, ρw is the density of the water, and S is the projected area of the mass point. V is the relative trolling velocity vector, defined as:
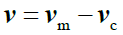 (13)
(13)
Where Vm is the velocity mass point, and Vc is the current velocity. nL is the unit vector of the lift force, and its direction is determined by
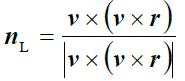 (14)
(14)
where r is the position vector of the element. The sinking force (FS) as a resultant of the buoyancy and sinking forces can be represented as follows:
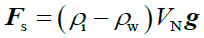 (15)
(15)
Where ρi is the density of the material, VN is the volume of the material, and g is the gravitational acceleration.
In the present study, the ropes used as the towing rope, mainline, and branch lines were considered to have cylindrical shapes and were divided into a finite number of elements. Thus, the volume (VN) can be calculated as
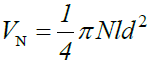 (16)
(16)
Where N is the total number of bars on the specific line, l is the length, and d is the thickness of the bar.
Method for solving the dynamic motion of the gear system: Summing the total forces governing the motion of the line gear system, the second ODE (Order Differential Equation) of a finite linear system was derived to estimate the underwater shapes of the trolling line components. However, the second ODE was too rigid to allow identifying a numerical solution directly. Thus, we transformed the second ODE into a first ODE to solve the equation of the motion, i.e., the equation of the motion expressed in terms of variable velocity as
 (17)
(17)
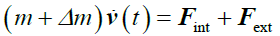 (18)
(18)
Where m is the mass of the element, and Δm is the added mass. Ultimately, the velocity for each mass point was determined using the fourth-order Runge-Kutta method; the 3D position vectors were determined by integrating Equation (18).
Modeling the trolling line using a mass-spring technique: Prior to verification of the mass-spring modeling technique, a virtual gear was designed as a model. The towing warp line was 1.1 m long, divided into five equal elements; the mainline section between the sinker line and first branch was 0.55 m long, divided into three elements, and the remaining two sections of the mainline, each 0.45 m long, were divided into three equal elements. The sinker and float lines of identical sizes were divided into three equal elements. Weight sinkers, buoys, and hooks as rigid components were considered as mass points. Virtual model gears for fishing conditions were subjected to the same conditions as those of the experimental setups. Several simulations were run for two model gear systems at towing speeds of 1.2-1.5 ms-1 at intervals of 0.1 ms-1.
Furthermore, a virtual full-scale gear was also designed based on current Korean hairtail trolling line. Its main structures were the towing warp line, mainline, branch line, sinkers, and buoys. Figure 5 shows the actual gear and a corresponding virtual gear representation using mass-spring modeling. There were 82 branches with an artificially baited hook, which have the same properties as those described earlier for the test model, with an interval of 4.5 m, and three identical pairs of buoys used with a net buoyancy of 0.12 kg each. The towing warp line consisted of steel wire rope with small elliptical leads, which were scattered along the wire rope at intervals of 0.35 m; each had a projected area of 4.29×10 m2 and a weight of 4.19×10 kg in water. A detailed physical specification and calculated data used as inputs for the simulation are listed in Table 2. Using mass-spring modeling, the 120 m towing warp line, as a flexible structure, was dissected into equal elements of 20 m each. The branch and float lines were divided in the same way into three elements; each virtual element was 1.5 m long. The first section between the sinker line and the first branch of a 383.3 m long mainline was divided into three elements, each 3.27 m long, and the remaining rope was divided into equal elements of 1.5 m each. The sinker line was divided into four elements of 1.25 m each. The rigid structures - the artificially baited hook, sinker, and buoys - were considered as mass points. Several simulation tests for the full-scale trolling line model were performed to help understand the dynamic shape of the trolling line at towing speeds of 0.5 to 1.5 ms-1.
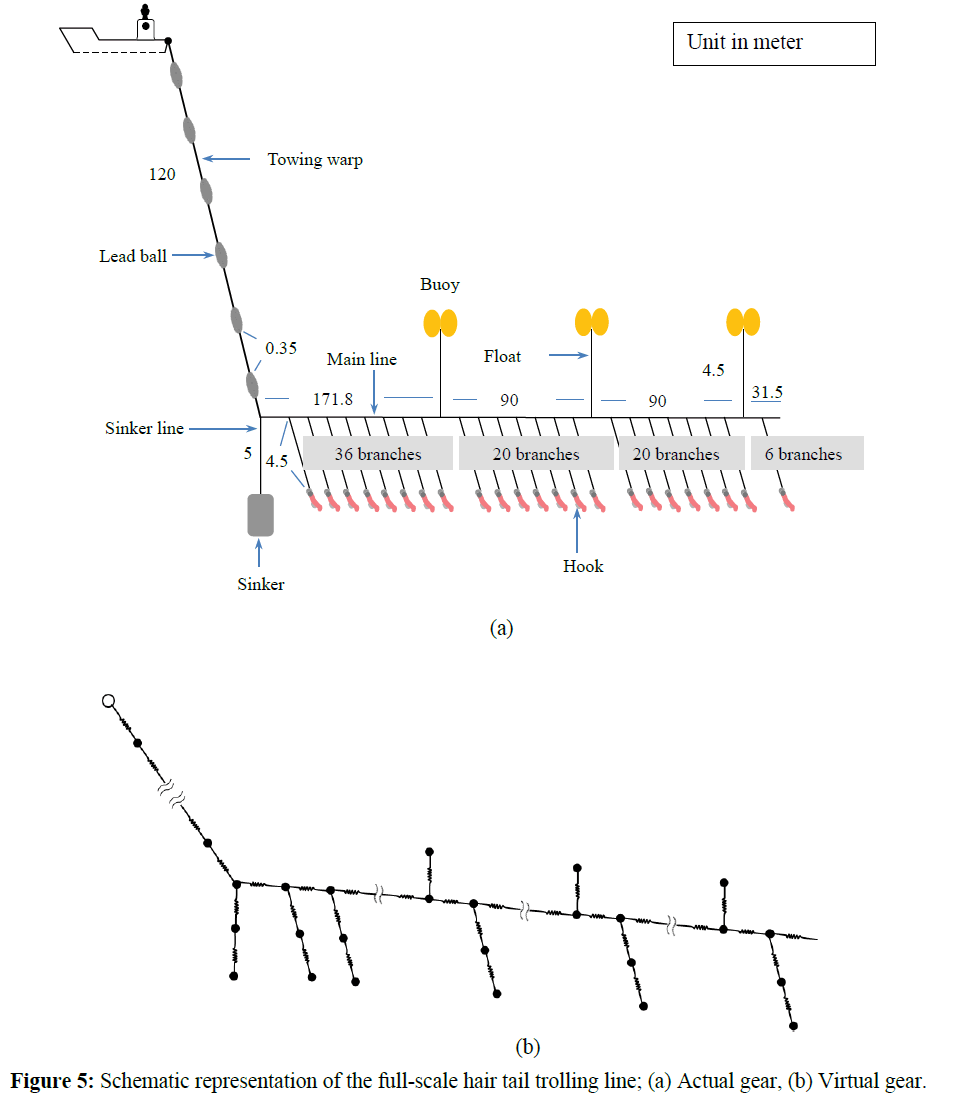
Figure 5: Schematic representation of the full-scale hair tail trolling line; (a) Actual gear, (b) Virtual gear.
| Items |
Materials |
Weight in water, kgf |
Total length, (m) |
Number of mass points |
Projected area(m2) |
Yong modulus, GPa (1×10⁹ N/m2) |
Cross sectional area (m2) |
Segment length(m) |
Stiffness, (kN/m) |
| Towing Warp line |
Stainless Steel |
5.18 |
120.0 |
17 |
4.65 x10⁻¹ |
210 |
1.89 x10⁻⁵ |
20.00 |
211.23 |
| Mainline |
PES |
4.42x10⁻² |
383. |
172 |
4.33 x10⁻¹ |
3.2 |
1.00 x10⁻⁵ |
2.25 |
21.38 |
| Branch line |
PA |
1.37x10⁻⁴ |
4.5 |
4 |
2.61 x10⁻³ |
3.2 |
2.64 x10⁻⁶ |
1.50 |
5.63 |
| Sinker line |
PES |
3.58 x10⁻² |
5.0 |
5 |
2.50x10⁻² |
4.41 |
1.96 x10⁻⁴ |
1.25 |
692.37 |
| Float line |
PA |
1.37 x10⁻⁴ |
4.5 |
5 |
2.61 x10⁻³ |
3.2 |
2.64 x10⁻⁶ |
1.50 |
5.63 |
| Sinker |
Steel |
1.2 x101 |
- |
- |
9.00 x10⁻³ |
- |
- |
- |
- |
| Buoy |
Plastic |
-1.20 x10⁻¹ |
- |
- |
4.12 x10⁻³ |
- |
- |
- |
- |
| Baited Hook |
Plastic
|
2.48 x10⁻² |
- |
- |
1.28 x10⁻³ |
- |
- |
- |
- |
| Lead ball |
Lead |
3.73 x10⁻² |
- |
- |
4.51 x10⁻³ |
- |
- |
- |
- |
Table 2: Physical and virtual specifications of hairtail trolling line used for mass-spring modeling.
In the simulation program, the actual fishing conditions, fishing vessel, and hairtail trolling gear were created in the design workspace, and then the virtual fishing operation progressed in the simulation workspace. In this test, we investigated the effects of two factors (towing speed and sinker weight) that govern the fishing depth of the gear. Towing speeds ranging from 0.5 to 1.5 ms-1 at intervals of 0.1 ms-1 were used in the simulation. To evaluate the effect of a sinker weight, four prototype trolling lines were virtually constructed in the design mode by coding, differing only by sinker weight: 6, 9, 12, and 15 kg sinkers. Furthermore, the effects of tidal current on the underwater performance of the trolling line were also investigated. The working shape of the prototype in space was calculated by the fourth-order Runge-Kutta method at a time step of 2×10⁻⁴ s to reduce the computation time. The 3D positions of the mass points representing the full-scale gear system were simulated at intervals of 10s and completed within 4000s (Figure 6). In the transition states and the first stage of the shooting, the gear depth was variable. A stable gear shape and gear depth profile were obtained between 2500 and 4000s.
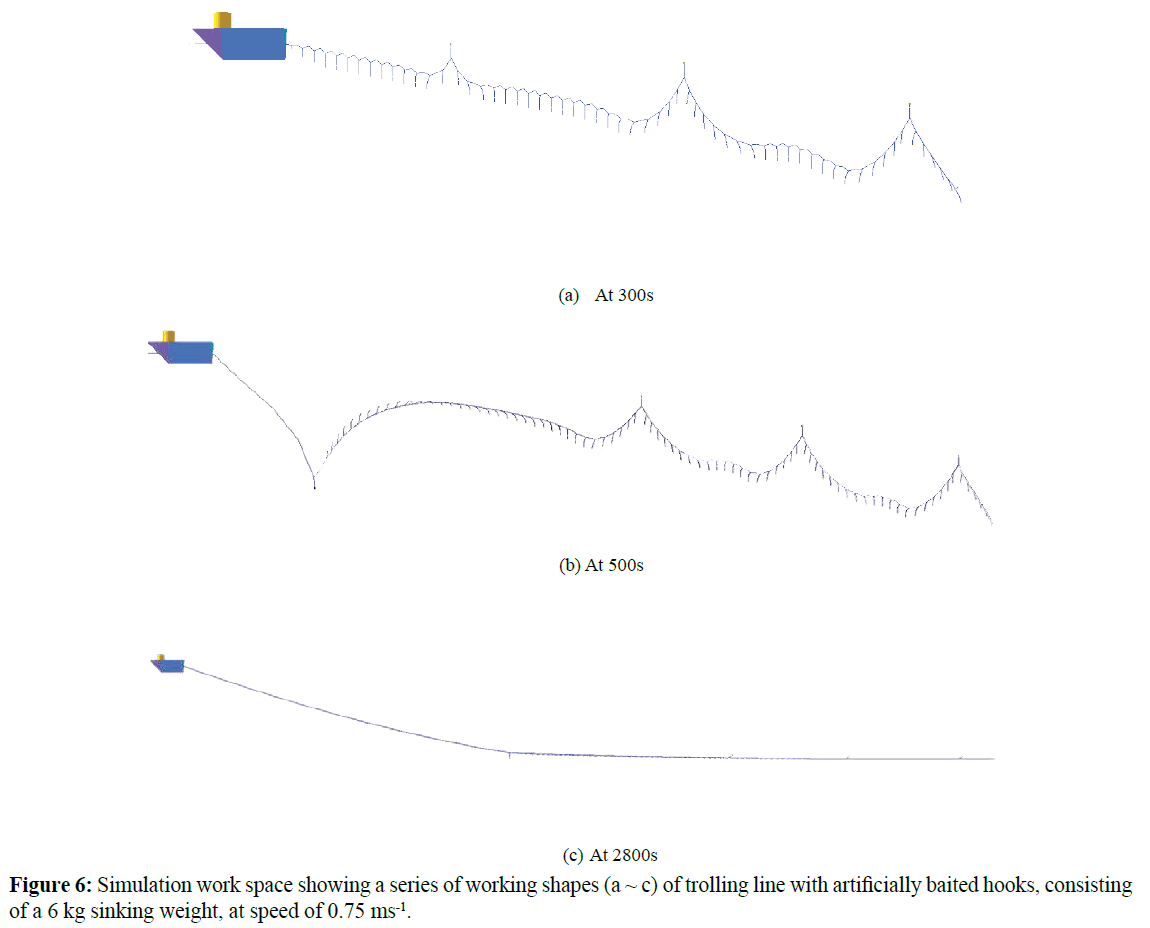
Figure 6: Simulation work space showing a series of working shapes (a ~ c) of trolling line with artificially baited hooks, consisting of a 6 kg sinking weight, at speed of 0.75 ms-1.
Results
Determination of the drag coefficient for the gear elements
The drag coefficients of the gear elements were obtained from the experimental observations and from published data. The towing warp line, mainline, branch line, float line, and sinker line were considered as line elements of the fishing gear. All were assumed to have the same drag coefficients. Because the line elements are flexible, their shapes are affected significantly by the actions of external forces. The drag coefficient of the line elements varies according to the attack angle. The attack angle (α) changes with the towing speed. With an increase in attack angle, the drag coefficient increased and reached a maximum at a 90° attack angle (Lee et al., 2008). In our numerical analyses, the drag coefficient for line elements varied with the attack angle, as proposed by Matsuda (2001):
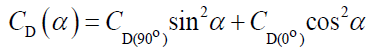 (19)
(19)
Where CD(0°) is the drag coefficient at a 0° attack angle, and CD(90°) is coefficient). According to Cao et al. (2014), the normal drag coefficient of a monofilament is 1.08-1.14.
For rigid bodies such as the sinker, float, and hooks, the attack angle is more or less the same under any condition. Thus, under all variable conditions, constant normal drag coefficients were used in our computations for all rigid components. The drag coefficient for a sinker having a smooth cylindrical shape was considered to be 1.18 at Reynolds numbers of 1.0×10⁵ to 5.0×10⁵, according to Hoerner (1965). The drag coefficient for a spherical buoy, which was used in the models, was 0.47, while that for the elliptical buoy used in the full-scale model, with a 1.5 width-to-thickness ratio, was estimated to be 0.78 at Reynolds numbers of 1.0×10⁵ to 5.0×10⁵. For an artificially baited hook, the drag coefficient (shape coefficient) was determined using the derived general drag equation from the resistance forces measured in the flume tank. An artificially baited hook setup was subjected to a series of water currents of 0.5 to 1.5 ms-1 at intervals of 0.1 ms-1. As shown in Figure 7, the relationship between the drag coefficients varied with the current speed. The drag coefficient of the hooks showed a slight decrease with increasing current speed. Using linear regression analysis, the line that best fit this trend was obtained and subsequently used for the numerical analysis:
Cv = −0.088v + 0.235
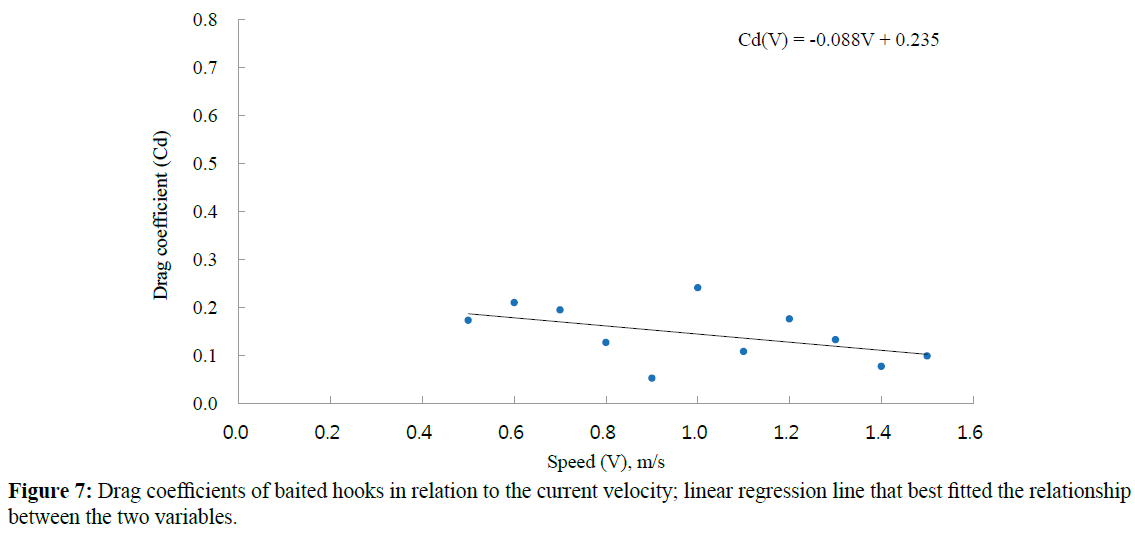
Figure 7: Drag coefficients of baited hooks in relation to the current velocity; linear regression line that best fitted the relationship between the two variables.
Where V is the magnitude of current speed. This equation was used to estimate drag coefficients at different towing speeds in both static and numerical methods.
Experimental results for various test models
The working shapes, positions in space, and lengths of the gear elements in the models under equilibrium condition were analyzed using an image digitizer. The vectorial positions of selected points (nine selected points on the gear system that could represent the real shape of the gear system under any condition) in the image were converted into ‘xz’ Cartesian coordinates, with the x-axis showing the horizontal displacement and the z-axis the depth (Figure 2c). The main objectives of this experiment were to investigate how the two important factors-the working shape and position in space - were affected by the size of the sinker and the towing speed. Furthermore, to confirm the numerical methods, Figure 8 shows physical measurements of the shapes and positions in two model gear elements when trolled at different speeds. As the towing speed increased, the gear moved to a shallower position. Of the two models based on different sinker weights, model 2 with a 0.26 kg sinker reached a deeper position at each towing speed. Regardless of the sinker weight used, the deflection angle measured between the fore and hind branches for models 1 and 2 was insignificant: the calculated mean deviations were only 0.75% and 0.41%, respectively, at towing speeds of 1.2 to 1.5 ms-1. This may be because the working shapes of the branch lines do not depend on the weight of the sinker used, but rather on the physical properties of the hook and branch line and on the towing speed. However, their position in space also depends on the physical properties of the rigged sinker size and remaining parts of the gear. In these experiments, the shape and position of the gear as a system was affected by the sinker weight and towing speed.
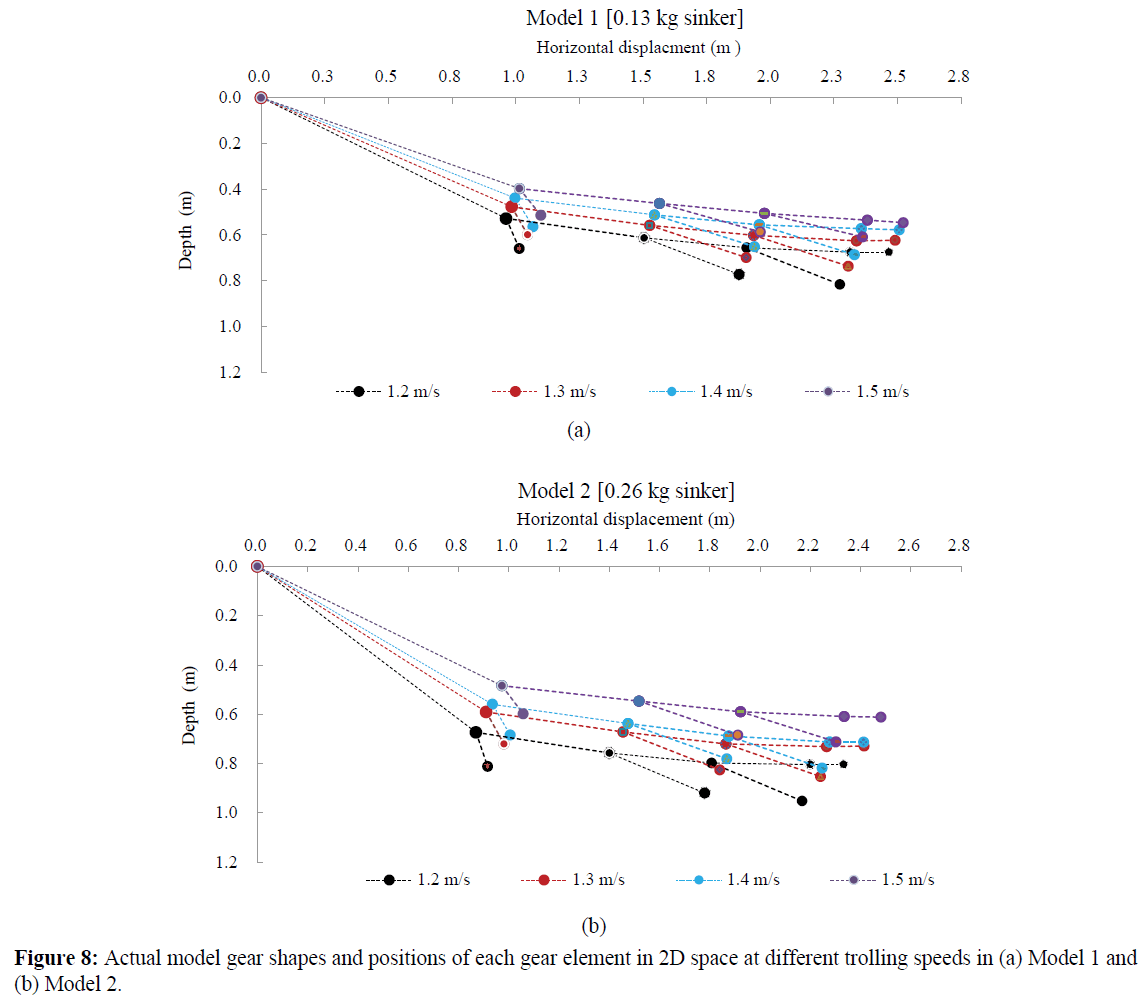
Figure 8: Actual model gear shapes and positions of each gear element in 2D space at different trolling speeds in (a) Model 1 and (b) Model 2.
Figure 9 shows the change in drag of the models with the change in towing speed. The drags or resistance forces on the gear systems were measured using a load cell. The faster the towing speeds, the more the drag increased. The flexible structures of the gear system responded strongly to minimize drag (reduce the attack angle) via stretching in the mainline and branch lines, with the hook aligning more in parallel with the mainline, and via an increase in the deflection angle or decrease in the attack angle (the sum of the deflection and attack angles is 90°) of the towing warp line. However, the model rigged with the heavier sinker had a 5.1×10‑4 m2 extra projected area and 0.13 kg extra mass added to the system that resulted in a stronger resistance force. Moreover, model 2 rigged with the 0.26 kg sinker showed higher attack angles at various towing speeds due to the heavier sinker but more to the increase in sinking force than any increase in drag due to its larger projected area and attack angle. In such a scenario, with a large attack angle, a higher drag coefficient was adopted for the numerical computations using Equation 19.
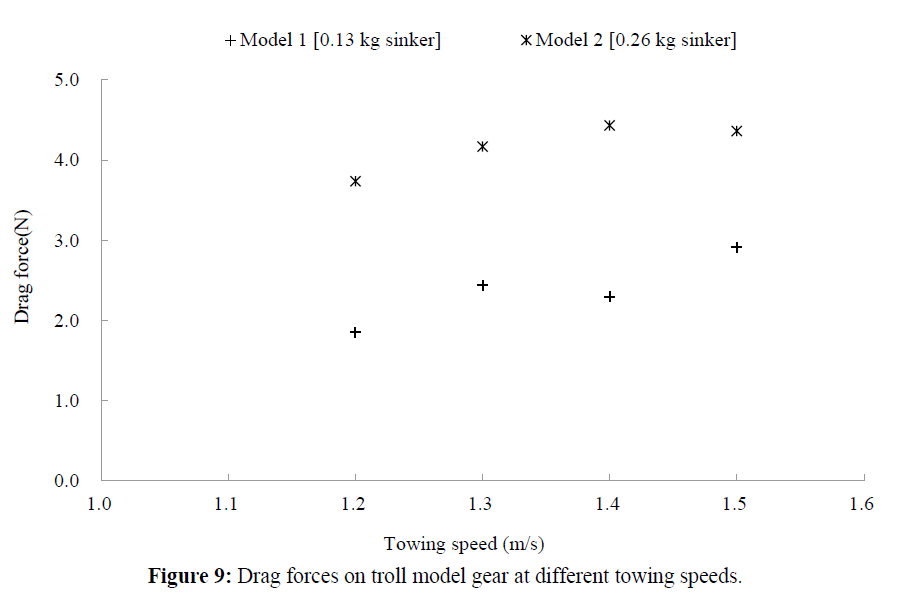
Figure 9: Drag forces on troll model gear at different towing speeds.
Numerical analyses for model tests
Modeling for small-scale trolling lines using the two numerical approaches was performed to evaluate and confirm the calculation methods by comparing the calculated data with measured data. The static analysis was performed to estimate the equilibrium configuration of the gear elements, whereas the simulation in the dynamic approach predicts the behavior and positions in space of the mass points in real time. For the static analysis, first, each model gear was divided into eight mass points, virtually representing each line element with its riggings. They have equivalent masses and projected areas as rope segments with rigging. The motion in space depended on rope tensile, sinking, and drag forces. For simulation using mass -spring modeling, flexible structures, such as the towing warp line, mainline, branch lines, float line, and sinker line, were represented as massless spring connected to the mass points, while other elements such as sinkers, hooks, and buoys were treated as mass points in the models. The equations for motion of the virtual trolling lines in space are dependent on all hydrodynamic and hydrostatic forces. Figure 10 indicates the shapes of the trolling line models, measured physically using the image digitizer and compared with the corresponding calculated shapes determined by the static analysis method and mass -spring modeling. The bold gray lines indicate the observed shapes of the models, the blue-dashed lines indicate mass-spring predictions, and the red-dashed lines indicate static predictions. From visual observations, close agreement between the estimated and measured data was seen. However, the discrepancies between the static and measured data were higher than those between the mass-spring and measured data. This may be because the lift force was ignored in the static analysis.
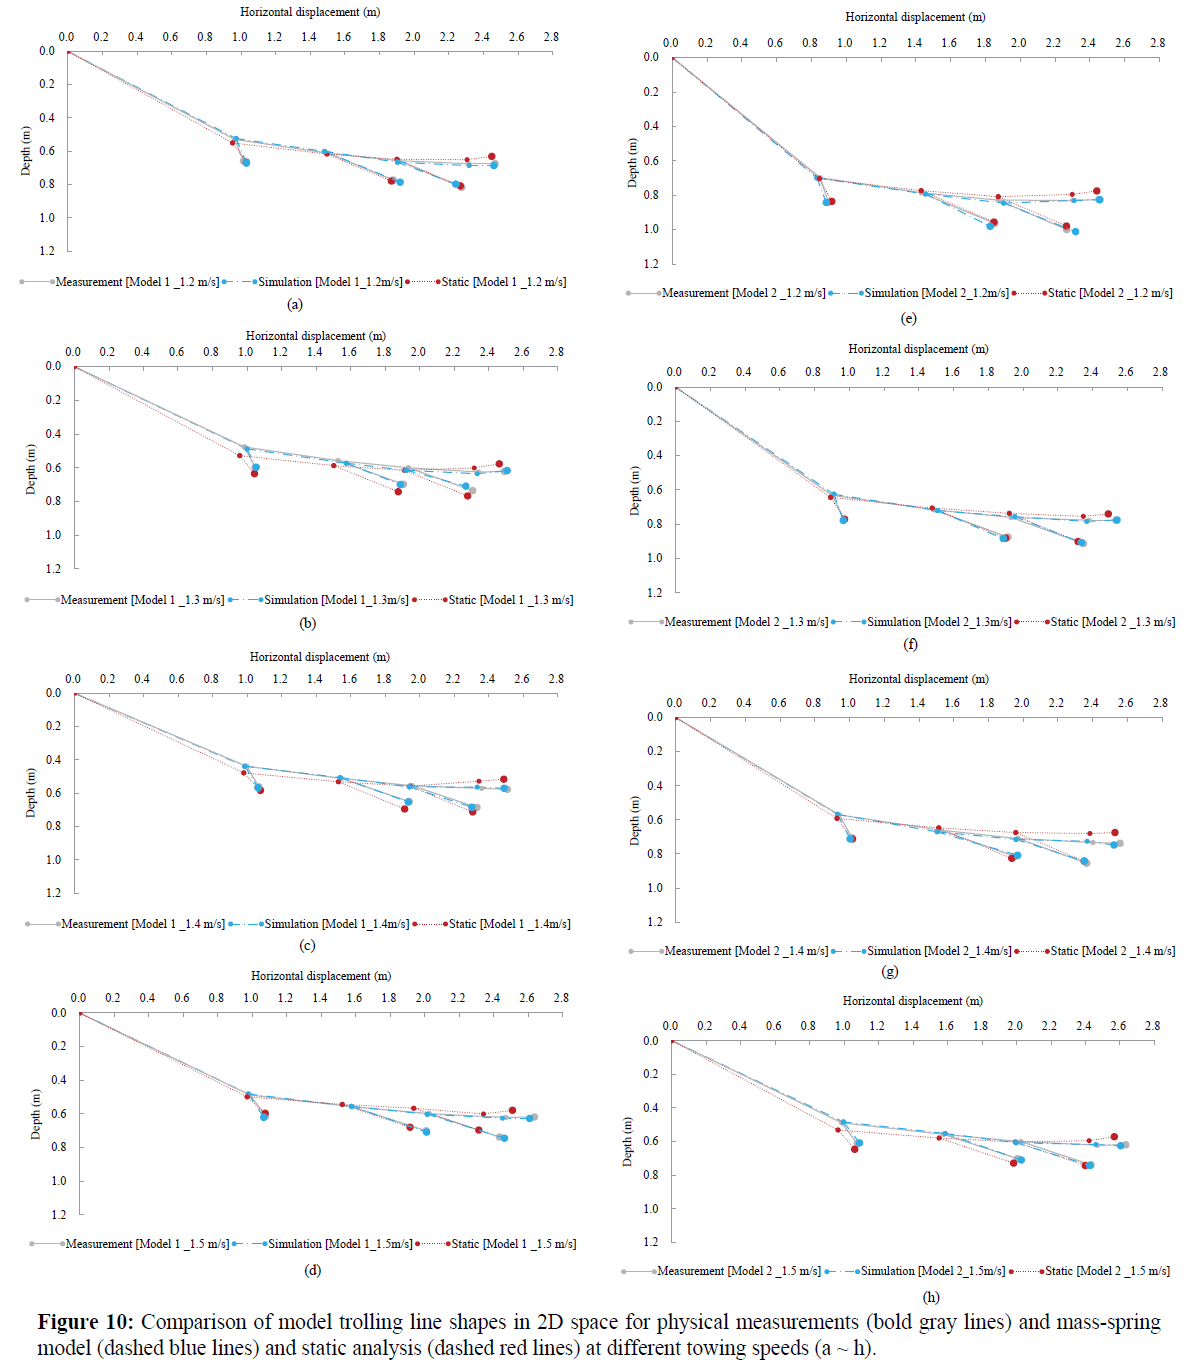
Figure 10:Comparison of model trolling line shapes in 2D space for physical measurements (bold gray lines) and mass-spring model(dashed blue lines) and static analysis (dashed red lines) at different towing speeds (a~h).
Accuracy test of the numerical approaches
To evaluate the accuracy of the numerical methods, we compared the measured and calculated warp line lengths, attack angles of the warp line, hook depths, and buoy depths after the model trolling lines reached a stable configuration at a specific speed. At towing speeds of 1.2 to 1.5 ms-1, five samples (n=4) were collected for each considered parameter, and triplet data – measured, massspring, and static analyses - were considered in time comparisons. Table 3 shows the mean deviations and percentage errors of measured values for each parameter in each model. For model 1, the percentage error for the warp line length prediction was ±1.11% for mass-spring modeling and ±1.21% for the static analysis. Similarly, for model 2, the percentage error for predicting hook depth was ±2.59% for mass-spring modeling and ±4.88% for the static method. Overall, the differences between the predicted parameters and actual parameters were insignificant (<±5%). Thus, mass-spring modeling is sufficiently accurate for predicting the dynamic shape of trolling line in space and time. Additionally, the static analysis was a good predictor of hook depth.
| Mean deviation with percentage error |
| Model 1 (n = 4) |
Dynamic (mass-spring) |
Static |
| |
Warp length |
1.10E-02 m ±1.11% |
1.19E-02 m ±1.21% |
| |
Attack angle on warp |
2.09° ± 1.13% |
4.67° ± 2.63% |
| |
Hook depth |
1.17E-02 m ± 2.55% |
2.07E-02 m ± 4.74% |
| |
Buoy depth |
6.61E-02 m ± 0.91% |
3.79E-02 m ± 5.42% |
| Mean deviation with percentage error |
| Model 2 (n = 4) |
Dynamic (mass-spring) |
Static |
| |
Warp length |
6.52E-03 m ± 0.59% |
9.41E-03 m ± 0.85% |
| |
Attack angle on warp |
1.81° ± 0.77% |
5.57° ± 2.49% |
| |
Hook depth |
5.54E-03 m ± 2.59% |
1.02E-02 m ± 4.88% |
| |
Buoy depth |
4.80E-03 m ± 0.62% |
3.52E-02 m ± 4.53% |
Table 3: Accuracy test results for numerical methods at towing speeds of 1.2 to 1.5 m/s.
Numerical analysis of the full-scale gear
Static method to predict the shape of the trolling line: Because the values calculated by the static method and the measured values at an equilibrium configuration showed close agreement, this method could also be used for the prediction of the full-scale trolling line performance under zero tidal current conditions. The full-scale hairtail trolling line, which consisted of artificially baited hooks and 12 kg sinker weights, was analyzed at different towing speeds, ranging from 0.5 to 1.5 ms-1 at an interval of 0.1 ms-1 with no current. The computed positions of the fullscale gear in two-dimensional (2D) space and the underwater shapes at various trolling speeds are shown in Figure 11. The trolling line with a 12 kg sinker showed a decreasing gear depth and attack angle with increased towing speeds, as seen in previous model tests. At 1 ms-1, the underwater depth of the warp line, which is 120 m long, was predicted to be 59.81 m. This is the most suitable position for hairtail fishing near the coast of Jeju, Korea, where the target water depth is 50-70 m.
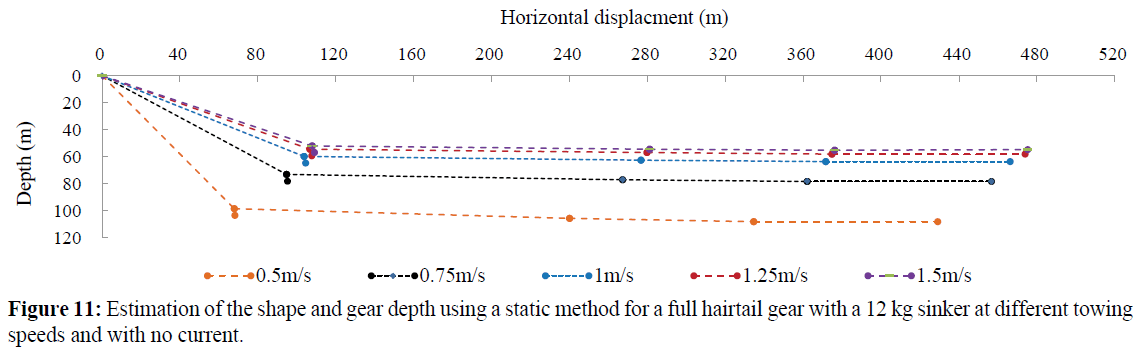
Figure 11: Estimation of the shape and gear depth using a static method for a full hairtail gear with a 12 kg sinker at different towing speeds and with no current.
Mass-spring modeling to predict trolling line shape: To investigate the underwater performances of the full-scale hairtail trolling line under different fishing conditions, we ran simulation trials using a mass-spring modeling technique for the complex structure of the full-scale trolling line, which is used to catch hairtail at water depths of 50-70 m. Additionally, the seabed at the operation site was 80 m deep.
Effect of towing speed on the underwater behavior of the trolling line: Figure 12 shows a simulation result for gear shapes in 2D space in relation to the towing speed for the hairtail trolling line when rigged with a 12 kg sinker with no current. The faster the towing speed, the shallower the depth of the gear elements reached at the same time, extending the horizontal displacement due to the elevated drag force. The gear achieved a mean hook depth of 65.3 m at a towing speed of 1 ms-1, while at 0.75 ms-1, the mean hook depth reached 72.14 m. At a speed of 0.5 ms-1, the gear reached the seafloor, at a calculated mean hook depth of 100.3 m. In a real fishing environment, this is a serious situation, and therefore the operator needs to control the hook depth by decreasing the warp line length, using a lighter sinker weight, or by elevating the trolling speed. Of all the towing speeds evaluated, the gear showed the most uniform vertical hook distribution at 1 ms-1 (standard deviation = 0.23 m). In contrast, at 0.75 ms-1, the hook depth was highly variable, with a standard deviation of 6.5 m. Altering the towing speed is a potential strategy to control hook depth; however, this has limitations because the towing speed range should be less than the swimming speed of the target species.
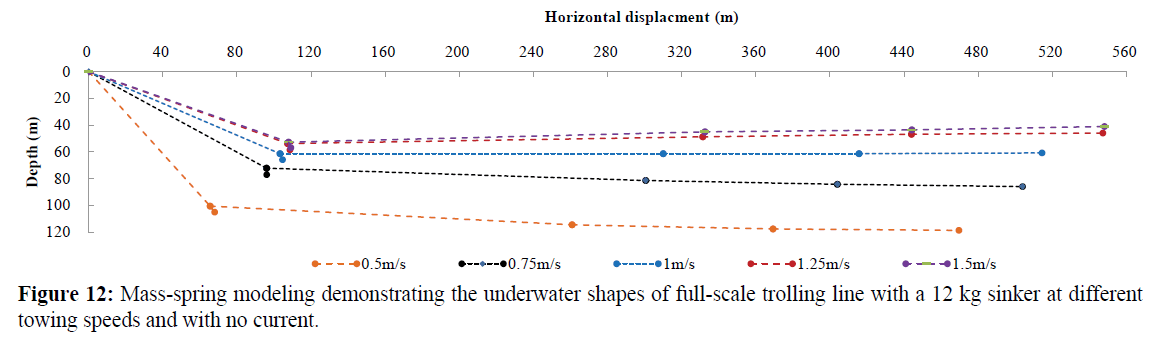
Figure 12: Mass-spring modeling demonstrating the underwater shapes of full-scale trolling line with a 12 kg sinker at different towing speeds and with no current.
Effect of the sinker weight on the underwater behavior of the trolling line: Figure 13 shows the effect of sinker size on gear shape when trolled at a 1 ms-1 towing speed with no current; the gear depth changes with the weight of the sinker. A trolling line rigged with a heavier sinker achieves a deeper position. A gear rigged with a 6 kg sinker attained a depth of 32 m, while the warp line rigged with a 15 kg sinker reached a water depth of 57 m. This suggests that the hook depth or shape of the trolling line can be controlled by using sinkers of various weights.
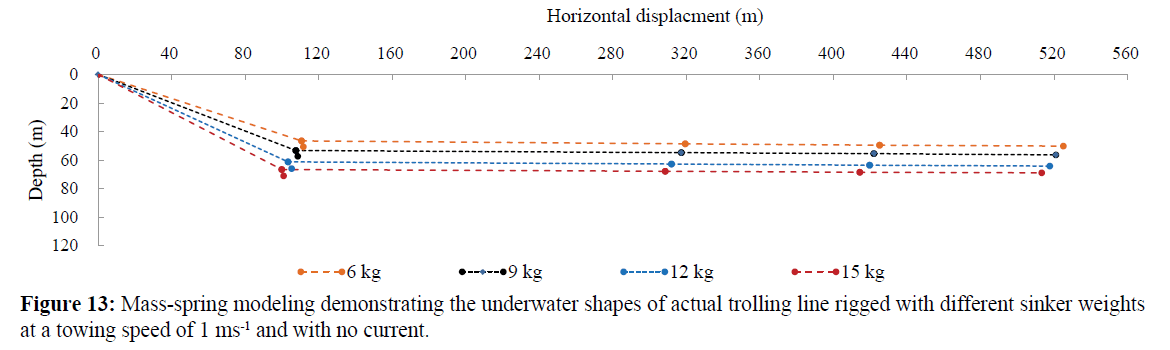
Figure 13: Mass-spring modeling demonstrating the underwater shapes of actual trolling line rigged with different sinker weights at a towing speed of 1 ms-1 and with no current.
Effect of current on the underwater behavior of the trolling line: To observe the effects of tidal currents on the underwater gear shape, a uniform 0.3 ms-1 current at 45° to the trolling direction was added to the simulation program while trolling the gear under the following scenarios: (1) when rigged with a 12 kg sinker at various speeds, ranging from 1.2 to 1.5 ms-1, at an interval of 0.1 ms-1 and (2) when trolled at a fixed 1 ms-1 speed and rigged with 6, 9, 12, or 15 kg sinker weights. As seen in Figure 14, with current, at different towing speeds, the trolling line responded in much the same way as seen in Figure 12 with no current; however, the hooks and other gear elements reached shallower depths due to the added drag force as a result of the current. For example, the depth of the warp line decreased by 8.7% at 1 ms-1 and by 15.85% at 0.75 ms-1. Similarly Figure 15, gears rigged with different sinker sizes and trolled at 1 ms-1 responded in the same way with current as with no current (Figure 13); however, the hooks and other gear elements reached shallower depths due to added drag force as a result of the current. For example, the warp line rigged with a 15 kg sinker lost 7.0% of its depth due to the current force (Table 4).
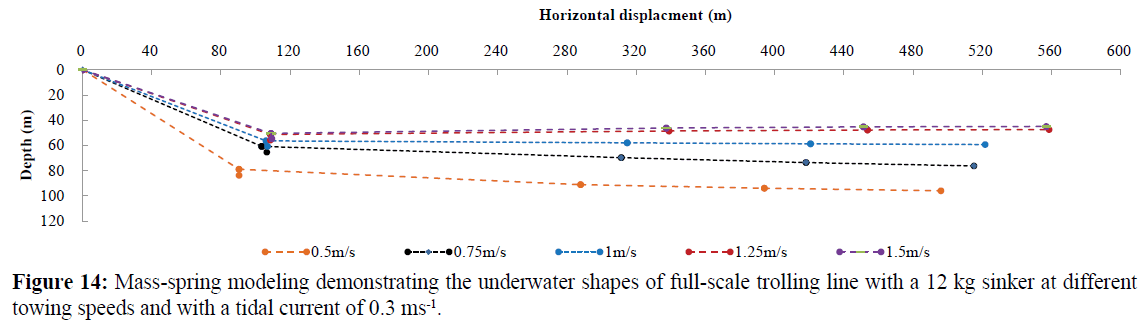
Figure 14: Mass-spring modeling demonstrating the underwater shapes of full-scale trolling line with a 12 kg sinker at different towing speeds and with a tidal current of 0.3 ms-1.
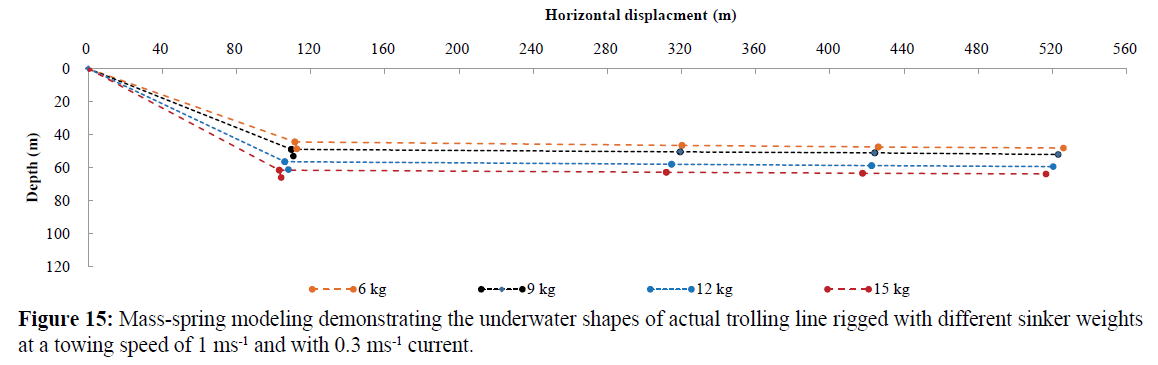
Figure 15: Mass-spring modeling demonstrating the underwater shapes of actual trolling line rigged with different sinker weights at a towing speed of 1 ms-1 and with 0.3 ms-1 current.
| Mass of sinker (kg) |
| Fishing conditions |
6 |
9 |
12 |
15 |
| Gear depth with no current (m) |
46.47 |
53.17 |
61.13 |
66.52 |
| Gear depth at 0.3 m/s current at 45°(m) |
44.49 |
48.90 |
56.38 |
61.54 |
Table 4: Calculated depths by simulation for trolling lines with no current and with 0.3 ms-1 tidal current.
Generally, the current speed and direction across water columns, sinker weight, and towing speeds have marked impacts on the underwater shape and hook depth; however, current is not a vital factor in preventing hooks of the line gear from achieving a desired fishing depth (Bigelow et al., 2006). Thus, it is important to record and document data on the influence of major factors affecting mean hook depth in field surveys. This helps significantly with selecting the appropriate sinker size and controlling the warp line, resulting in an effective fishing effort while avoiding by catches and any severe damage to the environment.
Discussion
The trend between drag coefficients and current speed indicates the drag coefficient decreases consistently with increasing current speed (Figure 7). Using regression analysis, a linear relationship was established between the drag coefficient for an artificially baited hook and current speed. The equation derived from the regression line was used in subsequent numerical computations.
Generally, the shape of the gear during operation, position, and steady state of fishing gear rely on the magnitude and direction of the external forces acting on the gear (Fridman and Carrothers, 1986). More precisely, the motion of gear systems is governed primarily by the drag and sinking forces. Horizontal displacement is due mainly to drag, whereas gear depth (vertical displacement) is due mainly to the sinking force of the gear; both forces are affected by the physical properties of the gear elements. According to Bach et al. (2006), the sinking behavior of long line in reaching a target depth depends on the physical properties of the gear components, such as whether the lines are mono- or multifilament lines, the weights of the line elements, presence of additional weights on rigid riggings, hook type, bait type, and fishing environment. The drag force is largely a function of speed, whereas the sinking force depends mainly on the weight of the sinker in water. Thus, by adjusting these two variables, towing speed and sinker weight, we can set the gear to achieve the desired water depth. Moreover, we have investigated the factors that influence the gear shape and vertical distribution of the hooks, including, sinker weight, towing speed, and length of the warp line. According to physical experiments in the flume tank, the shape of the gear was affected by the towing speed and sinker size. With an increase in towing speed, the drag on the gear system increased. Small-scale model gears showed vertical and horizontal displacements. With an increase in towing speed, the gear achieved a shallower depth, whereas with a decrease in speed, the gear attained a deeper position. In a real fishing ground, the vertical displacement (depth) of the hooks is vital, because the distribution of aquatic organisms varies among the vertical layers of the water column (Bach et al., 2009). Moreover, how deep the gear hooks reach is important not only from an environmental point of view (bycatches and/or damage to habitat) but also for the safety of the fishing gear itself. Our main objectives in this study were to estimate hook depth and identify the mechanisms how to control it. To that end, we developed two numerical approaches to predict hook depth and the underwater shape of the trolling line. Thus, during actual fishing operations, monitoring towing speed can be considered a fishing strategy to deploy the gear to the target depth. However, the speed must always be slower than the typical swimming speed of the school, because the use of trolling line is a passive fishing method. However, using different sinker weights, hook depth can be controlled by increasing or decreasing the sinking force (sinker weights). It possible to direct the gear to deeper or shallower depths by rigging the gear with larger or smaller sinkers, respectively.
In fact, there are three basic strategies to control the desired hook depth: (1) controlling the warp line length, (2) adjusting the weight of the sinker (heavier sinkers for deeper target depths or lighter sinkers for shallower depths), and (3) controlling the towing (trolling) speed, the speed of troller must be lower than the maximum swimming speed of the target species. Thus, the last strategy is limited by the swimming behavior of the target species. The two former strategies are discussed in the next section.
Quantitative analysis for controlling warp line length
A major problem in trolling line fishing method is controlling the hook depth during field operations. For example, in the case of the Korean hairtail fishery near the coast of Jeju Island, the fished water depth is between 50 and 70 m, yet the seafloor, at a depth of 80 m, is close to this fishing zone. Thus, an effective method for controlling the hook depth is essential to avoid any possible contact between the hooks or sinker with the seafloor because such circumstances could result in increased drag on the vessel, loss or breakage of the gear, or an even more serious accident. The skipper needs to determine a skilled estimate of the mean hook depth before commencing operations to select a suitable sinker size and to determine the length of warp line to use. Here, we estimated the amount of warp line necessary for a specific target depth. Because of the structural design of trolling line, the depths of both the hooks and warp line are interrelated. Thus, knowledge on the depth of the warp line is helpful for predicting the hook depth. Mathematically, the amount of warp line (l) needed to attain a desired fishing depth is expressed as
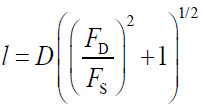 (21)
(21)
Where D is the desired target depth, FS is total sinking force of the gear and FD is the total drag force on gear.
As shown in Figure 16, a 3D graph was plotted using the MATLAB program to predict the warp line needed to reach a desired fishing depth in relation to the towing speed and target depth. The size of each mesh grid is 0.25 ms-1 by 5 m. Based on the relationships among the three variables; obtained from the static analysis, to catch a fish school at a 60 m depth and 1 ms-1 speed, deployment of a 104.75 m long warp line is required to reach this target depth. Similarly, a warp line 64.19 m long is needed to attain a 50 m target depth when the hairtail gear is trolled at 0.75 ms-1. Overall, as the towing speed increases from 0 to 1 ms-1, there is a slow change in the towing warp line length with target depth. In contrast, as the speed increases from 1 to 3 ms-1, there is a relatively quick change in the predicted warp line length with target depth. This indicates that with a smaller increase in towing speed, a greater length of warp line is needed for a specific target depth. For example, at a towing speed of 1.5 ms-1, the predicted length of the warp line needed to catch a fish school at 60 m is nearly double that needed at a speed of 1 ms-1.
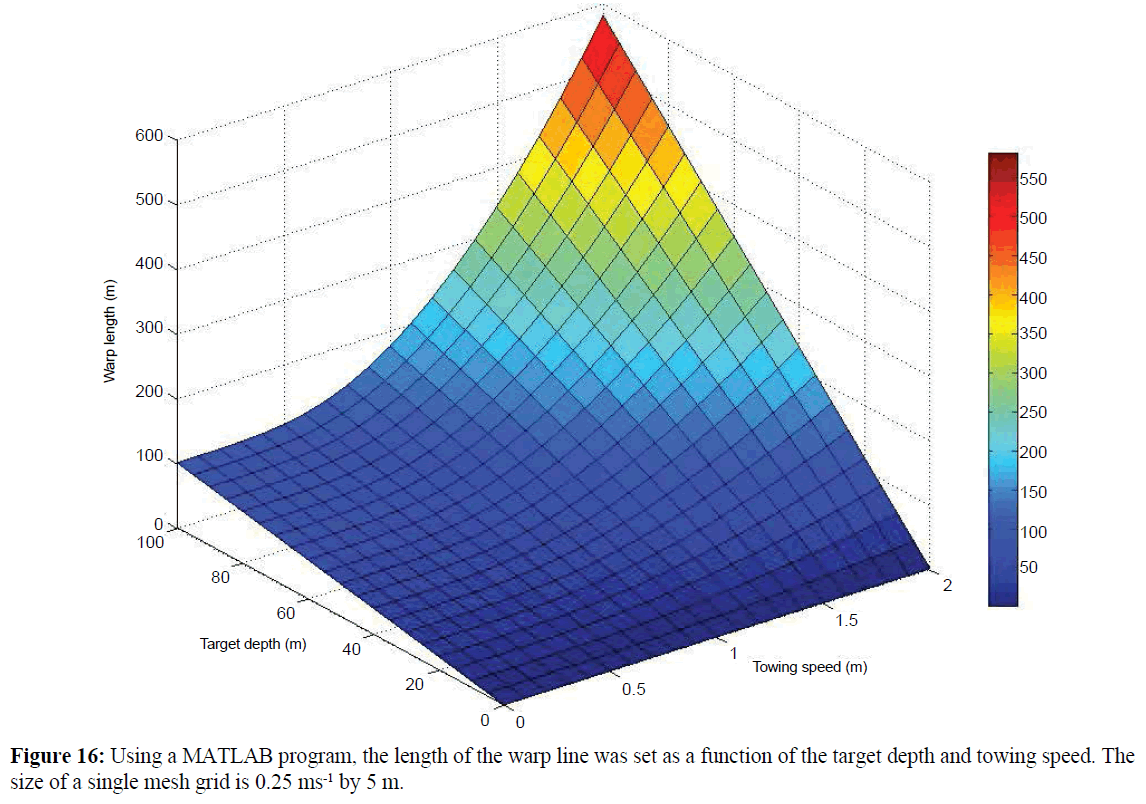
Figure 16: Using a MATLAB program, the length of the warp line was set as a function of the target depth and towing speed. The size of a single mesh grid is 0.25 ms-1 by 5 m.
Figure 17 shows a static prediction of warp line length as a function of sinker weight, specifically for typical Korean hairtail fishing gear at a 1 ms-1 towing speed. This plot helps in the selection of one of two methods to achieve the desired hook depth: controlling the warp line or sinker size. First, if a vertical line is drawn from a specific sinker weight to pass through curves at distinct points, then the skipper can determine the corresponding warp lines needed. For example, if the gear is rigged with a 3 kg sinker, the vertical line indicates that a 163 m long warp line is needed for a 65 m target depth, while a 147.9 m long warp line is needed for a 55 m target depth. Second, if a horizontal line is drawn from a specific warp line length to pass through curves at distinct points; this helps the skipper select the appropriate sinker size for a specific target depth. For instance, if the skipper wishes to use a 100 m long warp line, a sinker of 11.4 kg can be used for a 52.5 m target depth or a 15.2 kg sinker for a 57.5 m depth.
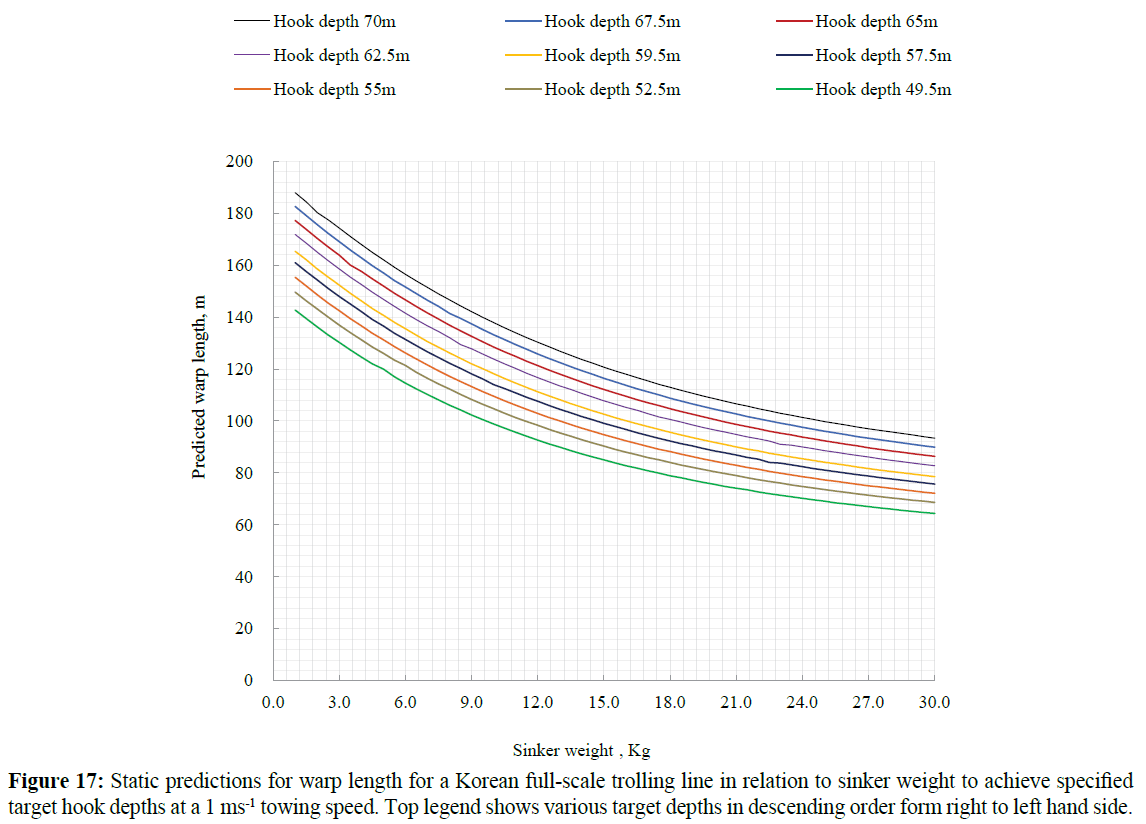
Figure 17: Static predictions for warp length for a Korean full-scale trolling line in relation to sinker weight to achieve specified target hook depths at a 1 ms-1 towing speed. Top legend shows various target depths in descending order form right to left hand side.
To achieve a specific target depth, there are two fishing strategies: (1) use a shorter warp line for the gear when rigged with a heavier sinker or (2) use a longer warp line for the gear when rigged with a lighter sinker. The mainline is longer than the warp line (usually the ratio of the warp line to mainline is >1.25) and consists of numerous hooks and floats. Moreover, the gear is complex, and its shape is affected by the direction and magnitude of the current in each water layer across the water column. Thus, the longer the length of the gear deployed, the more difficult it is to monitor the underwater gear shape and the longer it takes to retrieve. However, with too heavy a sinker rigged on a short warp line, it will be difficult to control the gear depth by adjusting the towing speed, especially while trolling near a seabed with a rough topography consisting of irregular seamounts. Furthermore, its large projected area will create more drag. The first strategy appears more suitable for higher-powered vessels, whereas the second strategy appears more appropriate for smaller fishing boats and for fishing locations where there may be a need for setting the gear depth by adjusting the towing speed. Moreover, several other factors determine the effectiveness of fishing methods, including the skill of the skipper, location of the target school, topography of the seafloor, and fishing tools available. Generally, it is advantageous to use a medium-weight sinker and medium length warp line, considering the available resources and fishing environment.
Conclusions
Mass-spring and static methods were developed and applied to small-scale and full-scale trolling line models. Simulations using the dynamic (mass-spring) method were performed to investigate the underwater performance of an actual hairtail trolling gear and to predict the hook depth under various fishing conditions. In summary:
• The static method of analysis is a simple approach that can be used to predict the shape and position in space of the hairtail trolling line in an equilibrium state. Thus, it might be difficult to apply it to troll the gear operating in a complex oceanic environment with dynamic flow and waves.
• Based on the model tests in the flume tank, simulation results showed close agreement with actual measurements. Thus, the use of mass-spring modeling for predicting the dynamic trolling line shape in space and time under various fishing conditions was confirmed.
• In hairtail fishing, because the target depth is typically close to the seabed, it is vital that a hook depth control mechanism is implemented to avoid contacts between the trolling line and the seafloor. To achieve target hook depth, there are three strategies: controlling towing speed, warp line, and sinker size. However, when considering towing speed, the speed must be less than the typical swimming speed of the target species.
Our research has certain limitations considering that the experiments were performed on a small scale in a flume tank. Further studies are needed to strengthen our findings through field trials.
Acknowledgements
This research was a part of the project titled 'The development of Labor Saving fishing technology and fishing equipment in Hairtail Trolling Line, funded by the Ministry of Oceans and Fisheries, Korea.
11332
References
- Bach, P., Gaertner, D., Menkes, C., Romanov, E., Travassos, P. (2009) Effects of the gear deployment strategy and current shear on pelagic longline shoaling. Fisheries Research 95, 55-64
- nBach, P., Travassos, P., Gaertner, D. (2006) Why the number of hook per basket (HPB) is not a good proxy indicator or the maximum fishing depth in drifting longline fisheries? Col. Vol. Sci. Pap. ICCAT 59, 701-715
- nBigelow, K., Musyl, M.K., Poisson, F., Kleiber, P. (2006) Pelagic longline gear depth and shoaling. Fisheries Research 77, 173-183
- nCao, D., Song, L., Li, J., Yuan, J., Zhou, Y. (2014) Determining the drag coefficient of a cylinder perpendicular to water flow by numerical simulation and field measurement.Ocean Engineering 85, 93-99
- nFridman., Carrothers. (1986) Calculations for fishing gear designs. Fishing news books England
- nKeigo Ebata, M.M., Kasuhiro, Matsumura., Shigeru, Fuwa. (2003) Theoretical and experimental studies on the dynamics of a trolling depressor, in: Paschen, M. (Ed.), Contributions on the Theory of Fishing Gears and Related Marine Systems,University of Rostock, University of Rostock, Rostock, Mecklenburg-Vorpommern, Germany 3, 147-157
- nGabriel, O., Lange, K., Dahm, E., Wendt, T. (2008) Fish catching methods of the world. John Wiley and Sons
- nGere, J.M., (2011). Barry. Goodno: Mechanics of Material 7th Edition, Cengage Learning, Toronto, 116-127
- nHoerner, S.F. (1965) Fluid-dynamic drag: practical information on aerodynamic drag and hydrodynamic resistance. Hoerner Fluid Dynamics
- nLøkkeborg, S., Bjordal, Å. (1992) Species and size selectivity in longline fishing: a review. Fisheries Research 13, 311-322
- nLee, C.W., Kim, Y.B., Lee, G.H., Choe, M.Y., Lee, M.K. et al. (2008) Dynamic simulation of a fish cage system subjected to currents and waves. Ocean Engineering 35, 1521-1532
- nLee, J., Lee, C.W., Karlsen, L. (2011) Sea trials and application of a numerical method for the analysis of the ocean current displacement phenomena of demersallonglines.Ocean Engineering 38, 1744-1754
- nLee, J.H., Lee, C.W., Cha, B.J. (2005) Dynamic simulation of tuna longline gear using numerical methods. Fisheries science 71, 1287-1294
- nMatsuda, K. (2001) “” [Fishing gear physics].Tokyo Univeristy, Tokyo, Japan
- nMiyamoto, Y., Uchida, K.,Orii, R., Wen, Z., Shiode, D. et al. (2006) Three dimensional underwater shape measurement of tuna longline using ultrasonic positioning system and ORBCOMM buoy. Fisheries science 72, 63-68
- nSong, L., Gao, P. (2006) Captured depth, water-temperature and salinity of bigeye tuna (Thunnusobesus) longlining in Maldives waters. J of Fisheries of China 30, 335-340
- nTsukrov, I., Eroshkin, O., Fredriksson, D., Swift, M.R., Celikkol, B. (2003) Finite element modeling of net panels using a consistent net element. Ocean Engineering 30, 251-270
- nWan, R., Cui, J., Song, X., Tang, Y., Zhao, F. (2005) A numerical model for predicting the fishing operation status of tuna longlines. Journal of Fisheries of China 29, 238-245
- nWan, R., Hu, F., Tokai, T., Matuda, K. (2002) A method for analyzing the static response of submerged rope systems based on a finite element method. Fisheries science 68, 65-70
- nWard, P., Epe, S., Kreutz, D., Lawrence, E., Robins, C. et al. (2009) The effects of circle hooks on bycatch and target catches in Australia's pelagic longline fishery. Fisheries Research 97, 253-262.


