Keywords
Yellow perch; Predator; Growth, Diet; Genetics; Density; Population
Introduction
The yellow perch (Perca flavescens), widespread in temperate North American lakes, is an ideal species for investigating fish community ecology (Purchase et al. 2005). Some of the earliest studies of lake community ecology investigated populations of yellow perch or Eurasian Perch (Perca fluviatilis) wherein growth of individuals plateaued at lengths far below the maximum potential size of the species; these have been called stunted populations (Eschmeyer 1937; Alm 1946; Ridgeway and Chapleau 1994; Headley and Lauer 2008). Perch growth has been the topic of many subsequent studies and has been shown to be subject to both top-down predator control (Thorpe 1977), and to bottom-up food web influences (Hayes et al. 1992; Horppila et al. 2010).
Food resources have long been studied as a source of perch growth variation with inconsistent results. Throughout ontogenetic development diet has implications for growth as perch progress from a diet of zooplankton, to invertebrates and finally to a fish based diet (Mittelbach and Persson 1998; Graeb et al. 2006). Roff (1986) reasoned that a gap in the prey size spectrum could preclude perch from progressing to the next foraging stage, generating a growth bottleneck and thus a stunted population. However, Boisclair and Leggett (1989a; 1989b; 1989c) were unable to establish a relationship between perch abundance, growth and the quantity or type of prey consumed. Intraspecific competition limits dietary resources and has long been associated with the occurrence of stunted perch populations (Horppila et al. 2010; Ridgeway and Chapleau 1994; Headley and Lauer 2008).
The three northern Alberta lakes examined in this study (Kimowin Lake, Sucker Lake, and Mildred Lake) were surveyed in 1996-1997, as reference sites in an oil sands aquatic reclamation study (van den Heuvel et al. 1999a; 1999b; 2012). Across the relatively small geographic distance (~100 km), the perch populations varied from stunted to trophy-sized (approaching maximum size observed for the species). Despite large differences in adult perch size, there were no substantive growth differences in young-of-the year yellow perch due to consistent temperature and food supply between lakes (Power and van den Heuvel 1999). Thus, adult perch size differences were not related to differences in the first year of perch growth.
Considering that perch growth is subject to a wide range of biotic and abiotic influences, we sought to determine if betweenlake differences endured over a generational time scale. In order to assess the drivers of potential growth differences we re-evaluated perch growth, condition factor and reproductive investment of adult yellow perch. We hypothesized that growth primarily responded to adult population density (intraspecific competition). Following the initial survey, two top-predator piscivores, Walleye (Sander vitreus) and Northern Pike (Esox lucius) established in one of the lakes, which drove a collapse in the perch population. This provided a serendipitous opportunity to examine how increased predation affected perch density and growth. Growth, condition factor, and reproductive development can also be affected by a number of other factors including interspecific competition, water quality, particularly temperature, population genetics, and diet quality. In order to address those other potential influences, fish community structure, water quality variables, perch stomach contents, and perch population genetics were also evaluated.
Materials and Methods
Study sites
The three study sites are located within 100 km of Fort McMurray, AB, Canada (Figure 1) and are typical (non-shield rock) boreal forest lakes. General characteristics for the three lakes, Kimowin Lake (56° 11.75’N, 110° 7.00’W), Mildred Lake (56° 11.75’N, 110° 7.00’W), and Sucker Lake (56°1 1.75'N, 110° 7.00'W) are given in Table 1. Two lakes, Kimowin and Sucker are remote, and the catchment areas of these lakes are entirely forested. Mildred Lake is located on the mining lease of the Syncrude Canada Ltd. In 1975, the lake was modified to serve as a water reservoir for the oil sands extraction process. To maintain water levels, water is pumped into the lake from the Athabasca River promoting the likelihood of fish colonization (van den Heuvel et al. 2012).
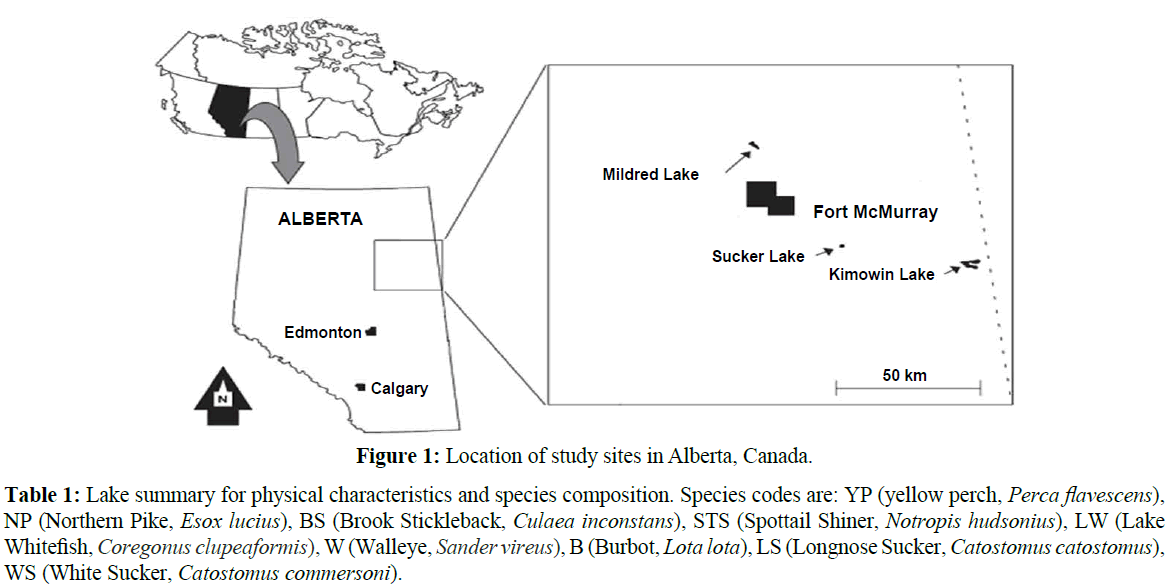
Figure 1: Location of study sites in Alberta, Canada.
| Lake |
Surface Area (km2) |
Mean Depth (m) |
Maximum Depth (m) |
Fish Species Richness |
Fish Community Composition |
| Kimowin |
4.5 |
3.6 |
12 |
3 |
YP, NP, BS |
| Mildred |
1.7 |
4.3 |
8.2 |
8 |
YP, NP, STS, LW, W, B, LS, WS |
| Sucker |
0.6 |
3.6 |
6 |
3 |
YP, NP, WS |
Table 1: Lake summary for physical characteristics and species composition. Species codes are: YP (yellow perch, Perca flavescens), NP (Northern Pike, Esox lucius), BS (Brook Stickleback, Culaea inconstans), STS (Spottail Shiner, Notropis hudsonius), LW (Lake Whitefish, Coregonus clupeaformis), W (Walleye, Sander vireus), B (Burbot, Lota lota), LS (Longnose Sucker, Catostomus catostomus), WS (White Sucker, Catostomus commersoni).
Fish community sampling
In the three study lakes, seine netting (50 m×3 m with 7 mm mesh) was used to determine perch density and the density of other species in the fish community. Collections were made from September 18-26 in 1996, and September 15-23 in 2009. A total of 6, 7 and 10 netting locations were randomly chosen in Sucker Lake, Mildred Lake and Kimowin Lake, respectively. Fewer locations were chosen at Sucker Lake due to the relative homogeneity of the shore line and littoral zone and the slightly smaller size of the lake (Table 1). The seine net was deployed from a small motorized boat in a semi-circular fashion and retrieved from shore. The area netted was used to calculate densities for yellow perch and other species in the fish community. Perch captured via seine netting were counted and assessed as either young-of-the-year or greater than 1 year old. Young-of-the-year was classified based on a size cut-off for each lake: 7.5, 8.0, and 8.5 cm for Sucker, Mildred, and Kimowin Lakes respectively. As there was a non-overlapping size ranges between young-of-the year and other cohorts thus age structure analysis was not used to confirm this.
Other fish species were documented and fork length measurements (1 mm) were taken from Northern Pike and Walleye as they were captured. In order to supplement the seine data to obtain a full range of year classes for age-length analysis, other netting methods were applied. These included trap net sets (1.2 m×1.2 m box, 2.5 cm mesh, and 25 m leader), gill nets (25 m with 5 panels each 5 m in length and a range of mesh sizes from 19 mm to 63.5 mm), and fyke nets (0.9 m×1.2 m hoop, 0.95 cm mesh, 7.6 m leader). As these additional data were evaluated for agelength relationships as opposed to relative year class abundance, any gear selectivity would not have had any effect on this analysis. The fish density and relative abundance of fish species for Mildred Lake was complimented by boat electrofishing data collected annually by Syncrude Canada, Ltd. as part of their oil sands lease agreement. The two other remote lakes are not monitored in this fashion and it is not practically possible to access them with an electrofishing boat due to their remote nature. A Smith-Root electrofisher mounted on a Smith-Root electrofishing boat was used with 500 V pulsed direct current, and pulse frequency was adjusted to provide a measured current between 2.4 and 2.8 A. All fish were captured by dip net were placed in a 500 L live well with flow-through water circulation prior to being measured and released. Electrofishing surveys of Mildred Lake were conducted on at least two occasions each year between May and September.
Perch growth
To assess age-growth relationships and the somatic variables such as condition factor and gonad size, a subsample of perch were sacrificed in late September 1996 and 2009. A nominal 20 males and 20 females were sacrificed at each site. Fish were retained in a wire mesh 0.75 m3 live well for a maximum of 1 hour before sampling. Fish were weighed (g), measured (mm), organ weights (0.01 g) were recorded for gonad, and liver. Measurements of these parameters were used to calculate gonado-somatic index and condition factor. Age was determined by comparing the two ageing structures (anal fin ray and opercula), which has been shown to improve accuracy in the age predictions (Norris 1984). Opercula were boiled for up to 2 minutes to denature the soft tissue coating the bone. After boiling, the soft tissue was removed and the opercula were placed in fresh coin envelopes. Anal fin rays were sectioned using a Buehler® Isomet low speed saw, the saw was set to 70 RPM and sections were cut to a width of 0.5 mm. After cutting, sections were fixed to slides with Permount® mounting media. Ages were assigned based upon blind readings of both ageing structures. In the event of a disagreement, operculae and fin ray were compared. A sub-sample was aged by an independent reader to ensure consistency.
Stomach contents
Analysis of stomach contents was conducted to compare prey diversity and relative abundance of each prey type. Stomach contents were collected from a nominal 20 individuals that were over one year old. During seine netting gut contents were removed from fish in non-lethal sampling via the gastric lavage technique; a method that Hartleb and Moring (1995) verified to be 100% effective for yellow perch. In the event that fish were sacrificed for ageing and physiological endpoints, stomach contents were also collected post mortem. Once collected, all samples were preserved in Carnoys Solution (3:1 of absolute ethanol to glacial acetic acid). Invertebrates were identified using a compound microscope and classified based on the local keys found in Clifford (1991). Invertebrates were combined into groups for statistical analysis. Several insect Orders (Coleoptera, Odonata, Megaloptera, Trichoptera, Hemiptera, and Plecoptera) were uncommon during the analysis and were combined to form the category Other Insecta. In some categories, such as chironomids, further identification was not pursued as they were often degraded by digestive process and are inherently difficult to identify.
Perch genetic analysis
In 2010, the lakes were revisited to collect samples for genetic analysis; yellow perch fin clips were collected from the three study lakes between May and September and stored in 95% ethanol. Samples were genotyped at 8 microsatellite loci as described in Gryzybowski et al. (2010). The loci examined were Pfla-L2, Pfla-L6, Pfla-L9, Mpf-6, MPf-7, MPf-17, YP60, and YP81. Primer sequences for those loci are presented in Gryzybowski et al. (2010) and Leclerc (2000). DNA was extracted using Chelex buffer (Walsh et al. 1991). Primers were used in PCR reactions with fluorescently labelled forward primers (ABI) to amplify repeats and the PCR products were analyzed using an ABI Prism 3730 capillary DNA analyzer. This information was then compared to a geographically distant out group, Lake Winnebago, Wisconsin.
Water chemistry and temperature
In 1997, water temperature was monitored during the open water months in all study sites (Power and van den Heuvel 1999). In 2009, temperature was monitored in Mildred Lake and Sucker Lake. Optic StowAway temperature loggers were used in 1996 (Onset Computer Corporation, Bourne MA, USA), and Tidbit® v2 loggers in 2009 (Onset Computer Corporation, Bourne MA, USA). Temperature was monitored at a depth of 1.5 m every 3 hours throughout the growing season. The information was used to calculate the mean water temperature and the number of degree days. Due to the remoteness of Kimowin Lake (accessible only by aircraft) it was not possible to deploy a temperature logger in the spring of 2009. In the initial survey, all three lakes were shown to exhibit similar temperature trends throughout the year (Power and van den Heuvel 1999). In September of both sampling years temperature, pH, conductivity, and oxygen were measured at 1 meter intervals throughout the depth of the lake. (1996 Hydrolab model 4041; 2009 YSI 650 Multiparameter Display System (YSI Inc, yellow Springs Ohio, USA).
Statistics
Length-at-age relationships were modelled using a modified von Bertalanffy equation of the following form: Length = L∞×(1 – 0.96×e(-k × a^1.2)). The parameter L∞ was the length at infinite time, or maximum length, k was the growth constant, and a was age in years. Mean length for each age class was used for curve fitting comparisons of years in order to minimize the bias of different numbers of individuals in each year class. Growth curves were compared statistically within sites between years using the residual sums of squares method of Chen et al., 1992.
Body weight and gonad weight with year as the categorical variable were analyzed using analysis of covariance (ANCOVA; body weight and length as covariates, respectively) with logarithmically transformed values. Sampling year was used as the categorical treatment variable. Condition factor was calculated as corrected least square means body weight/mean length3×100, gonado-somatic index (GSI) as least square means gonad weight/ mean corrected body weight×100. All other fish density parametric statistics were evaluated using analysis of variance following testing for normality (normal probability curves) and homogeneity of variance (Levene’s and Brown-Forsythe tests) with base-10 logarithmic transformations where those assumptions were not met. All statistics were performed in STATISTICA version 8.0 using an experiment-wise alpha of 0.05.
For fish community and stomach content multivariate analysis, the statistics program PRIMER, v6, was used (2006 PRIMER-E Ltd, Plymouth, UK). Relative abundances were fourth root transformed so that the effect of rare taxa was not masked by the dominant ones (Clarke and Warwick 2001). The permutational ANOVA (ANOSIM) used to determine changes between years at each lake was based on a Bray-Curtis similarity matrix of the square root transformed relative abundance data with similarity coefficients calculated for each pair of samples. A Global R statistic is produced as an index of community difference, zero being identical, and one being no species overlap. Following the permutational ANOVA, a similarity percentages analysis (SIMPER) was conducted in order to determine which species contribute most to the variability between fish communities. Univariate analysis was conducted to test for density differences using individual species between the sampling intervals. As seine data did not conform the assumptions of parametric statistics (normality and homogeneity of variance), the non-parametric Mann-Whitney U Test was conducted in order to determine differences between years. Alpha was set at 0.05 for all analyses.
For perch microsatellite data, Fstat version 2.9.3.2 was used to calculate the Fst genetic distance parameter for each pair of populations and to test for statistical significance. Significance levels were adjusted for multiple comparisons using a sequential Bonferroni correction carried out using the stats package in R version 2.5.1. Genetic relationships between the lakes were visualized by constructing Neighbor joining trees in PHYLIP version 3.69 using a population from Lake Winnebago as an outgroup. Cavalli-Sforza and Edwards (1967) chord distance and Nei's genetic distance parameter (Nei 1972) was calculated using the NEIGBOR package in PHYLIP. Support for the trees was evaluated by analyzing 2,000 bootstrap replicates in an extended majority rule consensus tree in the PHYLIP package CONSENSE.
Results
Yellow perch growth rates
At Mildred Lake, both males and females exhibited significant differences in growth trajectory between sampling periods (Figure 2). The estimated maximum length increased by 28.8% for females and 32.9% for males between the surveys, a difference of over 9 cm for both sexes (Table 2). Kimowin Lake displayed a significant growth rate increase in males only, over the same period. Perch in Mildred and Kimowin Lakes tended to live much longer than at Sucker Lake (Figure 2). In 2009-2010, only two perch at Sucker Lake were over 4 years old and the maximum length (L∞) was below 20 cm. Perch at the other lakes grew to a maximum length of 30 cm and lived to be 10-12 years old.
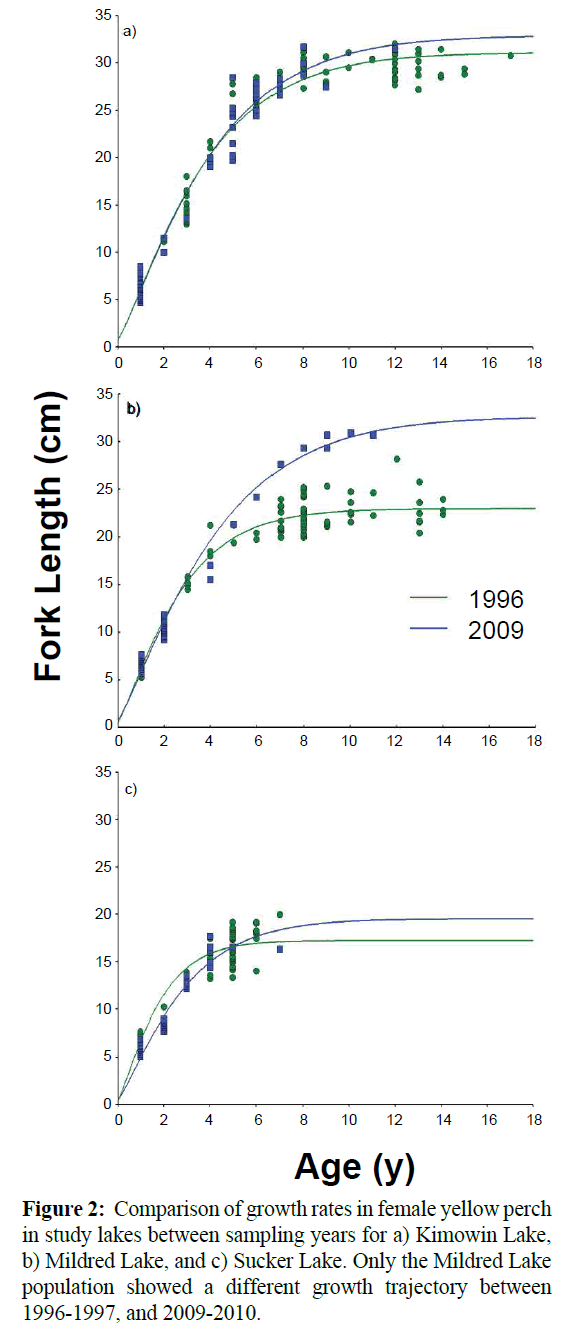
Figure 2: Comparison of growth rates in female yellow perch in study lakes between sampling years for a) Kimowin Lake, b) Mildred Lake, and c) Sucker Lake. Only the Mildred Lake population showed a different growth trajectory between 1996-1997, and 2009-2010.
| |
Year |
L∞ (cm) |
k |
K |
GSI |
| Females |
|
| Kimowin Lake |
1996 |
30.9 (30.3-31.5) |
0.19 (0.18-0.21) |
1.72 (0.02, 40) |
4.78 (0.11, 38) |
| 2009 |
32.9 (31.4-34.4) |
0.18 (0.16-0.20) |
1.67 (0.03, 26) |
4.84 (0.14, 26) |
| Mildred Lake* |
1996 |
23.0 (22.4-23.5) |
0.29 (0.25-0.32) |
1.23 (0.02, 23) |
3.88 (0.20, 23) |
| 2009 |
32.3 (30.9-33.7) |
0.17 (0.16-0.19) |
1.42 (0.03, 11)* |
2.19 (0.38, 2)* |
| Sucker Lake |
1996 |
17.2 (16.7-17.6) |
0.46 (0.43-0.51) |
1.24 (0.02, 27) |
2.95 (0.10, 27) |
| 2009 |
19.5 (17.8-21.2) |
0.27 (0.23-0.31) |
1.22 (0.02, 21) |
2.53 (0.10, 20)* |
| Males |
|
| Kimowin Lake* |
1996 |
27.6 (27.2-28.1) |
0.20 (0.19-0.22) |
1.61 (0.03, 17) |
5.23 (0.25, 17) |
| 2009 |
29.0 (27.6-30.3) |
0.22 (0.20-0.24) |
1.60 (0.03, 13) |
5.44 (0.31, 12) |
| Mildred Lake* |
1996 |
19.0 (18.6-19.4) |
0.38 (0.34-0.42) |
1.24 (0.02, 20) |
4.80 (0.54, 20) |
| 2009 |
28.3 (26.6-29.8) |
0.22 (0.20-0.24) |
1.30 (0.02, 16) |
6.14 (0.97, 14) |
| Sucker Lake |
1996 |
17.2 (16.7-17.8) |
0.47 (0.43-0.51) |
1.22 (0.02, 23) |
6.63 (0.31, 20) |
| 2009 |
17.5 (15.8-19.1) |
0.31 (0.26-0.36) |
1.26 (0.03, 19) |
5.98 (0.29, 19) |
Table 2: Von Bertalanffy growth curve parameters, maximum length (L∞) and growth constant (k) and mean (SEM, n) condition factor (K), and gonadosomatic index (GSI) for three northern Alberta Lakes. The 95% C.I. for growth curve parameters is shown in parentheses. Asterisks indicate statistical significance between years at p<0.05. Asterisks on the lake name indicate that the growth curves were not coincident between years at p<0.05 using residual sums of squares analysis.
Yellow perch somatic indices
Kimowin Lake perch had the highest condition factor and reproductive investment in both sampling years (Table 2). In both years perch at Kimowin Lake had a 20-30% greater condition factor than the other study sites. The stunted perch in Sucker Lake had the lowest condition factor, and female GSI decreased significantly between sampling years. Compared to Kimowin Lake, female perch at Sucker Lake invested almost 50% less relative mass in reproductive tissue. Sucker Lake perch also maintained the lowest condition factor between years. Female perch at Mildred Lake exhibited a significant increase in condition factor and a significant decrease in reproductive investment between years. At Kimowin Lake, the condition factor for both males and females was greater than the other lakes. The difference between Kimowin Lake and the other lakes was maintained between sampling years, reflecting the potential of this population to grow larger, older, and have higher condition.
Fish community composition
Multivariate analysis of seine net density data with permutational ANOVA (ANOSIM) showed that the fish community of Mildred Lake changed significantly between 1996-1997 and 2009-2010 (Global R=0.41). There were no significant differences in either the Sucker Lake (Global R=0.16) or the Kimowin Lake (Global R=0.01) fish community between 1996-1997 and 2009-2010. At Mildred Lake yellow perch decreases between 1996-1997 and 2009-2010 were the highest contributor to the Bray Curtis dissimilarity (38.4% contribution). The second and third highest contributions to the community difference were due to increases in Spottail Shiner (25.4%) and Northern Pike (16.5%).
Univariate analysis supported the multivariate results, as it detected a significant decrease in yellow perch density at Mildred Lake between 1996-1997 and 2009-2010 (Figure 3a). The perch decreases were paralleled by increases in two predator species, Northern Pike and Walleye. Northern Pike were first observed in the lake in 1997, and in 2009 they were established throughout the lake though densities were lower than Kimowin or Sucker Lake (Figure 3b). Walleye were present in 1996-1997, but their distribution in the lake was limited and they were not captured during the seine net surveys. The relative changes in abundance of Walleye and perch can best be observed through the annual electrofishing surveys that show the declines in the relative abundance of perch and the steep increase in Walleye abundance (Figure 4). Walleye became so prolific in the lake that in 2006- 2007 over 1,000 were angled from the lake and used for the stocking of Lac La Biche, Alberta. In the 2009 seining, Walleye were widely distributed in Mildred Lake with a mean density of 2.9 individuals per ha. A third predator, the burbot, was present in Mildred Lake since prior to 1996-1997, but was only rarely captured with seine and electrofishing techniques. Overnight trap net sets showed that seine and electrofishing techniques underrepresent this species. Trap netting also showed that White Sucker and Longnose Sucker were underrepresented by seine and electrofishing efforts. Northern Pike observed during seine netting at Mildred Lake tended to be young-of-the-year. At Sucker Lake, the average Northern Pike size was 53.5 cm (n=31, SEM=1.74). The Northern Pike at Kimowin Lake were smaller 43.8 cm (n=22, SEM=1.14).
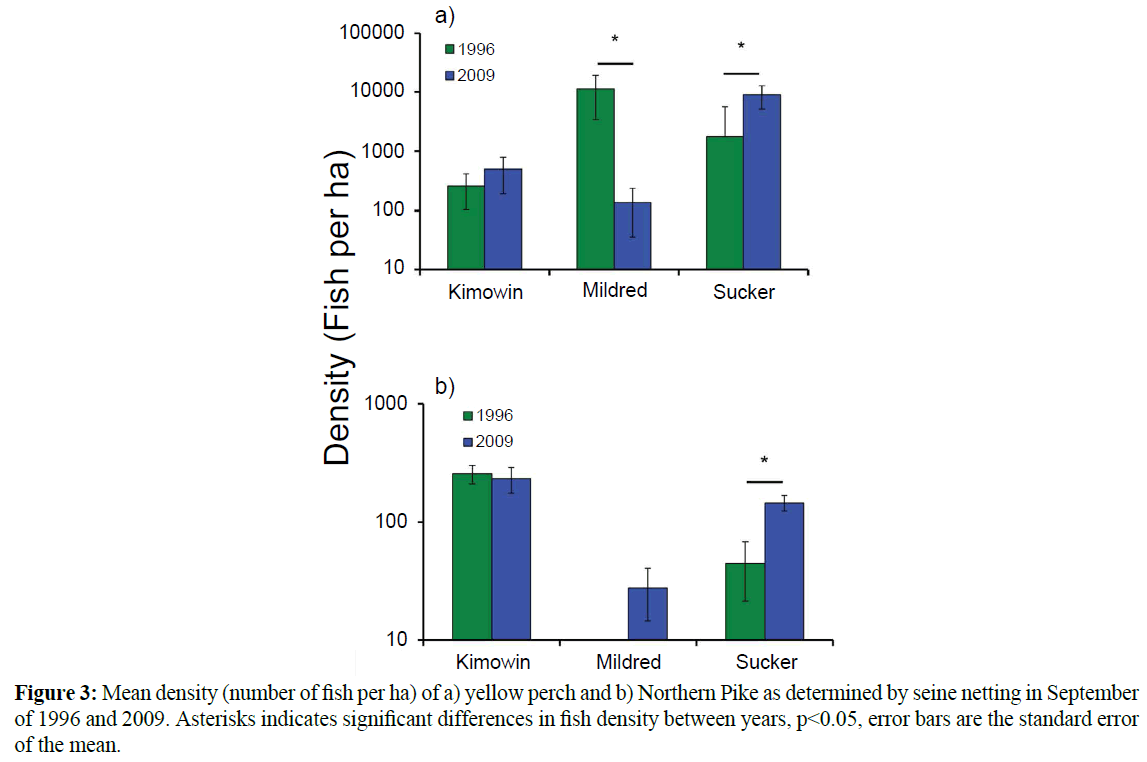
Figure 3: Mean density (number of fish per ha) of a) yellow perch and b) Northern Pike as determined by seine netting in September of 1996 and 2009. Asterisks indicates significant differences in fish density between years, p<0.05, error bars are the standard error of the mean.

Figure 4: Relative abundance of Northern Pike, yellow perch, and Walleye in Mildred Lake. A total of 1,000 Walleye were removed from Mildred Lake in 2006 and 2007.
Water temperature and oxygen
Water temperature loggers deployed at 1.5 m depth between May 20 and September 15, 1997 measured 2123, 2139, and 2204 degree days for Mildred, Kimowin, and Sucker Lake, respectively. Thus in 1997, the warmest location, Sucker Lake, had the perch population with the poorest growth, and Kimowin Lake, with the highest growth had almost identical temperature regime to Mildred Lake. In 2010 it was not possible to deploy a temperature logger at Kimowin Lake, but temperature was 2129, and 2138 degree days at Mildred and Sucker Lake, respectively. Most importantly, Mildred Lake had very similar degree days, 2123 and 2129 in 1997 and 2010, respectively. It should be noted that these temperature profiles were collected the year after the perch growth data were collected (September 1996 and 2009) and thus do not reflect those exact years, but they do give a good indication of similarity in temperature between lakes.
At Kimowin Lake, an oxygen gradient typically occurs over the summer and early fall. In 2009 the epilimnion 6 meters deep and uniformly oxygenated (>6.7 mg/L), the hypolimnion was hypoxic up to 1 meter from the substrate. Due to the high hydraulic turnover at Mildred Lake, it remains fully saturated with oxygen throughout the year (9.08-10.48 mg/L in September 2009). Sucker Lake is the only study site that undergoes late winter hypoxic conditions. In this lake, a 3-4 meter epilimnion remains oxygenated throughout the open water season. In 2009, the hypolimnion was hypoxic (2.14 mg/L) below 3 meters and anoxic (0.13 mg/L) at the substrate. The pH and conductivity was typical for lakes of the region and comparable to the ranges observed in the original survey (van den Heuvel et al. 1999a).
Yellow perch stomach contents
Diet composition was evaluated in both survey years. The samples sizes for diet comparison in 2009-2010 were 13, 23, and 21 for Mildred, Kimowin, and Sucker Lakes, respectively. Sample sizes in 1996-1997 were 65, 65, and 36, for Mildred, Kimowin, and Sucker Lakes, respectively. At Kimowin Lake, the diet composition remained constant between years (ANOSIM), with Gammarus lacustris consumed by 70-80% of perch in both sampling years (Figure 5). In the Kimowin Lake perch diet, the Other Insecta group represented the greatest change between years. These changes were attributable to an increased consumption of Order Hemiptera, Notonecta sp. (Notonectidae; common backswimmer). The Notonecta was found in 57% of all perch and it comprised the 20% of the relative abundance in 2009. Despite the shift in the diet of perch at Kimowin Lake there was no statistical change (ANOSIM; Global R=0.052) in stomach contents between years. There was a shift from amphipods to other insecta in Mildred Lake, however, the diversity of prey consumed was not significantly different between 1996-997 and 2009 (ANOSIM; Global R=-0.044). In both sampling years Mildred Lake perch consumed the greatest diversity of prey, with both Hyalella azteca (Amphipoda: Dogielinotidae) and G. lacustris. Other Insecta consumed at Mildred Lake included of Trichoptera (Phryganeidae), Odonata, and Hemiptera (Corixidae). Sucker Lake was the only site where the diet changed significantly between years (ANOSIM; Global R=0.225). The SIMPER analysis indicated that the change was largely (58%) driven by a shift from consumption of Chironomidae to the small amphipod Hyalella azteca (~7 mm).
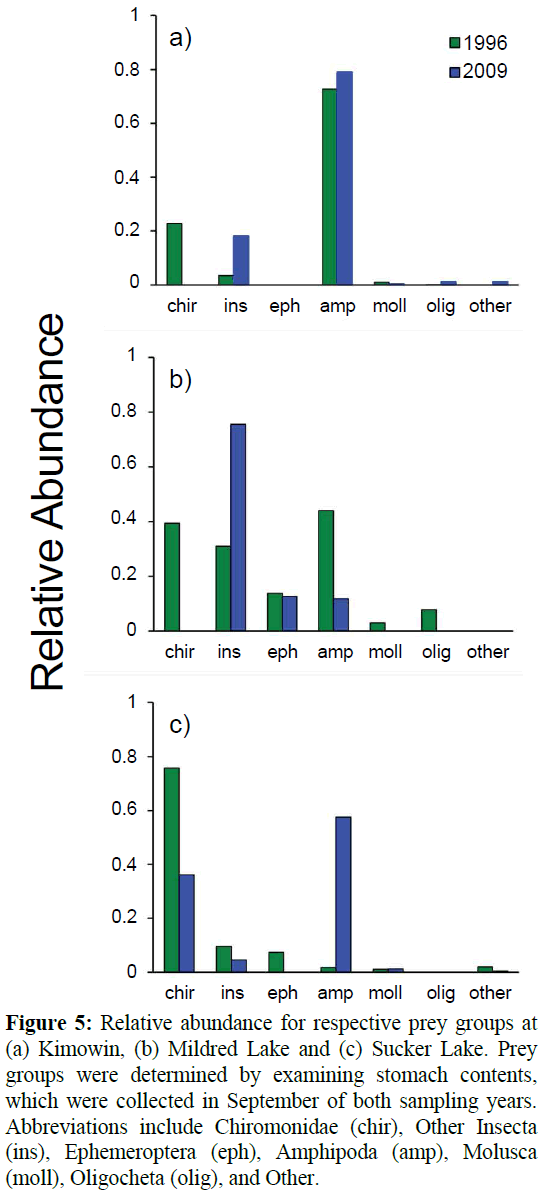
Figure 5: Relative abundance for respective prey groups at (a) Kimowin, (b) Mildred Lake and (c) Sucker Lake. Prey groups were determined by examining stomach contents, which were collected in September of both sampling years. Abbreviations include Chiromonidae (chir), Other Insecta (ins), Ephemeroptera (eph), Amphipoda (amp), Molusca (moll), Oligocheta (olig), and Other.
Yellow perch genetics
The eight microsatellite loci examined in the genetic comparison all had between two and twelve alleles at all of the sites, with only one exception (YP81) where one of the loci was homozygous at Mildred and Kimowin Lakes. Though all populations were statistically genetically distinct, comparison of the microsatellite allele data between populations revealed that the two Athabasca River locations, Sucker Lake and Mildred Lake had the greatest genetic similarity to each other and were genetically the most distant from the Lake Winnebago out group (Table 3, Figure 6). Kimowin Lake was the most genetically distant of the three Alberta Lakes and was also genetically more similar to Lake Winnebago.
| |
Kimowin |
Sucker |
Mildred |
| Sucker |
0.583, 0.619 |
|
|
| Mildred |
0.549, 0.436 |
0.291, 0.120 |
|
| Winnebago |
0.467, 1.047 |
0.539, 1.795 |
0.545, 1.799 |
Table 3: Pairwise Fst and Nei genetic distance parameters for the three yellow perch populations examined in comparison to a Lake Winnebago outgroup. Sample sizes were 48, 50, 34, and 68 individuals for Kimowin, Sucker, Mildred, and Lake Winnebago, respectively. Fst values are significantly different between all comparisons at a Bonferroni adjusted probability of <0.05.

Figure 6: Neighbor joining tree of Cavalli-Sforza and Edward’s (1967) chord distance based on 8 microsatellite loci. Bootstrap support greater than 50% is shown at the nodes.
Discussion
There were among-lake differences in yellow perch growth and condition factor that related to the absolute density of perch in those Lakes. While this supports the overall hypothesis that intraspecific competition drove growth differences, the more compelling evidence for this was the expansion and incursion of predators into Mildred Lake followed by a dramatic decrease in perch numbers, and large increases in growth. Despite the large differences in perch size, those growth changes did not appear to be driven by a shift to a piscivourous diet as fish were not a significant prey item in any of the lakes. The quality of invertebrate prey consumed at Kimowin seemed critical in achieving large sizes. While there were expected genetic differences due to watershed boundaries, the most closely related populations from Sucker and Mildred Lake showed substantial growth differences suggesting that genetic factors do not play a role in the observed growth and condition factor variation.
Density dependent population regulation has been commonly observed in perch populations and often it is attributed to competition for dietary resources (Rask 1983). In the lakes studied herein, access to large profitable invertebrates, appears to be a more important than a shift to piscivory. A competitive growth bottleneck may ensue as multiple cohorts of perch compete for limited resources (Persson 1986). A shift to a piscivorous diet has been shown to relieve intraspecific competition and increase growth (Headley and Lauer 2008), although similar to the present study, toward the northern edge of the species range a shift to piscivory did not increase growth (Barks et al. 2010). There is further incongruence on the matter as Boisclair and Leggett (1989a; 1989b) found no relationship between prey quantity or prey size and perch growth. However, there are still gaps in our understanding of the interplay between prey, growth and ontogenetic diet shifts at the northern edge of the species range.
Predation exerted the strongest influence on density and subsequently growth. Perch are an important prey species and are subject to considerable selective pressures from predators (Jolley et al. 2008; Olsen et al. 2001; Pierce and Tomcko 2006). Perch growth increased concomitant with increased predator abundance in Mildred Lake, as seen in Pierce and Tomcko (2006). The uptake of water for mine operations at Mildred Lake directly led to the establishment of predators.
In addition to obvious predation-related decreases in density affecting growth through intraspecific competition, predation may affect growth by behavioral mechanisms as well. For prey, there is a trade-off between the benefits fast growth (and the associated high foraging activity) and the elevated risk of predation concurrent with high activity. High activity rates may be favoured if there is an opportunity to reach a size refuge from gape-constrained predators. At Kimowin Lake, Northern Pike are stunted and rarely exceeded 1.5 kg. In this lake perch are the only forage fish species. The low density of small perch at this lake implies there is high mortality during early life history. The prevalence of large perch suggests that they attain a size refuge (>25 cm) as they outgrow the predation window of the predator (Fuiman and Magurran 1994). Conversely, if predators are large enough relative to the prey size, the prey may remain vulnerable to predation throughout their lifespan, which may favour limited activity and slow growth (Urban 2007). At Sucker Lake, Pike reach 4-6 kg, while perch do not exceed 20 cm. Perch remain vulnerable to predation from Pike throughout their ontogeny, in these circumstances limited activity and slow growth may be favoured (Roff 1986, Urban 2007).
Genetic differences were not a likely reason for growth differences in yellow perch. This is consistent with a previous study that examined stunted yellow perch in Quebec lakes (Heath and Roff, 1987). Perch populations in northern Alberta likely originated through southern movement of Beringian perch and northwest migration of Mississippian perch through post-glacial lakes. Rempel and Smith (1998) argued that connectivity between Mississippi and Churchill River remained after the corridor between Mississippi and Athabasca had closed. Our findings provide support to the suggestions of Rempel and Smith (1998) as Kimowin (Churchill River) perch were the least genetically distant from the Lake Winnebago stock, which is representative of the Mississippi glacial refugia Gryzybowski et al. (2010). Thus it appears that the Kimowin Lake perch population has been isolated from the perch populations of the other lakes for longest time period, yet show similar growth to Mildred Lake in the latter part of the study.
In the assessment of over 70 lakes, Purchase et al. (2005) concluded that in depth studies, with fewer study lakes could better refine our understanding of the key drivers of perch growth. The study at hand included density, community composition, temperature, oxygen, diet, genetic distance and physical lake characteristics as possible contributing variables to perch growth. The change in growth at Mildred Lake coincides with the establishment of predators, suggesting that predator mediated relief of intraspecific competition was integral to the shift. This study shows how the accumulated knowledge on perch growth can be applied to new challenges in freshwater ecosystem management. In the area, resource extraction companies are responsible for ensuring the protection and restoration of local ecosystems. This research illustrates how industrial resource use may have inadvertent, albeit profound consequences for fish community dynamics. This study exemplifies that long-term comprehensive monitoring focused on a limited number of study lakes is an effective approach to discern the key drivers of fish growth. Given the dramatic changes at Mildred Lake, conducting a subsequent follow-up survey would provide insights into perchpredator dynamics in future generations.
Acknowledgments
This work was supported by the Canadian Oil Sand Network for Research and Development and by an NSERC Collaborative Research and Development Grant and a Canada Research Chair to MRV. The authors thank Terry Van Meer, Evan Dobson, Rolo Goodwin, Darrell Klein and other members of Kimowin Lake Lodge.
13161
References
- Alm, G. (1946) Reasons for the occurrence of stunted fish populations (with special regard to the perch). Reports from the Swedish State Institute of Fresh-Water Fishery Research, Drottningholm25
- nBarks, P.M., Doucette, J.L.,Somers C.M. (2010) Lack of angling-sized yellow perch in a Canadian boreal lake: potential influences of growth rate, diet, and predation by double-crested cormorants. Transactions of the American Fisheries Society 139, 1029-1040
- nBoisclair, D.,Leggett, W.C. (1989a) Among-population variability of fish growth: I. Influence of the quantity of food consumed. Canadian Journal of Fisheries and Aquatic Sciences46, 457-467
- nBoisclair, D., Leggett, W.C. (1989a) Among-population variability of fish growth: II. Influence of prey type. Canadian Journal of Fisheries and Aquatic Sciences 46, 468-482
- nBoisclair, D., Leggett, W.C. (1989a) Among-population variability of fish growth: III. Influence of fish community. Canadian Journal of Fisheries and Aquatic Sciences 46, 1539-1550
- nCavalli-Sforza, L.L., Edwards, A.W.F. (1967) Phylogenetic analysis. Models and estimation procedures. American Journal of Human Genetics19, 233-257
- nChen, Y., Jackson, D.A., Harvey, H.H. (1992) A comparison of von Bertalanffy and polynomial functions in modelling fish growth data.Canadian Journal of Fisheries and Aquatic Sciences49, 1228-1235
- nClarke, K.R., Warwick,R.M. (2001) Change in marine communities: An approach to statistical analysis and interpretation, 2nd ed. Plymouth: PRIMER-E
- nClifford, H.F. (1991) Aquatic Invertebrates of Alberta.University of Alberta Press Alberta
- nEschmeyer, R.W. (1937) Some characteristics of a population of stunted perch. Papers of the Michigan Academy of Science, Arts and Letters22, 613-628
- nFuiman, L.E., Magurran, A.E. (1994) Development of predator defences in fishes. Reviews in Fish Biology and Fisheries 4, 145-183
- nGraeb, B., Mangan, M., Jolley, J., Wahl, D., Dettmers, J. (2006) Ontogenetic changes in prey preference and foraging ability of yellow perch: Insights based on relative energetic return of prey. Transactions of the American Fisheries Society135, 1493-1498
- nGryzybowski, M., Sepulveda-Villet, O.J., Stepien, C.A., Rosauer, D., Binkowski, F. et al. (2010) Genetic variation of 17 wild yellow perch populations from the midwest and east coast analyzed via microsatellites. Transactions of the American Fisheries Society139, 270-287
- nHartleb, C.F., Moring, J.R. (1995)An improved gastric lavage device for removing stomach contents from a live fish. Fisheries Research 24, 261-265
- nHayes, D.B., Taylor, W.W., Schneider, J.C. (1992) Response of yellow perch and the benthic invertebrate community to a reduction in the abundance of white sucker. Transactions of the American Fisheries Society121, 36-53
- nHeadley, H.C., Lauer, T.F. (2008) Density-dependent growth of yellow perch in southern Lake Michigan, 1984-2004. North American Journal of FisheriesManagemet.28, 57-69
- nHeath. D., Roff, D.A.(1987) Test of genetic differentiation in growth of stunted and nonstuntedpopulations of yellow perch and pumpkinseed. Transactions of the American Fisheries Society116, 98-102
- nHorppila, J., Olin, M., Vinni, M., Estlander, S., Nurminen, L.(2010) Perch production in forest lakes: the contribution of abiotic and biotic factors. Ecology of Freshwater Fishes19, 257-266
- nJolley, J.C., Willis, D.W., De Bates, T.J., Graham, D.D. (2008) The effects of mechanically reducing northern pike density on the sport fish community of West Long Lake, Nebraska, USA. Fisheries Management and Ecology 15, 251-258
- nLeclerc, D., Wirth, T., Bernatchez, L. (2000) Isolation andcharacterization of microsatellite loci in the yellow perch(Percaflavescens), and cross-species amplificationwithin the family Percidae. Molecular Ecology9, 995-997
- nMittelbach, G.G.,Persson, L.(1998) The ontogeny of piscivory and its ecological consequences. Canadian Journal of Fisheries and Aquatic Sciences 55, 1454-1465
- nNei, M. (1972) Genetic distance between populations. American Naturalist106, 283-292
- nNorris, H.J. (1984) A comparison of aging techniques and growth of yellow perch (Percaflavescens) from selected Alberta Lakes. MSc Thesis. University of Alberta, Edmonton, Alberta, Canada.pp: 173
- nOlson, M.H., Green, D.M.,Rudstam, L.G. (2001) Changes in yellow perch (Percaflavescens) growth associated with the establishment of a walleye (Stizostedionvitreum) population in Canadarago Lake, New York (USA). Ecology of Freshwater Fishes10, 11-20
- nPersson, L. (1986) Effects of reduced interspecific competition on resource utilization in Perch (Percafluviatilis). Ecology 67, 355-364
- nPierce, R.B.,Tomcko, C.M. (2006) Interactions between stocked walleyes and native yellow perch in Lake Thirteen, Minnesota: A case history of percid community dynamics. North American Journal of Fisheries Management26, 97-107
- nPower, M., van den Heuvel, M.R. (1999) Age-0 yellow perch growth and its relationship to temperature. Transactions of the American Fisheries Society128, 687-700
- nPurchase, C.F., Collins, N.C., Morgan, G.E.,Shuter, B.J. (2005) Predicting life history traits of yellow perch from environmental characteristics of lakes. Transactions of the American Fisheries Society134, 1369-1381
- nRask, M. (1983) Differences in growth of perch (Percafluvatilis L.) in two small forest lakes. Hydrobiologia101, 139-144
- nRempel, L.L., Smith, D.G. (1998) Postglacial fish dispersal from the Mississippi refuge to the Mackenzie River basin. Canadian Journal of Fisheries and Aquatic Sciences55, 893-899
- nRidgeway, L.L.,Chapleau, F. (1994) Study of stunted population of yellow perch (Percaflavescens) in a monospecific lake in Gatineau Park, Quebec. Canadian Journal of Zoology72, 1576-1582
- nRoff, D.A. (1986) Predicting body size with life history models. Bioscience36, 316-323
- nThorpe, J.E. (1977) Morphology, physiology, behavior, and ecology of Percafluviatilis L. and P. flavescensMitchill. Journal of the Fisheries Research Board of Canada34, 1504-1514
- nUrban, M.C. (2007)The growth-predation risk trade-off under a growing gape-limited predation threat. Ecology 88, 2587-2597
- nvan den Heuvel, M.R., Hogan, N.S., Roloson, S.D., Van Der Kraak, G.J. (2012) Reproductive development of yellow perch (Percaflavescens) exposed to oil sands-affected waters. Environmental Toxicology and Chemistry31, 654-662
- nvan den Heuvel, M.R., Power, M., MacKinnon, M.D., Dixon, D.G. (1999a). Effects of oil sands related aquatic reclamation on yellow perch (Percaflavescens). II. Chemical and biochemical indicators of exposure to oil sands related waters. Canadian Journal of Fisheries and Aquatic Sciences56, 1226-1233
- nvan den Heuvel, M.R., Power, M., MacKinnon, M.D., Van Meer, T., Dobson, E.P., Dixon, D.G. (1999b) Effects of oil sands related aquatic reclamation on yellow perch (Percaflavescens). I. Water quality characteristics and perch physiological and population responses. Canadian Journal of Fisheries and Aquatic Sciences56, 1213-1225
- nWalsh, P.S., Metzger, D.A., Higuchi, R. (1991) Chelex 100 as a medium for simple extraction of DNA for PCR based typing from forensic material.Biotechniques10, 506-513.


