Keywords
Image preprocessing; Filtering; Morphological operation; Mahseer; Ultrasonography
Introduction
Tor species, commonly known as Mahseer, are widely distributed throughout Asia from the trans-Himalayan Region to the Mekong River basin to Malaysia, Pakistan, Bangladesh and Indonesia Yadav et al. (2012). In Malaysia, Tor Tombroides locally known as ‘Kelah’, is one of the highly preferred freshwater fish and this species can only be found in pristine freshwater rivers Ismail et al. (2011). Mahseer can be captured in places such as The Royal Belum in Perak, Taman Negara in Pahang and also Andang River in Sarawak. However, this species have been gone through decline, especially in the wild because of the environmental degradation, overfishing and agricultural development Ingram et al. (2005). Mahseer fish are well noted for their inability to reproduce in captivity even though artificial propagation through inducing maturation and ovulation by using a hormonal treatment technique has been attempted Ingram et al. (2005).
In fish breeding production, fish usually spawn when maturation is completed, producing mature eggs and sperm. This process is essential for the breeding and seed production and it is very crucial to monitoring the eggs in the gonad during the maturation life cycle to know how many eggs that already matured and can be spawned. There are several techniques to monitor the eggs such as via endoscopy (Macri et al., 2011), histology (McBride et al., 2013) and ultrasonography (Novelo and Tiersch, 2012). Endoscopy is used in medical and veterinary field to view internal organ via insertion of the instrument into the body cavity through a small incision or urogenital pore (Swenson et al., 2007). While, gonad histology is a microscopic technique that can provide an independent assessment of maturity to validate at-sea classifications, as well as illustrated a more detailed process of oogenesis and maturity (McBride et al., 2013). Endoscopy and histology can be used to determine the egg’s maturation, but this method is invasive and life threatening to the fish.
Ultrasonography is a noninvasive method to determine the egg’s maturation in the fish’s gonad (Colombier et al., 2015). To our knowledge, the fish documented for now are sturgeon ( Chiotti et al., 2016; Petochi et al., 2011; Du et al., 2017; Colombo et al., 2011; Bryan et al., 2007), bass (Macri et al., 2013; Will et al., 2002; Jennings et al., 2005), salmon (Frost et al., 2014), catfish (Guitreau et al., 2012; Bryan et al., 2005; Achionye-Nzeh and Jimoh 2010), halibut (Protopapadakis et al., 2015; Loher and Stephens 2011), rainbow trout (Hliwa et al., 2014), hapuku (Kohn et al., 2013), shark (Whittamore et al., 2010; Daly et al., 2007), thornback ray (Whittamore et al., 2010), haddock (Martin- Robichaud and Berlinsky, 2004), cod (McEvoy, 2009), however ultrasonography on Mahseer has never been documented.
Studies on the ultrasonography image shows that this image can be affected by noise such as speckle noise (Sarode and Deshmukh, 2011). Speckle noise in medical ultrasonography images reduces the contrast and image resolution, which affect the diagnostic value of the ultrasonography imaging. It is also will affected the speed and accuracy of the result when involved in the image processing tasks such as segmentation. To avoid this problem, image preprocessing is needed to eliminate the artifact and enhance the visual appearance of the eggs in the gonad. The aims of this study are (1) to identify which filtering despeckling method that's suitable to eliminate the speckle noise in the gonad ultrasonography image; (2) to formulate ultrasonography preprocessing framework that can be applied to identify eggs in the gonad ultrasonography image.
Literature Review
Chen et al. (2013) applied an adaptive filter named adaptive guided image filtering (AGF) to reduce the speckle noises as a preprocessing stage in muscle motion analysis. From the result, AGF demonstrated the highest Peak-Signal-to-Noise Ratio (PSNR) quantitatively and it is evident that AGF strikes the balance between noise attenuation and detail preservation.
While, Gungor et al. (2015) presented the Homogeneity Map Method (HMM) as a way to improve speckle denoising in edge filters while preserving edges. They combined Speckle Reduction Anisotropic Diffusion (SRAD) and Optimized Bayesian Nonlocal Means (OBNLM) to get the smoother edge filter image, with no loss of edges.
Other than that, Umamaheswari and Vanithamani (2014) proposed Adaptive Window Hybrid Median Filter (AWHMF) for improving the visual quality and also to preserve the fine details in the ultrasound images corrupted by speckle noise for improving clinical diagnosis. The experimental result indicates that the proposed method produces a high PSNR and Edge Preservation Factor (EPF). This high value indicates the edge preservation capability is good.
A novel method capable of denoising speckle noise called Trimmed Non-Local Means (TNLM) have been proposed by Radlak, and Smolka (2014). The main aim is to apply techniques based on the concept of Non-Local Means (NLM) to ultrasonographic images to suppress multiplicative noise. The result show that the proposed method suppresses multiplicative noise and preserve the fine details without introducing artifacts, but from the PSNR, analysis show that OBNLM filter is the superior in filtering the higher noise level.
Hossain, et al. (2014) proposed a new Histogram Equalization (HE) method that can overcome the limitations of the conventional HE methods, which can be used for detecting the shape change of cartilage. The aim is to use a method that can preserve the brightness and detail while enhancing the contrast of the image, this can be done by using Multipurpose Beta Optimized Recursive Bi-Histogram Equalization (MBOBHE) method. From the result, it can be concluded that the proposed method not only enhanced the details of the cartilage, the contrast of the knee joint cartilage also had been improved as well.
Based on the explanation above, there are several image preprocessing methods that can be used to filter the speckle noise in the gonad ultrasonography image, but none of them published for image preprocessing in the fish gonad ultrasonography image. Therefore, this paper will presented the image preprocessing in fish gonad ultrasonography especially in Mahseer’s fish.
Speckle Filtering Methods
There are several techniques have been proposed to filter the speckle noise in ultrasonography image. Ultrasonography speckle filtering techniques includes adaptive filters based on local statistic, anisotropic diffusion and nonlocal means filter.
Adaptive filtering methods
Statistical adaptive filters are basically designed as the smoothing filter, so that the regions within the image that closely resemble the speckle are replaced by a local mean value, while regions with properties that are less similar to speckle are kept unaltered (Ortiz et al., 2012). There are four filters that commonly used, namely (i) Mean filter, ii) Median filter, and (iii) Wiener filter.
(i) Mean filter (Gonzales and Woods, 2008) is the simple filter method because it does not remove the speckle noise, but it will averages with the data. This filter is implemented by a local averaging operation where the value of each pixel is replaced by the average of all values in the local neighborhood (Mahmood et al., 2011). Mean filter can be denoted as in Equation 1.
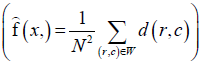
where d(r,c) is the degraded image, N is the window size of the image, W is the set of coordinates in a sub image window of N size and R is the order of the filter. According to Jain et al. (1995), this filter removes high-frequency components, and the sharp detail in the image is lost.
(ii) Median filter (Kirchner and Fridrich, 2010) is a nonlinear technique and used for reducing speckle due to its robustness against impulsive type noise and edge preserving characteristics. According to Mahmood et al. (2011), Median filter has an advantage over Mean filter because it is better without reducing the sharpness of the image and edge preserving and compared to Wiener filter, this filter reduce the speckle noise while keeping the edges and without losing the details. This Median filter can be computed as in Equation 2:
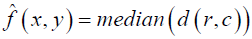
where d (r,c) is the degraded image.
(iii) Wiener filter (Gonzales and Woods, 2008) is used to filter out noise that corrupted the signal. Wiener filter performs smoothing of the image based on the computation of local image (Joel and Sivakumar, 2013). This Wiener filter can be computed as Equation 3:
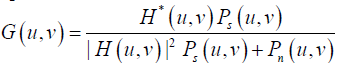
where H (u,v) is the degradation function, H*(u,v) is the complex conjugate of degradation function, Ps(u,v) is the power spectral density of un-degraded image and Pn(u,v) is the power spectral density of the noise. According to Mahmood, et al. (2011), by using Wiener filtering, the speckle was reduced and the image become much sharper than using the median filter, but some details are lost and some are over-enhanced.
Anisotropic diffusion filter
The diffusion equation is a Partial Differential Equation (PDE) that describes the spread of particles from a region of higher concentration to regions of lower concentration (Ortiz et al., 2012). Perona and Malik (Perona and Malik, 1990) proposed the anisotropic diffusion as a generalization of diffusion equation to reduce noise in images by smoothing in homogenous regions without blurring the edges. Later on, Yu and Anton (2002) analyzed the statistical methods for speckle suppression and Perona and Malik’s anisotropic diffusion and developed the speckle reducing anisotropic diffusion method (SRAD). It can be enunciated as in Equation 4:
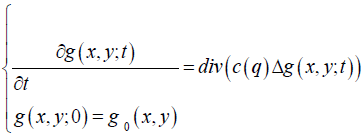
where (c(q) is the diffusion coefficient and g(x,y;t) is the instantaneous coefficient of variation. This diffusion filters also can suffer from over-filtering due to the loss of original information during the diffusion process (Llorden et al., 2015).
Nonlocal means filter (NL-means Filter)
NL-means filter (Kervrann et al., 2007) is an algorithm in image processing for image denoising. The classical formulation of NL means filter can be computed as in Equation 5:
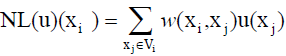
where w(Xi, Xj) is the weight assigned to intensity value and u(Xj) is the restoration of pixel Xi. One of the NL-means filter is Optimized Bayesian Nonlocal Means (OBNLM). According to Coupe et al. (2009), this method efficiently removes the speckle component, while enhancing the edges and preserving the image structures as this method have been experimenting with the variety of ultrasound images such as ultrasound brain image (Eskildsen et al., 2012; Farnia et al., 2015) and ultrasound 3D liver images (Bakas et al., 2012). The optimal Bayesian estimator of a noisefree patch vopt (B) can be written as in Equation 6:

Image quality measurement
It is important to evaluate the quality of the image once the image has been filtered. This is because to determine the suitability of the filtering method in eliminating the speckle noise in the ultrasonography image. Moreover, the image quality measurement can be used as a benchmark for image and video processing system and algorithm, such as compression, restoration, denoising and deblurring techniques (Kaur and Kaur, 2014). There are four types of image quality measurement will discuss which are (i) Signalto- Ratio (SNR), (ii) Peak-Signal-to Ratio (PSNR), (iii) Structural Similarity Index Method (SSIM) and (iv) Edge Preservation Index (EPI).
Signal-to-ratio (SNR)
Signal-to-Ratio (SNR) (Joel and Sivakumar, 2013) is a measure of power of a signal (useful information) and power of background noise (unwanted signal) (Kaur and Kaur, 2014). The ratio usually measured in decibels (dB). The method can be calculated as shown in the Equation 7.
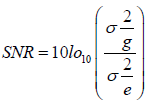
where σg is the variance of signal and σe is the variance of noise. The higher the SNR, the best quality of image produced.
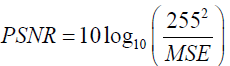
Peak-signal-to-ratio (PSNR)
Peak-Signal-to-Ratio (PSNR) (Joel and Sivakumar, 2013) is an expression for the ratio between the maximum possible value (power) of a signal and the power of distorting noise that affects the quality of its representation (Kaur and Kaur, 2014). To calculate the PSNR, Mean Squared Error (MSE) needs to be calculated by using the Equation 8.
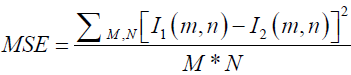
where M and N is the rows and columns of input image. Then, computes the PSNR as shown in Equation 9. This method commonly used to measure the quality of reconstructed images. The signal in this case is original data and the noise is the error introduced (Kaushik and Sharma 2012). The higher the PSNR, the better the quality of the compressed or reconstructed image.
Structural similarity index (SSIM)
Structural Similarity index (SSIM) (Tung and Raveendran, 2009) is a method for measuring the similarity between two images. The SSIM index has been shown to outperform Mean Square Error (MSE) and the related PSNR in measuring the quality of natural images across a wide variety of distortions (Channappayya et al., 2008). This method is calculated on the various windows of an image. This measurement is between two windows x and y of common size N×N as shown in the Equation 10.
where μx is the average of x, μy is the average of y, σx2 is the variance of x, σy2 is the variance of y, σxy is the covariance of x and y, C1=(k1L)2, C1=(k2L)2 are the two variables to stabilize the division with weak dominator, L is the dynamic range of the pixelvalues and K1=0.01 and K2=0.03 by default. The value varies from -1 to 1. If it close to 1, then, the reconstructed image have more similarity than the original.
Correlation coefficient (CoC)
CoC (Vanithamani and Umamaheswari, 2014) is a measure that determines the degree to which two variable's movements is associated. This method also can be the measurement of the similarity of the original image and the despeckled image. The method can be calculated as shown in the Equation 12.
where  and
and  are the mean of the original and denoised image respectively. The correlation coefficient varies from -1 to +1. The value that close to 1, the better quality of image.
Methodology
This study emphasized on image preprocessing methods using speckle filtering that can be used to eliminate the speckle noise in the gonad ultrasonography image which lead to accurately identify the eggs in the gonad. There are several preprocessing stages as mentioned in (Channappayya et al., 2008), (Dixit and Pruthi, 2014) and (Basij et al., 2014). These stages are depended on the type of medical imaging such as Magnetic Resonance Imaging (MRI), Computed Tomography (CT) and ultrasonography. As for this research paper, the methodology of the preprocessing method contains three stages, which are (i) image acquisition, and (ii) filtering speckle noise using speckle filtering methods.
Image acquisition
There are seven raw hardcopy of Mahseer gonad ultrasonography images obtained from ultrasound unit, ALOKA SSD-900 with multifrequency, linear probe (model UST-672- 5/705). The images contain of immature and mature eggs. The images are provided by Agro-Biotechnology Institute (ABI). The original image of gonad ultrasonography is shown in Figure 1.
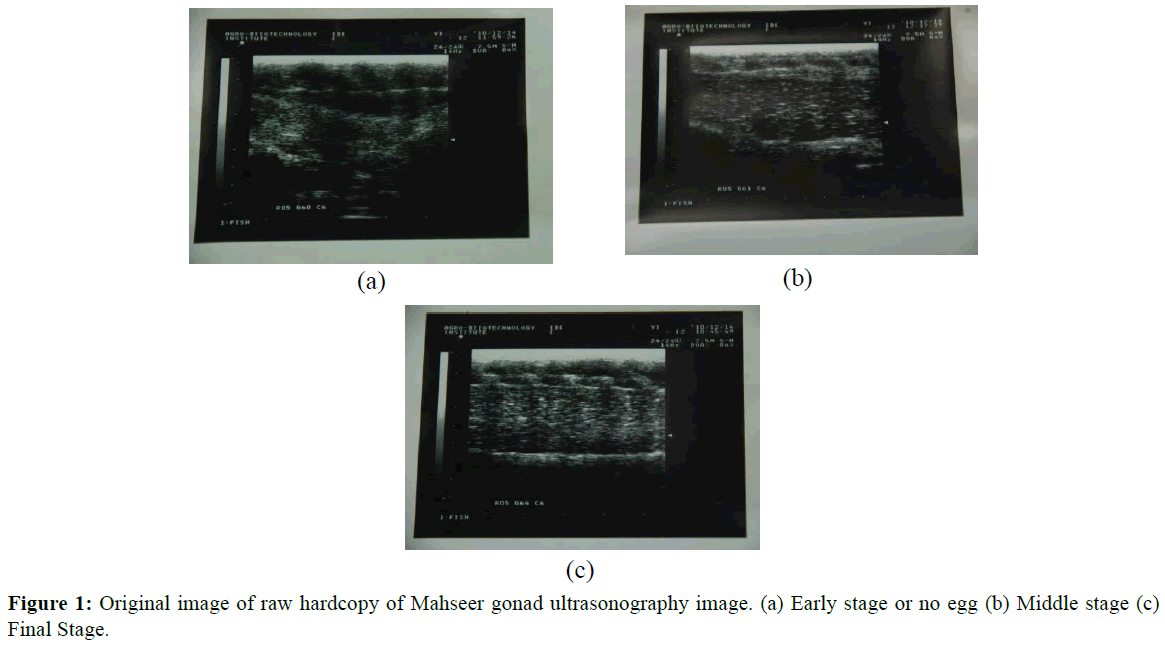
Figure 1: Original image of raw hardcopy of Mahseer gonad ultrasonography image. (a) Early stage or no egg (b) Middle stage (c) Final Stage.
Image cropping and resize the image
In order to process the image, it needs to be digitized and identify the region-of-interest (ROI) by cropping the image. Therefore, the raw image is digitized by capturing the raw image using DSLR Nikon D80 camera. The digitized image then will be converted to grayscale in order to get the standardize format for the preprocessing technique. Once the image has been cropped, the image is resized to 640 × 420 pixels as shown in Figure 2.
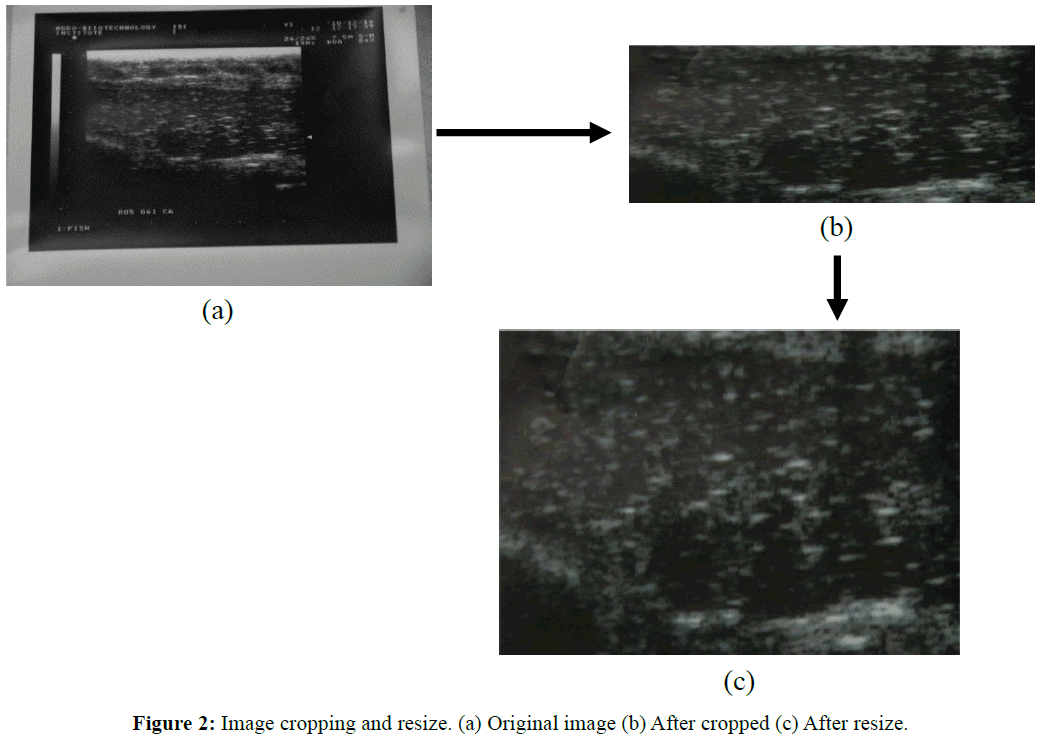
Figure 2: Image cropping and resize. (a) Original image (b) After cropped (c) After resize.
Filtering speckle noise using speckle filtering method
As mentioned previously, it is not easy to differentiate between the speckle noises and eggs at the gonad since there are similar and only have subtle difference. Therefore, the next procedure is to filter the noise in ultrasonography image using speckle filtering method. At this stage, there is an experimental setup to find the suitable filtering methods. Five speckle filtering methods, namely Mean, Median, Wiener, SRAD and OBNLM were tested and compared. In order to evaluate the accuracy of the methods, image quality measurements were used to measure the quality of the image after the image have been filtered.
Results and Discussion
This section will describe the result of the experimental setup that has been conducted in this research study. Mature eggs of gonad ultrasonography images are used because it is easier to evaluate the difference between eggs and the speckle noise for the experiment. As mentioned in the methodology section, the experiment is to find the suitable speckle filtering method in elimination the speckle noise in the ultrasonography image. In this experiment, five speckle filtering methods which are Mean, Median, Wiener, OBNLM (Coupe et al., 2009) and SRAD (Yu and Anton, 2002) will be tested and compared. This experiment will use gonad ultrasonography image as shown in Figure 2c.
There will be preliminary experiment to choose the suitable parameter used in every speckle filtering method mentioned. For Mean, Median and Wiener filter, three window sizes which are 3 × 3, 5 × 5 and 7 × 7 will test and compared. While, for SRAD, three iteration number which are 10, 15 and 20 and for OBNLM, three smoothing parameters which are 0.3, 0.7 and 1.2 will be tested and compared. In order to evaluate the quality of the image, SNR, PSNR and SSMI will be calculated as depicted in Tables 1 and 2.
| Method |
Parameters |
SNR |
PSNR |
SSMI |
| Mean |
3×3 |
27.084 |
38.464 |
0.967 |
| 5 × 5 |
23.918 |
35.299 |
0.945 |
| 7 × 7 |
21.605 |
32.986 |
0.918 |
| Median |
3 × 3 |
31.485 |
42.866 |
0.981 |
| 5 × 5 |
28.028 |
39.408 |
0.963 |
| 7 × 7 |
25.457 |
36.837 |
0.943 |
| Wiener |
3 × 3 |
31.212 |
42.592 |
0.970 |
| 5 × 5 |
27.506 |
38.887 |
0.950 |
| 7 × 7 |
24.788 |
36.168 |
0.938 |
Table 1: Result image quality measurement for mean, median, and wiener with different parameters.
| Method |
Parameters |
SNR |
PSNR |
SSMI |
| SRAD |
10 |
20.080 |
31.461 |
0.936 |
| 15 |
17.337 |
28.718 |
0.911 |
| 20 |
15.383 |
26.764 |
0.887 |
| OBNLM |
0.3 |
8.621 |
20.000 |
0.910 |
| 0.7 |
8.430 |
19.810 |
0.907 |
| 1.2 |
8.234 |
19.615 |
0.898 |
Table 2: Result image quality measurement for SRAD and OBNLM with different parameters.
From the result shows in the Table 1, Mean, Median and Wiener filtering with 3 × 3 window size show the best quality of image because of the higher SNR and PSNR compared to 5 × 5 and 7 × 7 which for the Mean filter, the SNR is 11% higher than 5 × 5 and 20% higher than 7 × 7 for SNR value. As for PSNR is 8% higher than 5 × 5 and 14% higher than 7 × 7. While for the Median filter, the SNR is 10% higher than 5 × 5 and 19% higher than 7 × 7. As for PSNR is higher than 8% higher than 5 × 5 and 14% higher than 7 × 7. Then, as for Wiener filter, the SNR is 11% higher than 5 × 5 and 20% higher than 7 × 7. As for the PSNR is 8% higher than 5 × 5 and 15% higher than 7 × 7. Therefore, from the result mentioned, window size 3 × 3 will be used as the parameter for Mean, Median and Wiener speckle filtering methods.
From the results shown in Table 2, for SRAD filter, it shows that the best image quality goes to 10 iteration number compared to 15 and 20 which the SNR is 13% higher than 15 and 23% higher than 20. As for the PSNR is 8% higher than 15 and 14% higher than 20. While for the OBNLM filter show that 0.3 smoothing parameter has the highest value of SNR and PSNR compared to 0.7 and 1.2 which the SNR is 2% higher than 0.7 and 4% higher than 1.2. As for the PSNR is 1% higher than 0.7 and 2% higher than 1.2. Therefore, from the result mentioned, the best quality image of 10 iteration number for SRAD and 0.3 smoothing parameter for OBNLM will be used as the parameter in the speckle filtering method.
Then, based on this preliminary experiment result, experimental setup to determine the suitable speckle filtering method to remove the speckle noise in ultrasound will be held. As mentioned before, five speckle filtering, which are Mean, Median, Wiener, SRAD and OBNLM are compared as shown in Figure 3.
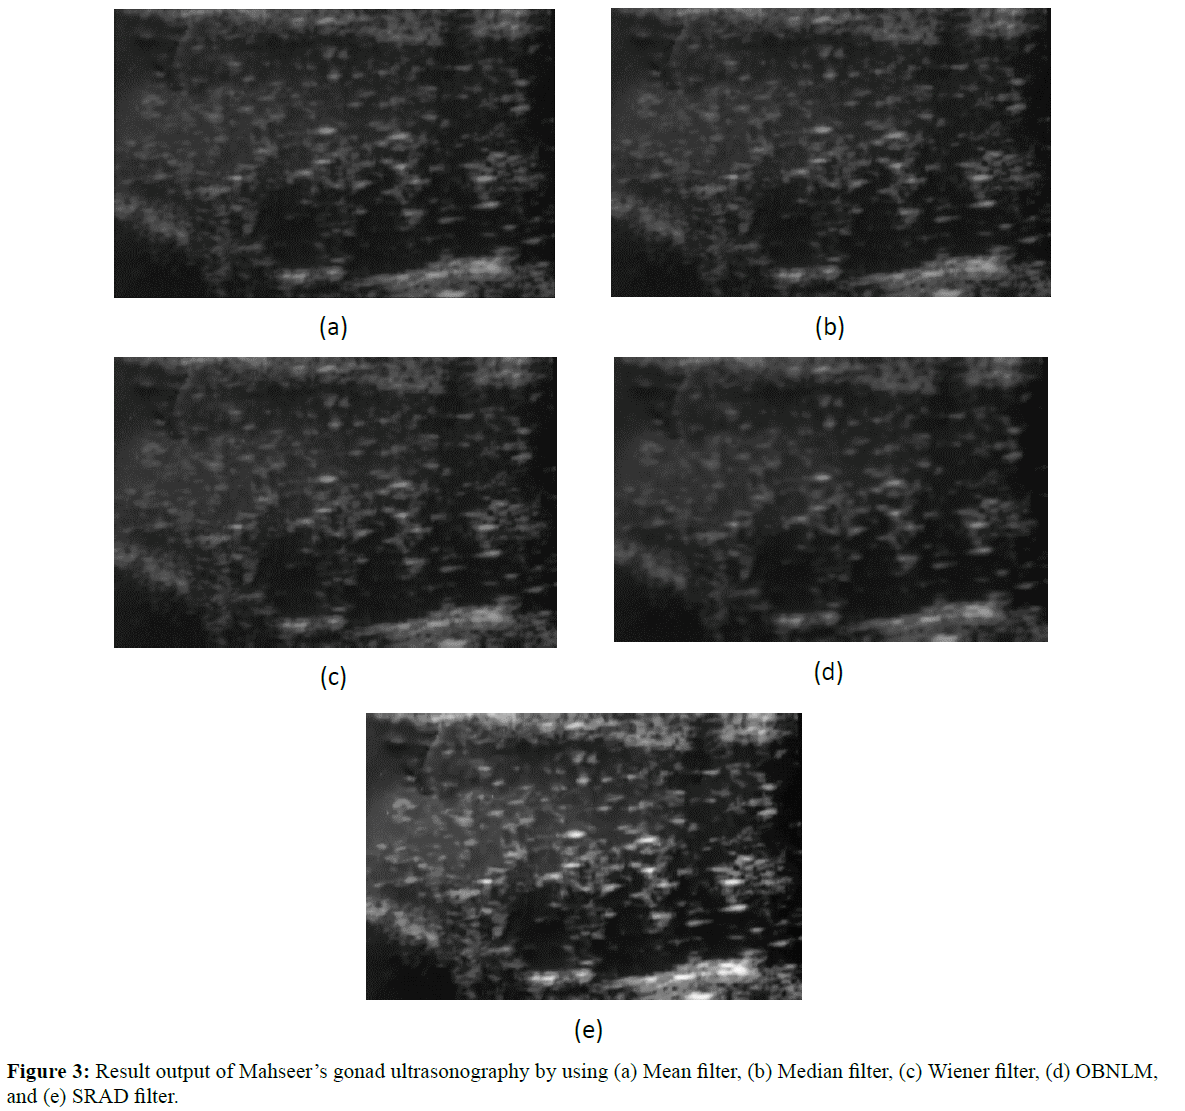
Figure 3: Result output of Mahseer’s gonad ultrasonography by using (a) Mean filter, (b) Median filter, (c) Wiener filter, (d) OBNLM, and (e) SRAD filter.
From the observation in Figure 3, it shows that all the filters can reduce the speckle well, but Mean filter will remove the highfrequency components and the sharp detail in the image is lost. While the Median filter cannot distinguish fine detail from noise, but it has better visualization compared to Wiener. This is because the eggs can easily be detected and the contrast is better. Wiener filter will make some details lost and some are over-enhanced and make the image more blurry. OBNLM can lead to over-filtering due to the loss of original information during diffusion process and SRAD also can lead to over-filtering by damaging some image details although it can smooth out speckle effectively.
To prove the observation, the images will be evaluated by using PSNR, SNR and SSMI to evaluate the quality of the image as depicted in Table 3.
| Method |
SNR |
PSNR |
SSMI |
| Mean |
27.084 |
38.464 |
0.967 |
| Median |
31.485 |
42.866 |
0.981 |
| Wiener |
31.212 |
42.592 |
0.970 |
| SRAD |
20.080 |
31.461 |
0.936 |
| OBNLM |
8.621 |
20.000 |
0.910 |
Table 3: Result image quality measurement for mean, median, wiener, SRAD and OBNLM.
From the result of evaluations show in Table 3, Median speckle filtering method is the best speckle filtering because of the higher PSNR and SNR compared to other four speckle filtering methods which the SNR value for Median is 31.485 which is 14% higher than Mean, 1% higher than Wiener, 36% higher than SRAD and 73% higher than OBNLM. As for PSNR value for Median is 42.866 which is 10% higher than Mean, 1% higher than Wiener, 27% higher than SRAD and 53% higher than OBNLM.
Finally, the framework of image preprocessing methodology for identification of Mahseer’s eggs in the gonad ultrasonography image has been proposed as shown in Figure 4. This framework is used to identify the eggs and eliminate the speckle noise from the gonad ultrasonography image.
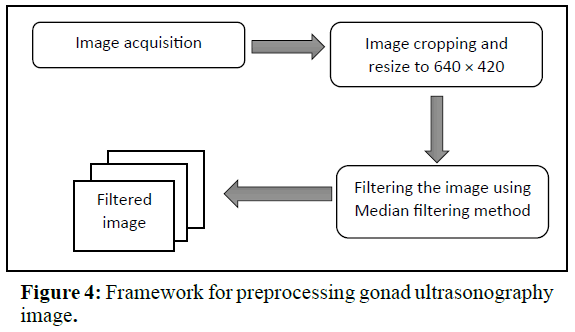
Figure 4: Framework for preprocessing gonad ultrasonography image.
Conclusions
In the present works, a framework of the preprocessing gonad ultrasonography image has been discussed. The result shows that this preprocessing method by using the Median speckle filtering method in the gonad ultrasonography image is the best method to eliminate the speckle noise or other spot other than the eggs in the image especially in Mahseer’s gonad ultrasonography image. To our knowledge, this is the first report on the use of ultrasonography and for preprocessing Mahseer’s ultrasonography image. This noninvasive tool can then obviously be utilized to improve and monitor the gonad maturation of Mahseer’s fish. Ultrasonography thus has great potential for use in Mahseer’s fish both for conservation and aquaculture.
Acknowledgments
The authors would like to thank to Agro-Biotechnology Institute (ABI), MARDI especially Mrs Nazrien binti Kaman for providing the ultrasound images of Mahseer’s fish and for the cooperation throughout the research study conducted.
19573
References
- Yadav, K., Lakra, W.S., Sharma, J., Goswami, M., Singh, A. (2012) Development and characterization of a cell line TTCF from endangered mahseerTor tor (Ham.). Fish PhysiolBiochem38, 1035-1045.
- Ismail, M.F.S., Siraj, S.S., Daud, S.K., Harmin, S.A. (2011) Association of annual hormonal profile with gonad maturity of mahseer (Tor tambroides) in captivity. Gen Comp Endocrinol170, 125-130.
- Ingram, B., Sungan, S., Gooley, G., Sim, S. Y., Tinggi, D. et al. (2005) Induced spawning, larval development and rearing of two indigenous malaysianmahseer, Tor tambroides and T.douronensis. Aquacult Res36, 1001-1014.
- Macri, F., Rapisarda, G., Marino, G., Majo, M. De, Aiudi, G. (2011) Use of Laparoscopy for the Evaluation of the Reproductive Status of Tench (Tincatinca).Reproduct Domestic Animals46, 130-133.
- McBride, R. S., Wuenschel, M. J., Nitschke, P., Thornton, G., King, J.R. (2013) Latitudinal and stock-specific variation in size- and age-maturity of female winter flounder, Pseudopleuronectesamericanus, as determined with gonad histology. J Sea Res75, 41-51.
- Swenson, E.A., Rosenberger, A.E., Howell, P.J. (2007) Validation of Endoscopy for Determination of Maturity in Small Salmonids and Sex of Mature Individuals. Trans Am Fish Soc136, 994-998.
- McBride, R.S., Wuenschel, M.J., Nitschke, P., Thornton, G., King, J.R. (2013) Latitudinal and stock-specific variation in size- and age-at-maturity of female winter flounder, Pseudopleuronectesamericanus, as determined with gonad histology. J Sea Res 75, 41-51.
- Colombier, S.B. du, Jacobs, L., Gessets, C., Elie, P., Lambert, P. (2015).Ultrasonography as a non-invasive tool for sex determination and maturation monitoring in silver eels.Fish Res164, 50-58.
- Chiotti, J.A., Boase, J.C., Hondorp, D.W., Briggs, A.S. (2016) Assigning Sex and Reproductive Stage to Adult Lake Sturgeon using Ultrasonography and Common Morphological Measurements. North Am JFish Manage 36, 21-29.
- Petochi, T., Marco, P.D., Donadelli, V., Longobardi, A., Corsalini, I. et al. (2011) Sex and reproductive stage identification of sturgeon hybrids (Acipensernaccarii x Acipenserbaerii) using different tools: ultrasounds, histology and sex steroids. J Applied Ichthyol27, 637-642.
- Du, H., Zhang, X., Leng, X., Zhang, S., Luo, J., et al. (2017) Gender and gonadal maturity stage identification of captive Chinese sturgeon, Acipensersinensis, using ultrasound imagery and sex steroids. Gen and CompEndocrinol245, 36-43.
- Colombo, R.E., Wills, P.S., Garvey, J.E. (2011) Use of Ultrasound Imaging to Determine Sex of Shovelnose Sturgeon. North Am JFishManagement24, 322-326.
- Bryan, J.L., Wildhaber, M.L., Papoulias, D.M., DeLonay, A.J., Tillitt, D.E., et al. (2007) Estimation of gonad volume, fecundity, and reproductive stage of shovelnose sturgeon using sonography and endoscopy with application to the endangered pallid sturgeon. JApplied Ichthyol23, 411-419.
- Macri, F., Liotta, L., Bonfiglio, R., Stefano, C. De, Ruscica, D., et al. (2013) Ultrasound measurement of reproductive organs in juvenile European sea bass Dicentrarchuslabrax. JFish Biol83, 1439-1443.
- Will, T.A., Reinert, T.R., Jennings, C.A. (2002) Maturation and fecundity of a stock-enhanced population of striped bass in the Savannah River Estuary, USA. J Fish Biol60, 532-544.
- Jennings, C.A., Will, T.A., Reinert, T.R. (2005) Efficacy of a high- and low- frequency ultrasonic probe for measuring ovary volume and estimating fecundity of striped bass Moronesaxatilis in the Savannah River Estuary. J Fish Res76, 445-453.
- Frost, D.A., McAuley, W.C., Kluver, B., Wastel, M., Maynard, D., et al. (2014) Methods and Accuracy of Sexing Sockeye Salmon Using Ultrasound for Captive Broodstock Management. North Am J Aquacult76, 153-158.
- Guitreau, A.M., Eilts, B.E., Novelo, N.D., Tiersch, T.R. (2012) Fish Handling and Ultrasound Procedures for Viewing the Ovary of Submersed, Nonanesthetized, Unrestrained Channel Catfish. North Am J Aquaculture 74, 182-187.
- Bryan, J.L., Wildhaber, M.L., Noltie, D.B. (2005) Examining neoshomadtom reproductive biology using ultrasound and artificial photothermalcycles. J Aquacult67, 221-230.
- Achionye-Nzeh, C.G., Jimoh, K.O. (2010) Ultrasound evaluation of the gonads in catfish clariasgariepinus (Teugels): An Initial Experience in Africa.World Journal of Fish and Marine Sciences 2, 343-347.
- Protopapadakis, L., Penttila, K., Dowd, W.W. (2015) Management and Ecological Note: Testing a non-lethal method for determining the sex of California halibut, Paralichthyscalifornicus, in non-spawning condition. JFish ManagEcol22, 432-435.
- Loher, T., Stephens, S.M. (2011) Use of Veterinary Ultrasound to Identify Sex and Assess Female Maturity of Pacific Halibut in Nonspawning Condition. North Am J Fish Manage31, 1034-1042.
- Novelo, N.D., Tiersch, T.R. (2012) A Review of the Use of Ultrasonography in Fish Reproduction.North Am JAquaculture74, 169-181.
- Hliwa, P., Bah, M., Kuz´min´ski, H., Dobosz, S. (2014) Ultrasound evaluation of the gonadal structure in sex-reversed rainbow trout females. Aquaculture International 22, 89-96.
- Kohn, Y.Y., Lokman, P.M., Kilimnik, A., Symonds, J.E. (2013) Sex identification in captive hapuku (Polyprionoxygeneios) using ultrasound imagery and plasma levels of vitellogenin and sex steroids. Aquaculture 384, 87-93.
- Whittamore, J.M., Bloomer, C., Hanna, G. M., McCarthy, I.D. (2010) Evaluating ultrasonography as a non-lethal method for the assessment of maturity in oviparous elasmobranchs. Marine Biol157, 2613-2624.
- Daly, J., Gunn, I., Kirby, N., Jones, R., Galloway, D. (2007) Ultrasound Examination and Behaviour Scoring of Captive BroadnoseSevengill Sharks, Notorynchuscepedianus (Peron, 1807). Zoo Biol26, 383-395.
- Martin-Robichaud, D.J., Berlinsky, D.L. (2004) The effects of photothermal manipulations on reproductive development in female haddock Melanogrammusaeglefinus. Aquaculture Res35, 466-472.
- McEvoy, F.J., Tomkiewicz, J., Stottrup, J.G., Overton, J.L., McEvoy, C., et al. (2009).Determination of Fish Gender Using Fractal Analysis of Ultrasound Images. Veterinary Radiology and Ultrasound 50, 519-524.
- Sarode, M.V., Deshmukh, P.R. (2011) Reduction of Speckle Noise and Image Enhancement of Images Using Filtering Technique.Int J Advancements Technol2, 30-38.
- Dixit, V., Pruthi, J. (2014) Review of Image Processing Techniques for Automatic Detection of Tumor in Human Liver.Int J Computer SciMobile Comput3, 371-378.
- Chen, Y., Zhou, Y., Ivanov, K., Li, J., Shu, Y., et al. (2013) Pre-processing for Muscle Motion Analysis: Adaptive Guided Image Filtering for Speckle Reduction of Ultrasound Images. In 35th Annual International Conference of the IEEE EMBS Osaka, Japan pp: 4026-4029.
- Gungor, M.A., Karagoz, I. (2015) The homogeneity map method for speckle reduction in diagnostic ultrasound images. Measurement68, 100-110.
- Umamaheswari, G., Vanithamani, R. (2014)An adaptive window hybrid median filter for despeckling of medical ultrasound images. J Scientific and Industrial Res73, 100-102.
- Radlak, K., Smolka, B. (2014) Adaptive Non-local Means Filtering for Speckle Noise Reduction. In International Conference on Computer Vision and Graphics pp: 518–525.
- Hossain, M.B., Lai, K.W., Pingguan-Murphy, B., Hum, Y.C., Salim, M.I.M., et al. (2014)Contrast enhancement of ulrasound imaging of the knee joint cartilage for early detection of knee osteoarthritis. BiomedSignal Proces13, 157-167.
- Ortiz, S.H.C., Chiu, T., D.Fox, M. (2012) Ultrasound image enhancement: A review. BiomedSignal Proces7, 419-428.
- C.Gonzales, R.E., Woods, R. (2008) Digital Image Processing: Third Edition: Pearson Prentice Hall.
- Jain, R., Kasturi, R., Schunck, B.G. (1995) Machine Vision. McGraw-Hill, Inc.
- Kirchner, M., Fridrich, J. (2010) On Detection of Median Filtering in Digital Images. Paper presented at the Media Forensic and Security II, San Jose, California.
- Mahmood, N.H., Razif, M.R.M., Gany, M.T.A.N. (2011) Comparison between Median, Unsharp and Wiener filter and its effect on ultrasound stomach tissue image segmentation for Pyloric Stenosis. Int JApplied SciTechnol1, 218-226.
- Joel, T., Sivakumar, R. (2013)Despeckling of Ultrasound Medical Images: A Survey. JImage and Graphics 1, 161-165.
- Perona, P., Malik, J. (1990) Scale-Space and Edge Detection Using Anisotropic Diffusion. IEEE Transactions on Pattern Analysis and Machine Intelligence 12, 629-639.
- Yu, Y., Anton, S.T. (2002) Speckle Reducing Anisotropic Diffusion. IEEE Transactions on Image Processing 11, 1260-1270.
- Llorden, G.R., Vegas-Sanchez-Ferrero, G., Martin-Fernandez, M., Alberola-Lopez, C., Aja-Fernandez, S. (2015) Anisotropic Diffusion Filter with Memory Based on Speckle Statistics for Ultrasound Images. IEEE Transactions on Image Proces24, 345-358.
- Kervrann, C., Boulanger, J., Coupé, P. (2007) Bayesian non-local means filter, image redundancy and adaptive dictionaries for noise removal. InScale Space and Variational Methods in Computer Vision. Springer-Verlag Berlin, Heidelberg pp: 520-532.
- Coupe, P., Hellier, P., Kervrann, C., Barillot, C. (2009) Nonlocal Means-Based Speckle Filtering for Ultrasound Images.IEEE Transaction on Image Proces18, 2221-2229.
- Kaur, R., Kaur, P. (2014) A Novel Approach for Despeckling of Ultrasound Images. International Journal of Computer Science and Mobile Comput3, 618-622.
- Kaushik, P., Sharma, Y. (2012) Comparison of Different Image Enhancement Techniques Based Upon Psnr and Mse. Int J Applied Engineering Res 7.
- Tung, K.H., Raveendran, P. (2009) A Survey of Image Quality Measures. Paper presented at the 2009 International Conference for Technical Postgraduates (TECHPOS), Kuala Lumpur.
- Channappayya, S., Bovik, C., Caramanis, C., Robert W.H. (2008) SSIM-Optimal Linear Image Restoration. Paper presented at the IEEE International Conference on Acoustics, Speech and Signal Processing (ICASSP), Las Vegas, NV.
- Vanithamani, R., Umamaheswari, G. (2014) Speckle Reduction in Ultrasound Images using Neighshrink and Bilateral Filtering. J Computer Sci10, 623-631.
- Kumar, D.A. (2015) A new Method on Brain MRI Image Preprocessing for Tumor Detection. International J Scientific Res in Sci, EngTechnol1, 40-44.
- Basij, M., Taki, A., Yazdchi, M. (2014) Automatic Shadow Enhancement in Intra Vascular Ultrasound (IVUS) Images. Paper presented at the 2014 Middle East Conference on Biomedical Engineering (MECBME), Doha, Qatar.
- Eskildsen, S.F., Coupe, P., Fonov, V., Manjon, J.V., Leung, K.K., et al. (2012) BEaST: Brain extraction based on nonlocal segmentation technique. NeuroImage59, 2362-2373.
- Farnia, P., Ahmadian, A., Shabanian, T., Serej, N.D., Alirezaie, J. (2015) Brain-shift compensation by non-rigid registration of intra-operative ultrasound images with preoperative MR images based on residual complexity. Int J Computer Assisted RadiolSurg10, 555-562.
- Bakas, S., Chatzimichail, K., Hoppe, A., Galariotis, V., Hunter, G., et al. (2012) Histogram-based Motion Segmentation and Characterisation of Focal Liver Lesions in CEUS. Annals of the BMVA 7, 1-14.


