Key words
Mineral utilization, Dicalcium phosphate, Diet, C. gariepinus
Farkli Kaynakl? Kalsiyum ve Fosfor Diyetleriyle Beslenen Clarias gariepinus’ un Büyüme ve Ekonomik Performans?
Ortalama a??rl??? 53 g olan 150 genç Clarias gariepinus rastgele olarak üç tekrarl? ve her tankta (52.5 X 33.5 X 21 cm3) 7 bal?k olacak ?ekilde stokland?. Yedi deneysel diyet kalsiyum ve fosfor kaynaklar?n?n de?i?ik içerikli seviyeleriyle formüle edildi. Bunlar; Diyet 1 (% 1 dikalsiyumfosfat ve % 1 yumurta kabu?u), Diyet 2 (% 2 dikalsiyumfosfat), Diyet 3 (% 2 yu-murta kabu?u), Diyet 4 (% 1 kemik unu ve % 1 istiridye kabu?u), Diyet 5 (% 1 yumurta ka-bu?u ve % 1 kemik unu), Diyet 6 (% 0.5 yumurta kabu?u, % 1 kemik unu ve % 0.5 istiridye kabu?u) ve Diyet 7 herhangi bir kalsiyum yada fosfor kayna??na sahip olmayan diyetlerden olu?maktad?r. Ortalama a??rl?k art??? (OAA) ve spesifik büyüme oran? (SBO) sonuçlar? test deneyleri kar??s?nda belirli bir farkl?l?k (p<0.05) gösterdi. Diyet 2 en yüksek OAA ve SBO gösterdi (63.5 ve %2.13 /gün s?ras?yla). Di?er yandan Diyet 4 en iyi protein yeterlilik oran? (3.01) ve yem dönü?üm oran?na (0.96) sahipken Diyet 2 ayr?ca protein al?m? için en yüksek de?eri (23.09) gösterdi. Diyet 2 (% 2 dikalsiyumfosfat) di?er diyetlerle kar??la?t?r?larak test edilen ekonomik endeksler içinde net kar de?eri, yat?r?m maliyet analizi ve brüt kar için dikkat çekici belirli farkl?l?k (p<0.05) kaydedilmi?tir. Bu nedenle, çal??madan elde edilen sonuçlar C. gariepinus’ un büyümesi için optimum ihtiyaç duyulan miktar olarak dikalsiyumfosfat’ ?n % 2 civarlar?ndaki seviyesi önerilmektedir.
Anahtar Kelimeler: Mineral kullan?m?, Dikalsiyum fosfat, Diyet, C. gariepinus
Introduction
Nutrition is the process by which organisms obtain food and use it for metabolic processes, growth and repair of worn out tissues. It is highly important in aquaculture as it carries about 60-70% of the total cost of production (Ayinla and Ajayi, 1996). Fish needs feeds to grow, irrespec-tive of the good health, quality or condition of their environment and if this is not adequately supplied, a malnourish condition may occur (Fagbenro, 1987).
Mineral elements are inorganic substances, present in animal body including fish and are necessary for the maintenance of certain physico-chemical processes in the tissues and fluids. They may be broadly classified as macro elements which include calcium, phosphorus, sodium and chloride while the micro elements include iron, copper, cobalt, potassium, magnesium, iodine, zinc, manganese, molybdenum, fluoride, chro-mium, selenium and sulfur (Soetan et al., 2010).
According to Nwanna et al. (2009) Calcium and Phosphorus make up 70% of the total min-eral elements in the body and are essential for the formation of bone, energy transfer through aden-osine triphosphate (ATP) and an essential com-ponent of buffer systems in the blood. McDowell (1992) noted that Phosphorus is involved in the control of appetite, weight and feed efficiency while Waldroup, (1999) asserted that inadequate supply of Phosphorus may lead to severe conse-quences in terms of reduced performance, exces-sive mortality, and reduction in carcass quality.
Dietary calcium plays a pivotal role in the regu-lation of energy metabolism and fish rely entirely on calcium present in water during dietary cal-cium deprivation (Ichii and Mugiya, 1983).
There are various sources of calcium and phosphorus among which are bone meal, egg shell, dicalcium phosphate (DCP) and oyster shell. These sources have different proportion of calcium and phosphorus; some are rich in cal-cium while others are rich in phosphorus. The objectives of this study are to investigate the re-sponse of C. gariepinus to different sources of calcium and phosphorus in terms of growth, nu-trient utilization and cost implication of utilizing any of these sources.
Materials and Methods
Experimental design
The experiment was a complete randomized design with seven experimental diets in tripli-cates for a period of nine weeks, at the Fish Nu-trition Unit of the Department of Marine Sci-ences, Faculty of Science, and University of Lagos, Nigeria.
Experimental feed preparation
Egg shell was collected from the food sellers and other ingredients which include indomie waste, fish meal, soy beans meal, dicalciumphos-phate, salt, red oil, vitamin premix, groundnut cake, oyster shell, bone meal were bought from Shoreman Agro Product, Ikotun Lagos, Nigeria.
Egg shell was sun-dried for 4 days, crushed and milled into very fine powder. Other ingredi-ents; oyster shell, bone meal, groundnut cake and soy bean meal were ground separately to 1mm size with hammer mill and stored till when needed. The proximate compositions of feed in-gredients were determined at the Department of Animal Science, Faculty of Agriculture, Univer-sity of Ibadan, Nigeria according to the Associa-tion of Analytical Chemists Method (AOAC, 2004) (Table 1).
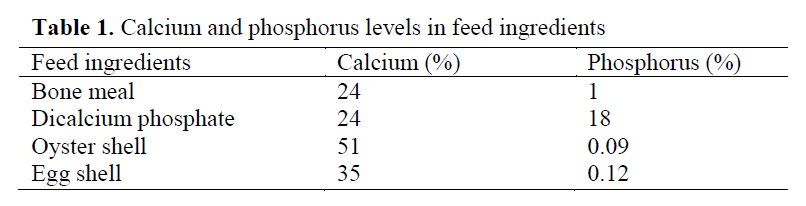
Table 1. Calcium and phosphorus levels in feed ingredients
Feed formulation
Seven isonitrogenous and isocalorific experi-mental diets were formulated using different sources of calcium and phosphorous sources. Diet 1 (1 % DCP and 1 % Egg shell), Diet 2 (2 % DCP), Diet 3 (2 % Egg shell), Diet 4 (1 % Bone meal and 1 % Oyster shell), Diet 5 (1 % Egg shell and 1 % Bone meal), Diet 6 (0.5 % Egg shell, 1 % Bone meal and 0.5 % Oyster shell) and Diet 7 (control diet) had no extra calcium or phosphorus source (Table 2).
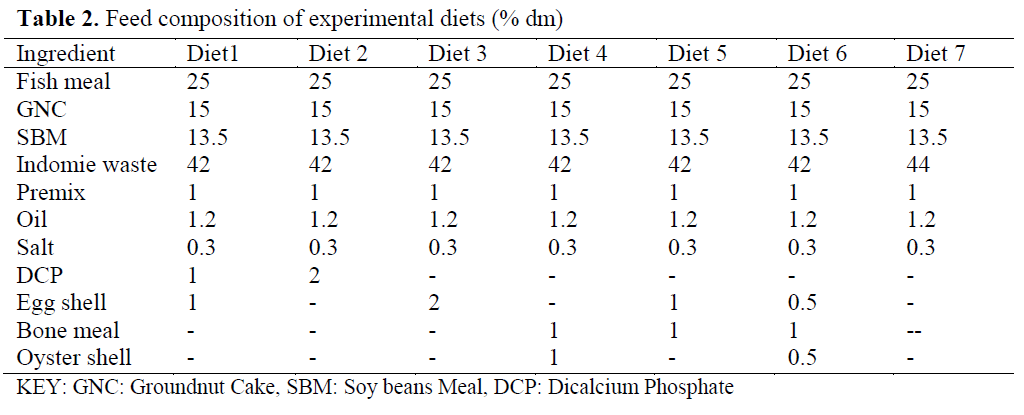
Table 2. Feed composition of experimental diets (% dm)
Experimental fish
One hundred and fifty (150) juveniles of Afri-can catfish, Clarias gariepinus were bought from Fuard Farms at Cele, Ikotun-Egbe, Lagos and transported in aerated aquaria. The fish were ac-climatized for a period of 2 weeks, during which they were fed with 2mm coppens feed from Hol-land. Twenty-one plastic tanks, of dimension 52.5 x 33.5 x 21cm3, with seven (7) fish (average weight 53g) stocked per tank and each treatment run in triplicate. Tanks were covered with nylon net of mesh size 3mm to prevent fish from jumping out of the tanks.
Feeding trials
Fish were fed to satiation by hand thrice daily; the feeding time was divided into three 08:00, 12:00 and 16:00 hours every day. Fish were weighed on weekly basis, water in the tanks were changed every two (2) days and replaced with de-chlorinated water from a borehole to maintain good water quality. Fish were monitored daily for mortality, physical and behavioral changes throughout the experimental period.
Growth performance and Nutrient Utilization
Growth and nutrient utilization were esti-mated in terms of Mean weight gain, Specific growth rate, Feed conversion ratio and Protein efficiency ratio following Kaur and Saxena (2004).
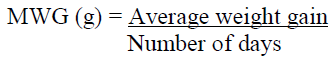
(1) Mean Weight Gain (MWG)
(2) Specific Growth Rate (SGR)
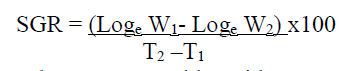
Where e = natural logarithm
T2 –T1= Experimental Period
W1 = Initial Weight
W2 = Final Weight
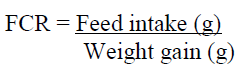
(3) Feed Conversion Ratio (FCR)
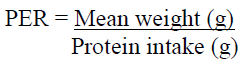
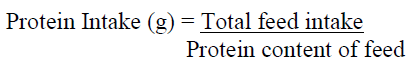
(4) Protein Efficiency Ratio (PER)
Economy of feed production and rearing of fish
The cost was based on current prices of feed ingredients in the experimental locality (Nigeria) at the time of the experiment. The economic evaluations of the diets were calculated from the following methods (New, 1989; Aderolu and Oyedokun, 2008).
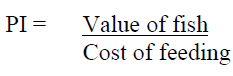
(1) Profit Index (PI)
(2) NPV = Mean Weight Gain x Total number of fish (n) x cost per kg of fish
(3) Investment Cost Analysis = Cost of feeding ($) + Cost of Juveniles stocked ($)
(4) Gross Profit (GP)
GP = Net Profit Value (NPV) – Investment Cost Analysis
Statistical analysis
All data collected were subjected to analysis of variance (ANOVA). Comparisons among means were carried out using Duncan Multiple Range test (Duncan, 1955) at significance level of 0.05.
Results and Discussion
The final weights of fish were not signifi-cantly different (p > 0.05) among fish fed treated Diets and the control group except, fish fed with Diet 2 which recorded the highest weight gain while fish fed Diet 3 recorded the least weight gain (Table 3).
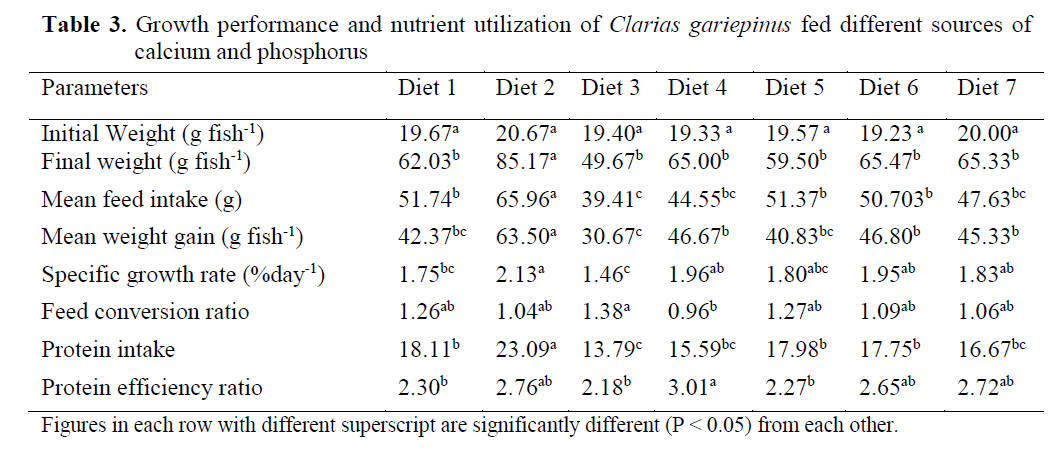
Table 3. Growth performance and nutrient utilization of Clarias gariepinus fed different sources of calcium and phosphorus
Similarly, significant difference (p < 0.05) was recorded with Diet 2 in the values of Mean feed intake (MFI), Mean weight gain (MWG) and Specific growth rate (SGR) compared to other experimental diets. However, the best performance in Feed conversion ratio (FCR) and Protein efficiency ratio (RER) was recorded in fish fed Diet 4 followed by Diet 2 while the least performance was recorded with fish fed Diet 3. Though there was significant difference (p < 0.05) in the value of Protein intake (PI) across treatments, Diet 2 had the highest value while the least value was recorded in fish fed Diet 3 (Table 3).
Fish fed Diet 2 (2% DCP) recorded remarka-ble significant different (p < 0.05) values for the Net profit value, Investment cost analysis and Gross profit for the tested economic indices com-pared to other experimental Diets. Conversely, no significant difference (p > 0.05) was recorded in the value of Profit index (Pin) across treat-ments with the exception of Diets 1, 4 and 5 (Table 4).
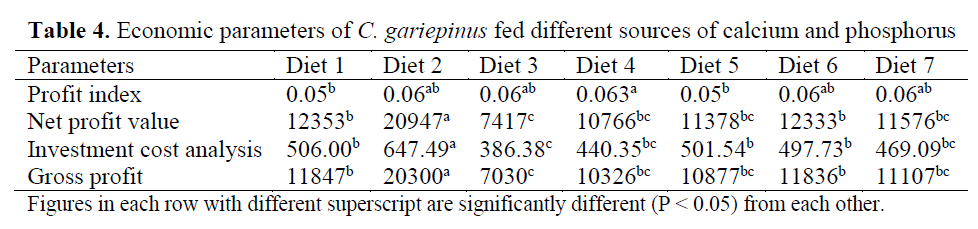
Table 4. Economic parameters of C. gariepinus fed different sources of calcium and phosphorus
The utilization of DCP (2%) corresponded to the highest weight gain and protein feed intake, while the sole use of eggshell at 2% resulted in significant reduction in weight gain and nutrient utilization. Increased phosphorus inclusion in fish diet by 1% have been found to have positive cor-relation with increased feed intake and invariably growth when the phosphorus in the diet is below the nutritional demand of the fish (Roy and Lall, 2003). Phosphorus is a growth promoter when supplied at optimal concentration in animal feeds and this could probably account for the better re-sult obtained with Diet 2. This result was corrob-orated by Coloso et al. (2003) who stated that in-crease in the concentration of available dietary phosphorus from 0.24 to 0.88 % modestly en-hanced the growth of rainbow trout. Dietary re-quirement of phosphorus in channel catfish is less than 10 g/kg (Eya and lovell, 1997), while Mgbenka and Ugwu (2005) reported that the re-quirement of hybrid African catfish (Clarias gariepinus x Heterobranchus bidorsalis) is about 10 g P kg-1 diet but the problem of actual amount of phosphorus availability for the fish physio-logical demand can be a factor in the utilization index of this mineral.
According to Nakamura (1982), mineral defi-ciency signs often arise from a dietary imbalance of calcium and phosphorus due to the antagonis-tic effect of excess dietary calcium on the ab-sorption of phosphorus. This may be responsible for the least weight gain observed in Diet 3 (2% Egg shell) which has a very low amount of phos-phorus (0.12%) compared to calcium (35%). Equally, Andrew et al. (1973) and Cowey and Sargent (1979), also reported that when there is an excess of calcium in comparison with phos-phorus, the latter is not absorbed by the intestine because it is combined with the calcium to form calcium phosphate that is biologically unavaila-ble. Calcium-phosphate-phytate complexes also bind directly to starches (Thomson, 1988), inhibit alpha-amylase action (Deshpande and Cheryan, 1984) thereby lowering starch solubility and di-gestibility (Knuckles and Betschart, 1987).
Furthermore, the insignificant mean weight gain, specific growth rate and elevated feed con-version ratio of the fish fed with the diet low in phosphorus but high in calcium is in consonance with the report of Gatlin and Phillips (1989) who reported that dietary deficiency of phosphorus caused reduced growth and body content of cal-cium and phosphorus of Channel catfish. The result also agreed with Chavez- Sanchez et al. (2000) who reported that American cichlid (Cichlasoma urophthalmus) exhibited reduced growth and high conversion ratio when fed with diet deficient in phosphorus. Though there was marginal similarity in the profit index across treatments however, Diet 2 recorded the highest values for the net profit value, investment cost analysis and gross profit.
Conclusions
Consequently, Dicalcium phosphate which rec-orded optimal performance in growth rate, nutri-ent utilization and economic parameters is hereby recommended at 2 % inclusion level in the diet of C. gariepinus.
517
References
- Aderolu, A.Z., Oyedokun, G.T., (2008). Compar-ative utilization of biodegraded rice husk in the diets of Clariasgariepinus, Journal of Fisheries and Aquatic Science, 3(5): 312-319. doi: 10.3923/jfas.2008.312.319
- nAndrews, J.W., Murai, T., Campbell, C., (1973). Effects of dietary calcium and phosphorus on growth, food conversion, bone ash and hematocrit levels of catfish, Journal of Nu-trition, 103: 766-771
- nAyinla, O.A., Ajayi, T.O., (1996). African Aqua-culture Fertilization: A model for family holding integration and viability. In: Aqua-culture in Africa, K.O. Adeniyi, (Ed.), Pro-ceedings of the 4th session of inter-Africa Committee on Oceanography sea and inland fisheries, pp: 109-114
- nA.O.A.C., (Association of Official Analytical Chemists) (2004). Official methods of anal-ysis. Vol. I & II, 15th edition, H. Kenneth, (Ed.). Arlington, Virginia, USA., 1298pp
- nChavez-Sanchez, C., Martinez-Palacios, C.A., Martinez-Perez, G., Ross, L.G., (2000). Phosphorus and calcium requirements in the diets of the American cichlid Cichlasomaurophthalmus(Gunther), Aquaculture Nu-trition, 6: 1-9. doi: 10.1046/j.1365-2095.2000.00118.x
- nColoso, M.R., King, K., Fletcher, J.W., Hendris, M.A., Subramanyam, M., Weis, P., Ferraris, R.P., (2003). Phosphorus utilization in rain-bow trout (Oncochyncusmykiss) fed practi-cal diets and its consequences on effluent phosphorus levels, Aquaculture, 220: 801-820. doi: 10.1016/S0044-8486(02)00403-9
- nCowey, C.B.,. Sargent, J.R., (1979). Nutrition In: W.S. Hoar and J. Randall, (Eds.), Fish Physiology, Vol. III. Academic Press, New York, N.Y. USA.,pp: 1-69
- nDeshpande, S.S., Cheryan, M., (1984). Effects of phytate, divalent cations and their implica-tions on alpha-amylase activity, Journal of Food Sciences, 49: 516- 524. doi: 10.1111/j.1365-2621.1984.tb12456.x
- nDuncan, D.B., (1955). Multiple F- test., Biomet-rics, 11: 1-4. doi: 10.2307/3001478
- nEya, J.C., Lovell, R., (1997). Available phospho-rus requirements of food size channel catfish (Ictaluruspunctatus) fed practical diets in ponds, Aquaculture, 154: 283-291. doi: 10.1016/S0044-8486(97)00055-0
- nFagbenro, O.A., (1987). A review of biological and economical principles underlying com-mercial fish culture production in Nigeria, Journal West African Fisheries, 3: 171-177
- nGatlin,G.M., Phillips, H.F., (1989). Dietary cal-cium, phytate and zinc interactions in chan-nel catfish, Aquaculture, 79: 649–656
- nIchii, T., Mugiya, Y., (1983). Effects of dietary deficiency in calcium on growth and cal-cium uptake from the aquatic environment in the goldfish, Carassiusauratus, Compar-ative Biochemistry and Physiology, 74(A): 259-262
- nKaur, V.I ., Saxena, P.K., (2004). Incorporation of brewery waste in supplementary feed and its impact on growth in some carps, Biore-source Technology, 91:101-104. doi: 10.1016/S0960-8524(03)00073-7
- nKnuckles, B.E., Betschart, A.A., (1987). Effect of phytate and other myoinositol phosphate esters on alpha-amylase digestion of starch, Journal of Food Sciences, 52: 719-721. doi: 10.1111/j.1365-2621.1987.tb06710.x
- nMgbenka, B.O., Ugwu, L.L.C., 2005. Aspects of mineral composition and growth rate of the hybrid African catfish fry fed inorganic phosphorus supplemented diets, Aquaculture Research, 36: 479-485. doi: 10.1111/j.1365-2109.2005.01231.x
- nMcDowell, L.R., (1992). Minerals in animal and human nutrition, Academic press, London, 252 pp
- nNakamura, K., (1982). Effects of dietary phos-phorus and calcium contents on the absorp-tion of phosphorus in the digestive tract of carp, Bulletin of the Japanese Society for the Science of Fish, 48: 409-413. doi: 10.2331/suisan.48.409
- nNew, M.B., (1989). Formulated Aquaculture Feeds in Asia: Some Thoughts on Compara-tive Economics, Industrial Potential, Prob-lems and Research Need in Relation to Small-Scale Farmer. In Report of the Work-shop on Shrimps and Fin Fish Feed Devel-opment, J.E. Bahru, (Ed.) ASEAN/SF/89/GGEN/11
- nNwanna, L.C., Adebayo, I.A., Omitoyin, B., (2009). Effect of graded levels of phospho-rus on growth and mineral concentration in giant African catfish, Heterobranchus bi-dorsalis, African Journal of Biotechnology, 8(16): 3947-3953
- nRoy,P.K., Lall, S.P., (2003). Dietary phosphorus requirement of juvenile haddock (Melano-grammusaeglefinusL.), Aquaculture, 221: 451-468. doi: 10.1016/S0044-8486(03)00065-6
- nSoetan, K.O., Olaiya, C.O., Oyewole, E.O., (2010). The importance of mineral elements for humans, domestic animals and plants: A review, African Journal of Food Science, 4(5): 200-222
- nThomson, L.U., (1988). Antinutrients and blood glucose, Food Technology, 42(4): 123-132
- nWaldroup, P.W., (1999). Nutritional approaches to reducing phosphorus excretion in poultry. Poultry Science, 78: 683-691.


