Keywords
Healthcare Cost, Quantitative Analysis Methods, Data Envelopment Analysis, Variable Expenditures.
Introduction
Health care system in Greece is dominated by the National Health Service (NHS), a compulsory social insurance and a voluntary private health insurance system. The NHS provides overall
coverage to the population operating on the principles of equity, social cohesion and equal access to health services for all. In these terms, citizens are not directly dependent on a specific healthcare institution, but they are free to choosebetween a variety of healthcare units depending on the type of treatment they wish to follow and the region they resident1.
Nevertheless, the Greek Ministry of Health takes the general decisions concerning the national health strategy and the relative health policy issues within the corresponding institutions and following the relative legislation. Compromising with this environment, Greek public H.U. operate within a framework characterized by limited economic resources, a restricted number of beds and a geographically unequal distribution of both personnel and patients2,3. For example, in the greater Athens area and for the year 2000, there were 6.4 hospital beds per 1000 citizens, while the corresponding ratio in Central Greece was 1.2 beds per 1000 citizens2.
In particular, over a hundred and thirty public H.U. operate in Greece nowadays. The level of equipment is not satisfactory, despite the modernisation which has taken place over the last two decades, since the H.U. usually cannot fully fulfil the needs of patients for diagnosis and treatment, inability that leads the population to the reliable assistance of the private sector. The sources of funding for the public H.U. are the state budget (74%), fees (13%) and private or other sources (13%).
The efficiency of hospitals has traditionally been measured by means of ratio analysis (cost per day, cost per patient, etc.) and econometric methods. Despite the fact that Ratio analysis always gives significant information concerning H.U. performance in a distributed system, this method presents a number of inaccuracies4,5,6. In particular, each ratio is limited to only one input and one output factor, making rather difficult to compromise with cases where multiple outputs are produced using multiple inputs. Moreover, the use of different ratios for the same H.U. usually gives different results. For example a H.U. may be presented as quite efficient with the use of ratio A, while it may be presented inefficient with the use of ratio B.
On the other hand, econometric methods are more accurate compared to the ratio methods, mainly because their model takes into account the inter-polarity between a number of hospital inputs and outputs. In these terms and during the last years, the estimation of the efficiency of H.U., is made with the use of DEA7, which conducts an analysis for all H.U. inputs and outputs8-17. Banker et al.18, and Chang19 applied econometric analysis and DEA to obtain a comparative evaluation of the relative efficiency of hospitals. Thanassoulis et al.20, applied DEA to assess units providing perinatal care in England and to estimate performance targets for them. Ozcan and Lynch21 applied DEA, while Lynch and Ozcan22 used DEA and logistic regression to determine if technical efficiency is related to rural hospitals closure.
The investigation of expenditure management in H.U. which expertise in the treatment of infections is of great concern, due to the fact that recent studies have proved that more than 12% of the patients present infections while they are treated30.
Mismanagement in H.U. is an issue which needs special care, especially in the field of variable expenditures. The application of quantitative analysis, in order to answer the question of the 'appropriate' or 'inappropriate' management of financial resources used for infections treatment, is applicable to the comparative evaluation of H.U.' administrations, as far as the extent of the efficient utilization of variable expenditures is concerned.
The questions that will be answered by the application of the comparative evaluation of H.U. and will lead to the essential information about the proper management of the particular variable expenditures are the following:
1) Which is the H.U. that succeeds in perfectly utilizing its variable expenditures and as a result is the benchmark for the Administrations of the rest H.U.?
2) In what extent is the management of all as well as individual variable expenditures on infections treatment 'inappropriate'
3) In what extent is each individual category of expenditures 'responsible' for the final comparative evaluation?
Method and material
Data Sources : Data availability and accuracy is significant as it directly affects the conclusions which concern the H.U. efficiency. It is the purpose of this study to provide the appropriate conditions by using a comparative analysis of 16 Greek public H.U for the treatment of hospital infections23. The research is based on data collected from official public sources24-30 and on data published in Yearbook of Health (1994) by Greek Ministry of Health26. The database of this study was partially covered from data given by Greek National Statistical Service for the decade 1992–2002 and from health data provided by the OECD (Organization for Economic Co-operation and Development) for the year 2002. The data were also combined with primarily collected data directly from hospital units of the sample.
Data Development Analysis (DEA):The quantitative analysis method used in this work, is DEA, which is a technique for the evaluation of the efficiency of a number of producers or decision making units7, 31-35. DEA works by estimating a piece-wise linear envelopment surface, known as the best practice frontier35. Despite its limitations34,36, the DEA model has several important advantages over parametric and econometric approaches. Two of the most important are, primarily the flexibility of not imposing a particular functional form on the production frontier32-34 and secondly, the ability to handle multiple-output, multiple-input technologies in a straightforward way, which is considered an important feature when assessing efficiency in public sector activities32. For a review of DEA health care studies see Hollingsworth et al.37, Ozcan et al.38, and Chilingerian and Sherman39. Several other areas of application include hospitals19,33,35,38-42, perioperative services35, surgical operating rooms44, and physicians45.
This study extends the use of DEA in health care to H.U. for the infections treatment. The analysis provides detailed information at the level of Greek units' performance that provides health services on population of the urban area of the country (Greater Athens Area - GAA). This level of detail is necessary for policymakers to make decisions on which individual units should undergo changes. Low efficiency is usually related to excess resources. Thus, the model can be used to explore the effect on efficiency of decreasing input resources. The DEA model can be used to explore some of the underlying reasons for inefficiency.
Input and Output Definition: In order to execute a DEA assessment for a group of units, an appropriate input set is necessary to be defined, which will reflect the resources used by the units and an output set of the results obtained32,36,39. In order to estimate the degree of comparative utilization of the financial resources, which are used by the units of this sample and can be defined as approximate factors of infections, DEA33,44,45,46 was used by applying three assumptions, as far as the structure of inputs and outputs is concerned. In particular, the following inputs were used:
o Expenditures on antiseptics
o Expenditures on antibiotics
o Expenditures on laboratory examinations
which refer only to infections treatment.
Critical results have been drawn by recent studies, indicating that a) expenditures on antiseptics, b) antibiotics and c) laboratory examinations for infections treatment, constitute approximately 80% of the total variable expenditures for infection treatment30.
Correspondingly, the following outputs were used:
1. The number of patients for infections
2. The number of inpatient days
3. The cumulative result of the number of patients and the number of inpatient days
It is the purpose of the use of three different DEA scenarios, to compare their results and possibly confirm the exported conclusions.
The reasons why these inputs and outputs were selected are the following:
1. Operation (non variable) costs such as salaries of medical and administrative personnel, equipment support e.t.c, were not used as inputs, because no flexibility is offered, by the legal framework of the Greek public H.U., concerning suggestion for their possible improvement. Thus, a possible conclusion suggesting reduction of personnel or closure of a whole department would not be applicable due to the existing framework.
2. On the contrary, variable expenditures can be readjusted in case mismanagement is noticed and possible solutions may be proposed as an alternative.
3. Finally, these specific outputs are widely used in comparative evaluations of public H.U. with the use of DEA, while the corresponding inputs refer to special categories of variable expenditures, which are strongly related to hospital infections.
As a result, DEA was applied in three evaluating scenarios concerning the comparative utilization of the specific financial resources used by the 16 H.U. of the sample. The above-mentioned data derive from the activity of the 16 H.U. in 2006.
Sample selection: The H.U. that constitute the sample will be referred to as presented in table 1. The first 15 H.U. are operating in GAA and the last one in the Region. The sample consists mainly of GAA's H.U. due to the fact that they receive approximately 40% of the country's cases. Furthermore, GAA is presumed as one of the most polluted regions of the country (and it is well known that hospital infections are strongly related to environmental pollution and especially indoor pollution). Finally, approximately 39% of the rest of the country patients usually visit GAA's HU in a constant basis.
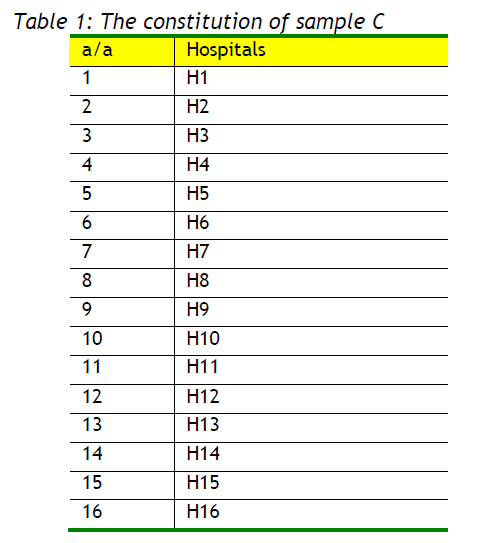
Table 1: The constitution of sample C
Results and discussion
DEA was used by applying three scenarios, as far as the structure of inputs and outputs is concerned. Table 2 summarizes the input/output characteristics of the three scenarios.
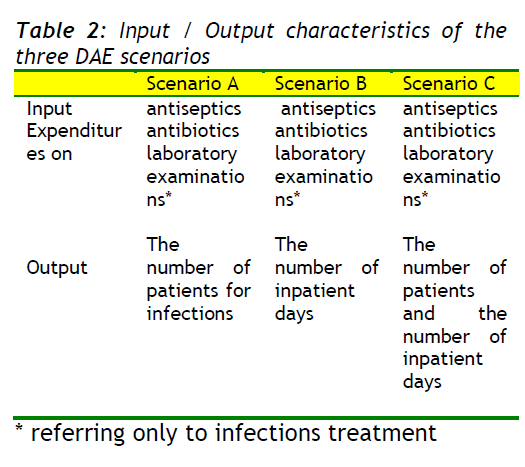
Table 2: Input / Output characteristics of the three DAE scenarios
The results which are derived by the use of DEA in the three scenarios derive results refer to:
(a) the degree of the comparative evaluation of the production resources being used
(b) the contribution extent of the production resources being used to the whole comparative evaluation
(c) the inefficient production resources.
The implementation of DEA, with the use of the inputs and outputs described, led to the results presented in table 3 that concern the evaluation of H.U. of the sample
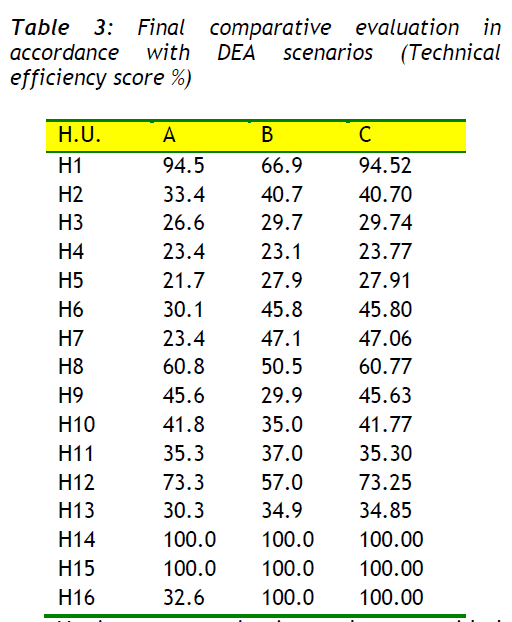
Table 3: Final comparative evaluation in accordance with DEA scenarios (Technical efficiency score %)
Regarding the results derived from the application of DEA for the three alternate scenarios, considering as criterion the total utilization degree of inputs, the H.U. 14 and 15 present the most satisfactory operation and constitute model units or report units for the rest H.U. of the sample (see table 3).
Having as criterion the provided evaluations of the three DEA scenarios, a prioritization of the H.U. has been produced, which is presented in table 4. With the use of the complex prioritization the individual prioritization values of the three scenarios are co-estimated, producing a total value which characterizes each H.U. taking under consideration all the three cases.
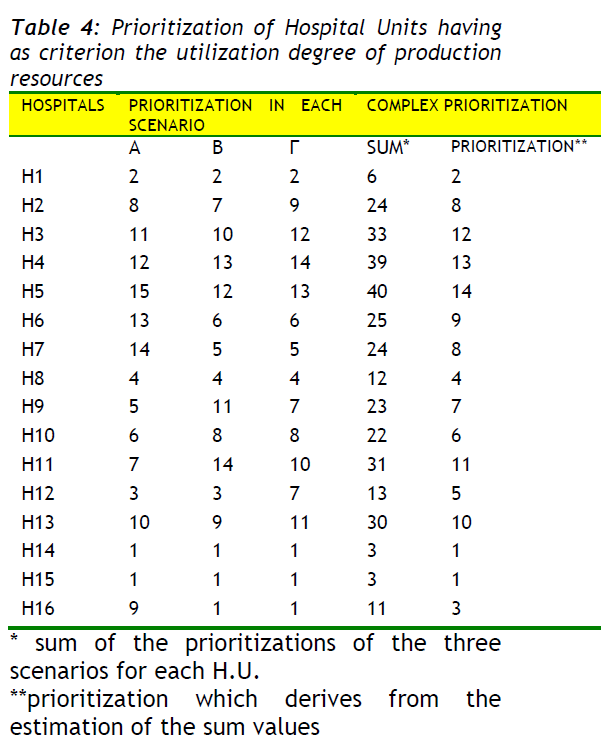
Table 4: Prioritization of Hospital Units having as criterion the utilization degree of production resources
Table 4 clearly indicates that H.U. (14) and (15) achieve a remarkable utilization of the production resources. On the other hand, H.U. (5) and (4) present inefficient utilization degrees of production resources, no matter which one of the three scenarios is applied.
Specific Gravity of Individual Production Resources
The information concerning the contribution degree of inputs (production resources) being used, is important for the final comparative result. Special gravity on individual production resourses is the percentage contribution of each input in the determination of the efficiency score.
Thus, DEA analysis indicates that the inputs which contribute more than 50% to the final comparative evaluation are those presented in table 5. From the above-mentioned data it is clear that the expenditures on antibiotics are the most decisive and determinative factor of the final comparative evaluation in most H.U. of the sample.
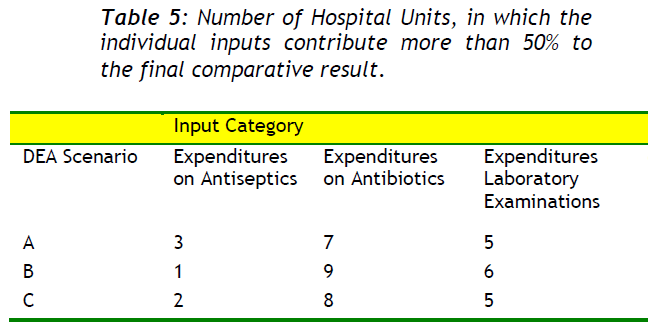
Table 5: Number of Hospital Units, in which the individual inputs contribute more than 50% to the final comparative result.
Inefficient Production Resources
The existence of 'inefficient production resources' indicates 'management pathogenesis', as well as pathogenesis in expenditures (see table 6). This factor indicates the percentage of inputs which is not efficiently used and their absence would not affect the final efficiency score.
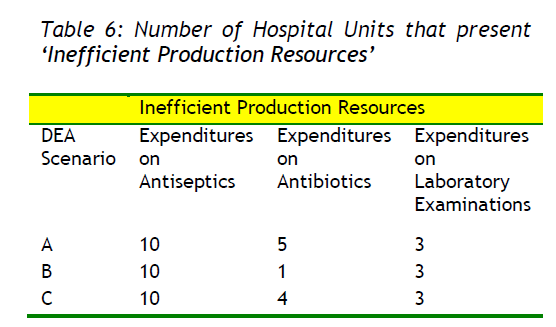
Table 6: Number of Hospital Units that present ‘Inefficient Production Resources’
From the above-mentioned data arises that the expenditures on antiseptics are presented in most H.U. as 'inefficient production resources', which indicates that the expenditures on antiseptics are important factor of management pathogenesis. Table 7 presents the amount of variable expenditures, which absence would not affect the final efficiency score.
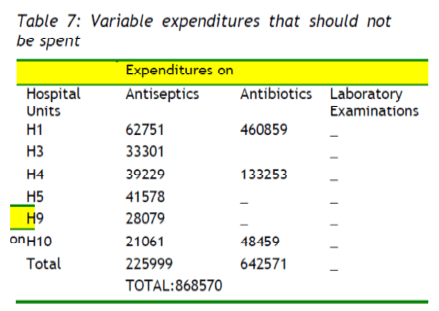
Table 7: Variable expenditures that should not be spent
Conclusions
As far as the variable expenditures are concerned, the H.U. of this sample have to restrict the level of financial resources, which in absolute magnitudes and expenditures category are presented in table 7. As a result they would restrict their particular variable expenditures by 868.570 euros or by about 8%, in case they compromised their operation with the model-units of the sample.
In relation to the methodology used for the comparative evaluation of the H.U. of this sample, simply economic criteria were taken under consideration43. It is namely regarded that there are no particularities in the cases of infections. The only criterion reflecting the particularity of infections from medical point of view is the output of the number of inpatient days in combination with the number of patients.
The information arising from the investigation is:
a. The comparative evaluation made possible to point out the H.U. that operate in a 'model' way and at the same time it remarked the comparative efficiency of the rest of the units. Consequently, 14 out of 16 administrations of the particular sample presented problems regarding the utilization of financial resources that they manage, for the treatment of patients with infections. These findings are quite significant for the following reasons:
Firstly, they point out to the H.U.' administrations that they should reconsider or change the processes of evaluation of particular financial resources by taking under consideration the corresponding administrations of the “model” H.U. Secondly, useful information is provided for the state agencies, in order to establish the appropriate measures, in the frame of the present legislation. Beyond the above-mentioned, the best financial resources' evaluation, provide quality upgraded nursing services.
b. The production resources, to which the efficiency level of the administration is attributed, are pointed out. Thus, H4 presents a comparative degree of evaluation in the order of 23%. Consequently, it is necessary to find the activity sector that does not work efficiently. The answer to this problem is given by the 14 H.U.' quantitative analysis. As a result, their administrations have to focus on the indicated activities, so as to take the appropriate measures. It is obvious that this information is quite useful even to the dominant H.U.' administration agencies, which have the responsibility to observe the evaluation degree on the whole as well as with regard to the individual financial resources for health care.
c. Valuable results emerge from the evaluation of utilization degree of each particular production resource, which is used as an 'input' in the application of DEA. Thus, for example H1 spends 460.859 € more than the permissible amount, as it utilizes the production resource 'financial resources for buying antibiotics' in an uneconomical way. The above-mentioned information is given according to the corresponding financial resources' evaluations of the 'model' H.U. (14), (15) presented in this sample.
In conclusion, it is possible to define the number of patient or inpatient days that the H.U. of the particular sample should supply, in order to achieve excellent utilization degree of their production resources. The 'best policy plan' that has to be adopted by each one of the 14 H.U. of the sample, having as benchmark H.U. 14 and 15, which are assumed as the best-practice H.U. concerning the management of the particular financial resources, is clearly provided.
781
References
- Allin S, Bankauskaite V, Dubois H, Figueras J, Golna C, Grosse-Tebbe S. Snapshots of health systems. WHO, European Observatory on Health Systems and Policies. Available from: www.euro.who.int/observatory/Hits/20060518 1, 2004
- nTountas Y, Karnaki P, Pavi E. Reforming the reform: the Greek national health system in transition. Health Policy, 2002; 62:15–29
- nGiokas D. Greek Hospitals: how well their resources are used. Omega, 2001; 29(1):73–83
- nAthanassopoulos A, Ballantine J. Ratio and frontier analysis for assessing corporate performance: evidence from the grocery industry in the UK. European Journal of Operational Research, 1995; 46:427-440
- nSherman D. Hospital efficiency measurement and evaluation: empirical test of a new technique. Medical Care, 1984; 22:422-438
- nThanassoulis E, Boussofiane A, Dyson G. A comparison of data envelopment analysis and ratio analysis as tools for performance assessment. Omega, 1996; 24:229-244
- nCharnes A, Cooper W, Rhodes E. Measuring the efficiency of decision making units. European Journal of Operational Research, 1978; 2:429-44
- nBanker D, Das S, Datar, M. Analysis of cost variances for management control in hospitals. Research in Governmental and Non-profit Accounting, 1989; 5:269-291
- nBorden JP. An assessment of the impact of diagnosis-related group (DGR)-based reimbursement on the technical efficiency of New Jersey hospitals using data envelopment analysis. Journal of Accounting and Public Policy, 1988; 7:77-96
- nEhreth J. The development and evaluation of hospital performance measures for policy analysis. Medical Care, 1994; 32:568-587
- nHadley J, Zuckerman S, Iezzoni L. Financial pressure and competition: changes in hospital efficiency and cost-shifting behavior. Medical Care, 1996; 34:205-219
- nGrosskopf S, Valdamanis V. Measuring hospital performance: a non-parametric approach. Journal of Health Economics, 1987; 6:89-107
- nMorey C, Fin J, Loree W. Comparing allocative efficiency of hospitals. Omega, 1990; 18:71-83
- nMorey C, Ozcan A, Retzla-Roberts L, Fine J. Estimating the hospital-wide cost differentials warranted for teaching hospitals: an alternative to regression approaches. Medical Care, 1995; 33(5):531-552
- nOzcan A, Luke D. A national study of the efficiency of hospitals in Urban markets. Health Services Research, 1993; 27(6):719-739
- nOzcan A, McCue J. Development of a financial performance index for hospitals: a DEA approach. Journal of the Operational Research Society, 1996; 47:18-26
- nSherman D. Hospital efficiency measurement and evaluation: empirical test of a new technique. Medical Care, 1984; 22:422-938
- nBanker D, Conrand F, Strauss P.A comparative application of data envelopment analysis and translog methods: an illustrative study of hospital production. Manage Science, 1986; 32:30-44
- nChang H. Determinants of hospital efficiency: the case of central government owned hospitals in Taiwan. Omega, 1998; 26:307-317
- nThanassoulis E, Boussofiane A, Dyson G. Exploring output quality targets in the provision of perinatal care in England using data envelopment analysis. European Journal of Operational Research, 1995; 80:588-607
- nOzcan A, Lynch J. Rural hospital closures: an inquiry to efficiency. Advances in Health Economics and Health Services Research, 1992; 13:205-224
- nLynch R, Ozcan A. US hospital closures: an efficiency analysis. Hospital and Health Services Administration, 1994; 39(2):205-220
- nFäre R, Grosskopf S. Measuring Output Efficiency. European Journal of Operational Research, 1983; 13(2): 173-179
- nCenter for Health Services Research.The state of health in Greece. Athens: Ministry of Health and Welfare; 2000. [in Greek]
- nCenter for Health Services Research. Health services in Greece. Athens: Ministry of Health and Welfare; [in Greek], 2001
- nCentral Council on Health.Yearbook of health.Athens: Ministry of Health and Welfare; [in Greek], 1994
- nNational Statistical Service of Greece.Statistical yearbook of Greece 2000.Athens: National Statistical Service of Greece; [in Greek], 2001
- nNational Statistical Service of Greece.Statistics for social care and health. Athens: National Statistical Service of Greece; [in Greek], 1992–2002
- nNational Statistical Service of Greece.Vital statistics of Greece. Athens: National Statistical Service of Greece; [in Greek], 2000–2002
- nCharnes A, Cooper W. Preface to topics in data envelopment analysis. Annals of Operations Research, 1985; 2:59–94
- nCooper W, Seiford M, Zhu J. Data envelopment analysis: history, models and interpretations. Boston/London; Kluwer Academic Publisher; 2004, p.1-39
- nAl-Shammari M. A multi-criteria data envelopment analysis model for measuring the productive efficiency of Hospitals. International Journal of Operations and Production Management, 1999; 19:879–890
- nSalinas-Jimenez J, Smith P. Data envelopment analysis applied to quality in primary health care. Annals of Operations Research, 1996; 67:141–161
- nO“Neill L, Dexter F. Evaluating the efficiency of Hospitals” perioperative services using DEA. Norwell MA; Kluwer Academic Publishers; 2004, p. 64-72
- nAnderson A. Data envelopment analysis (DEA) home page; Available from: https://www.emp.pdx.edu/dea/ homedea.html, 1996
- nHollingsworth B, Dawson J, Maniadakis N. Efficiency measurement of health care: a review of non-parametric methods and applications. Health Care Management Science, 1999; 2(3):161–172
- nOzcan A, Merwin E, Lee K, Morrisey P. Benchmarking using DEA: the case of Mental Health Organizations. Norwell MA; Kluwer Academic Publishers; 2004, p. 97-116
- nChilingerian A, Sherman D. Health care applications. From Hospitals to Physicians, from productive efficiency to quality frontiers. Boston/London; Kluwer Academic Publisher; 2004, p. 78-91
- nButler W, Li L. The utility of returns to scale in DEA programming: An analysis of Michigan rural hospitals. European Journal of Operational Research, 2005; 161(2):469–477
- nBallestero E, Maldonado A. Objective measurement of efficiency: applying single price model to rank hospital activities. Computers and Operations Research, 2004; 31(4):515–532
- nManiadakis N, Thanassoulis E. Assessing productivity changes in UK hospitals reflecting technology and input prices. Applied Economics, 2000; 32:1575–1589
- nSarkis, J, Talluri S. Efficiency measurement of hospitals: issues and extensions. International Journal of Operations and Production Management, 2002; 22(3):306–313
- nKatharaki M. The efficiency impact of Telemedicine on Obstetric and Gynaecology services: effects on Hospitals units” management.Dissertation.Greece: University of Athens; [in Greek], 2006
- nBanker D. Estimating Most Productive Scale Size Using Data Envelopment Analysis. European Journal of Operational Research, 1984; 17: 35-44
- nChang P, Guh Y. Linear Production Functions and the Data Envelopment Analysis. European Journal of Operational Research, 1991; 52: 215- 223.


