Keywords
Crayfishing management; Simulation model; Brazo del Este; Doñana area; Procambarus clarkii
Introduction
Background and justification
The first introduction of the red swamp crayfish (Procambarus clarkia) Girard, 1852, native to the southeastern region of the United States) in Europe was conducted in Spain in 1973 at two aquaculture factories located in Sevilla and Badajoz. The introduction aimed to improve the economies of these impoverished regions through the trade of this food resource for human consumption (Habsburgo–Lorena, 1983). Since its introduction, this exotic species has spread throughout the European Mediterranean region in just 40 years (Geiger et al., 2005). This range expansion was due to both the crayfish’s significant colonizing ability and to numerous introductions and translocations by Spanish fishermen who realized the economic benefits generated by the red swamp crayfish (Montes et al., 2001). This invasive species has had a negative impact on the biodiversity and ecological functioning of the aquatic ecosystems that it inhabits (Duarte et al., 1990; Angeler et al., 2001:2003; Geiger et al., 2005; Tablado et al., 2010; Marchi et al., 2011a;2011b; Alcorlo and Baltanás, 2013). Indeed, for the Doñana area, García-Llorente et al., (2011) proposed implementing an eradication and prevention program for the management of exotic species such as P. clarkii. The introduction of the crayfish in the Lower Guadalquivir marshes has enabled the establishment of an important industry based on fishing, processing, and marketing in local and foreign markets. Currently, Spain is one of the three most important countries in the worldwide trade of this crayfish species, with more than 3000 tons/year (hereafter t/y) n produced in this region, generating annual revenues of 3.3·106 €. In this area, there are nine processing factories employing over 400 people. Moreover, there are several hundred fishermen who harvest only crayfish (Montes et al., 2001). Fishing is selectively carried out on wild populations of crayfish inhabiting rice fields, channels, marshes, and river branches and similar habitats (Alcorlo et al., 2008). The placement of the traps used while cray fishing has impacts on the environment (i.e., trampling of submerged vegetation, sediment removal, and disturbance to birds nesting in emergent vegetation) and on other organisms such as amphibians, reptiles, and fish (Geiger et al., 2005). The time of the year and the method of fishing are particularly important, because this activity is carried out in a natural protected area, where it is necessary to reconcile the conservation of the ecosystem and its biodiversity with human wellbeing. Therefore, there is an urgent need to improve the management of the crayfish through a strategy that will guarantee the conservation of the natural area while also facilitating the development of socioeconomic activity. There are alternative ways to control the high density of exotic crayfish populations, such as manual removal, selective fishing by traps, and electric fishing (Holdich et al., 1999). In this regard, the commercial extractive fishing in the Lower Guadalquivir area could be used as an integrative management tool aimed to control crayfish populations, to maintain this socioeconomic activity, andto minimize its impacts on the ecosystem.
The main objective of this work was to evaluate different management strategies to optimize crayfish harvesting as asustainable and unaggressive activity within the ecosystems of the Lower Guadalquivir region. Data concerning fishing activityand the demography of the crayfish populations monitored during1999 and 2000 were used to build a simulation model employingdifferent fishery management options (scenarios).
Specifically, our aims were: i) To understand the population dynamics of P. clarkii in the study area and ii) To analyze the effect of selective fishing as an effective method to control crayfishpopulations and to manage the aquatic ecosystems.
Materials and Methods
Study area
This study was carried out in a Natural Protected Area located in the Lower Guadalquivir (‘Brazo del Este’, SW, Spain) (Figure 1). The river bed is composed of silt and clay, and dense patches of common cattail (Typha spp.) and reeds (Phragmites spp.) grow along the river banks. Other shrub species, such as alkali seepweed (Suaeda vera), tamarisk (Tamarix africana) and rushes (Juncus maritimus), appear together with the helophytic vegetation. The site where the crayfish were captured for this study (37º 08' N, 6º 02' W) is in one of the oldest branches of the Guadalquivir river that empty into the marsh, which was originally a tidal-fluvial system. The area of the water body considered in this study was 796 ha, being completely included within the ‘Brazo del Este’ Natural Area (BOJA 60, 1989). Moreover, this area is a Special Protection Area for Birds (SPA) and a Ramsar Site (FIR, 2007). The hydroperiod is nearly permanent as it receives runoff from the surrounding rice fields during the dry season (i.e., summer) (Montes et al., 2001). Crayfishing is allowed and regulated within the ‘Brazo del Este’ Protected Natural Area (BOJA 60, 1996; BOJA 95, 1996) and is carried out using a special trap called a Dutch Trap (mesh size 15 mm in diameter Figure 2) that prevents the entrance of waterfowl (FIR, 2007). Regulations allow crayfishing from September 1st to April 15th with 6000 being the maximum number of traps that can be placed in the protected area and a maximum number of 120traps for each fisherman.
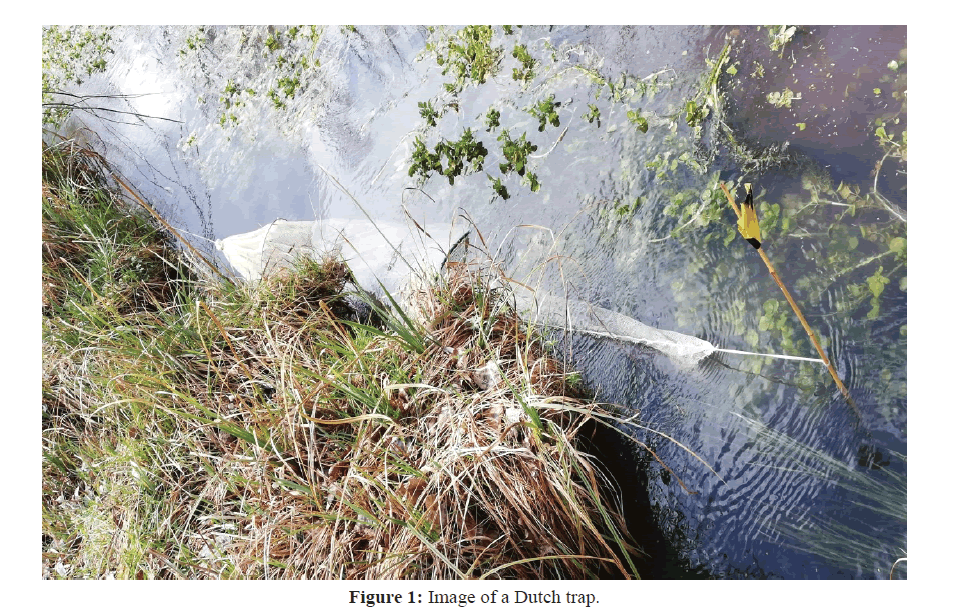
Figure 1:Image of a Dutch trap.
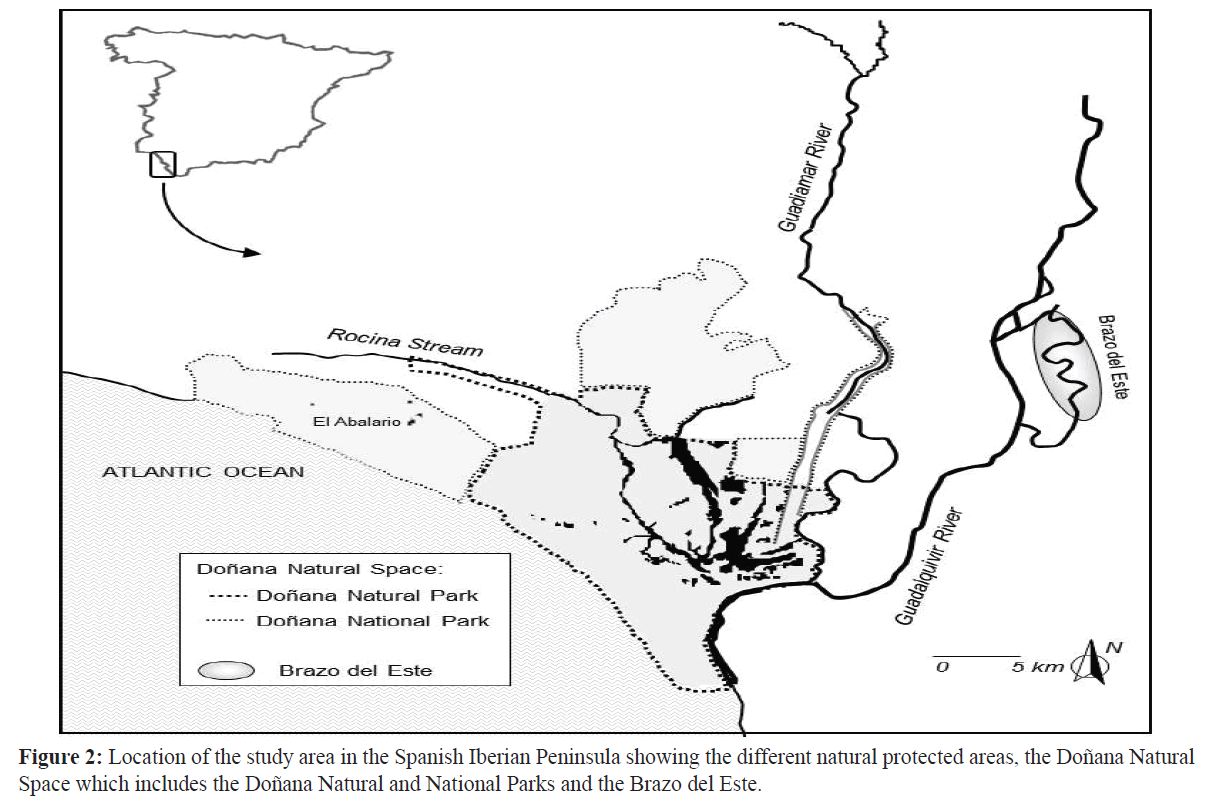
Figure 2:Location of the study area in the Spanish Iberian Peninsula showing the different natural protected areas, the Doñana Natural Space which includes the Doñana Natural and National Parks and the Brazo del Este.
Proposed management strategies for P. clarkii harvesting
A simulation model was built to analyze the effects of different levels of fishing effort at different times of the year on the crayfish’s population dynamics. The optimum fishing effort was defined as that which contributes to both reducing the impact on the aquatic ecosystems caused by dense populations of P. clarkii while ensuring sustainable fishery production. Multiple scenarios with various levels of fishing effort (numbers of fishermen and fishing traps per day) were generated over a period of five yearsfor each of the following management strategies:
Management option (a) Strategy 0: No fishing.
Management option (b) Strategy 1: Maximize crayfish production by distributing the fishing effort from September toApril, according to the current regulations.
Management option (c) Strategy 2: Maximize fishing production by fitting them fishing effort to the period of thegreatest recruitment of crayfish, from September to December.
Simulation modeling of crayfish population dynamics andharvesting
The model and the simulations were performed using the STELLA 8.0 software, a high-level programming language (STELLA_c 2003, https://www.hps-inc.com) (Costanza and Voinov, 2001). This software was chosen because is one of the first programs to include a graphical interface, its use is very intuitive, and it is also widely used in simulation modeling. Moreover, it has been used to build several ecological models of crayfish population dynamics and exploitation (Anastacio et al., 1999; Dew, 2001). As stated before, the user-iconographic interface in the finished models produced by STELLA enables one to run simulationsquickly and easily without having advanced computer skills.
The relationships among variables and parameters concerning the crayfish population dynamics with harvesting were established in the model represented in Figure 3. To account for the temporal variability in the crayfish population dynamics, a monthly simulation time interval was chosen. The data used to model the natural population dynamics of P. clarkii (Figure 4) were from different sources: intensive monthly sampling conducted at the study area in 1999 and 2000, subsequent studies also based in this area (Alcorlo et al., 2008), and other studies analyzing the birthand natural mortality parameters of P. clarkii (Table 1).
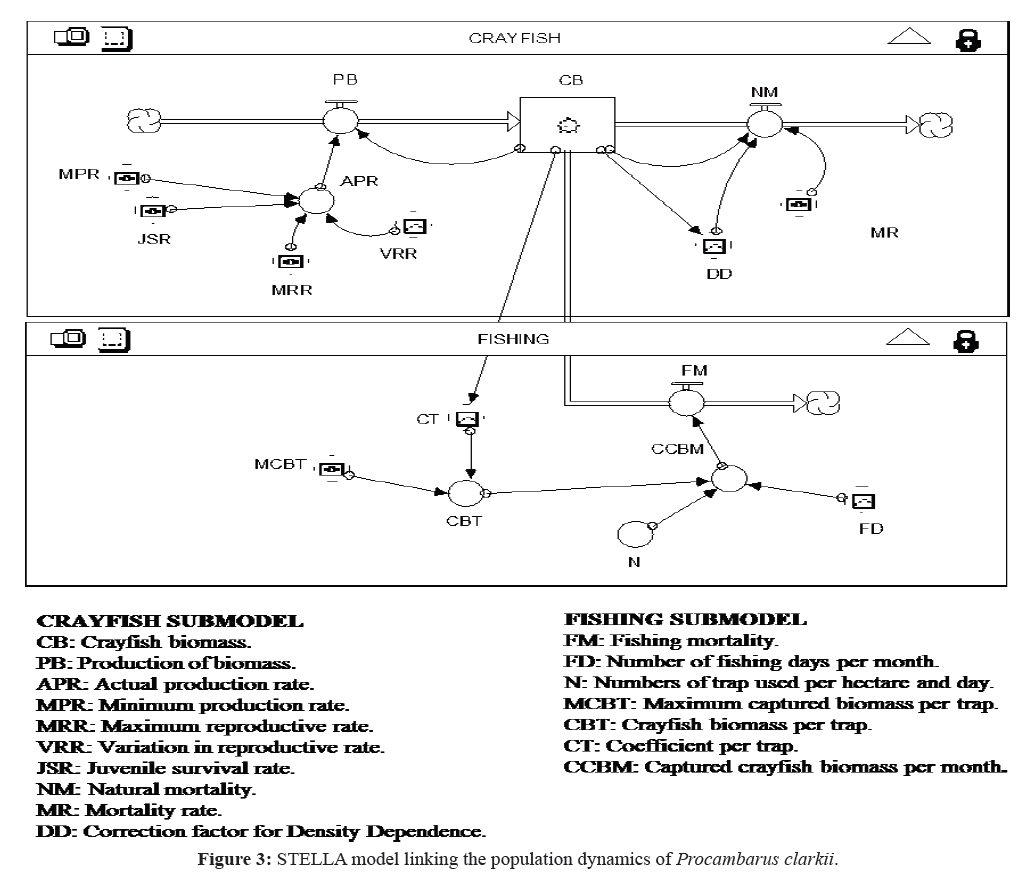
Figure 3:STELLA model linking the population dynamics of Procambarus clarkii.
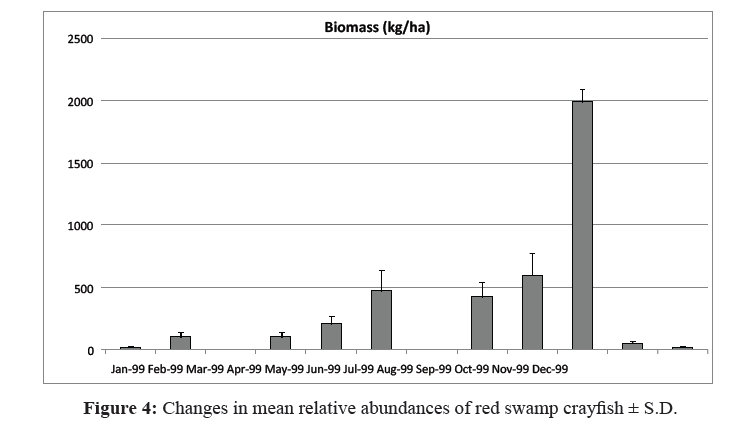
Figure 4:Changes in mean relative abundances of red swamp crayfish ± S.D.
| Parameter |
|
Description |
Value |
|
Reference |
| Maximum Reproductive Rate (MRR) (kg indiv/indiv) |
|
Small females (100 eggs per egg laying) |
0.74 |
|
Payne, 1996 |
| Large females (500 eggs per egg laying ) |
3.74 |
|
Payne, 1996 |
| Juvenile Survival Rate (JSR) |
|
Unique stage |
0.48 |
|
Huner, 1978 |
| Up to 20 weeks |
0.29-0.60 |
|
Romaire 1976 |
| |
|
Maximum rate in winter |
0.1935 |
|
Clark et al., 1975 |
| Mortality Rate (MR) |
|
Minimum rate in winter |
0.0327 |
|
Clark et al., 1975 |
| Minimum estimatedin field |
0.2541 |
|
Anastácio& Marques, 1995 |
| |
|
Maximum estimatedin field |
0.72 |
|
Anastácio& Marques, 1996 |
| Minimum Reproductive Rate (MPR) (kg indiv/kg population) |
|
Laboratory conditions |
0.2 |
|
McClain et al., 1992 |
| Rice fields |
0.7 |
|
Anastácio et al., 1999 |
In this study, the biomass of crayfish was measured at each sampling site. Because the size structure of the crayfish populations varies throughout the year, which is especially relevant to fishing, the biomass of crayfish collected at each sampling site was considered as a proxy of the population size, and the different age classes separately were not considered. The crayfish biomass (kg/ ha) was obtained from the relative density of crayfish and monthly mean weight of trapped crayfish (Table 2). The relative density of crayfish was estimated from the relative abundance (Catch Per Unit Effort, (CPUE)) correcting for the area of influence of a trap with the α coefficient, which represents the area of influence of a trap (α = 56.3 m2) according to Acosta and Perry (2000). Crayfish were trapped using Dutch Traps (mesh size 15 mm) baited withfresh fish and remained active for 24 hours.
Table 2. Individual average monthly weight of crayfish captured at the sampling site.
| |
|
‘Brazo del Este’ |
| Date |
Average crayfish weight (g) |
S.D. |
| May 1999 |
15.48 |
4.62 |
| June 1999 |
15.35 |
4.86 |
| September 1999 |
15.47 |
5.19 |
| October 1999 |
16.27 |
8.11 |
| November 1999 |
16.23 |
8.76 |
| December 1999 |
10.93 |
8.34 |
| January 2000 |
8.08 |
11.65 |
| February 2000 |
14.35 |
10.51 |
| April 2000 |
13.03 |
7.94 |
| May 2000 |
11.83 |
6.02 |
| June 2000 |
13.97 |
9.20 |
| September 2000 |
9.38 |
7.31 |
| November 2000 |
11.44 |
8.23 |
An exponential growth model for the crayfish population dynamics model was constructed that included an upper limit of crayfish biomass, which caused a dramatic increase in crayfish mortality when the population size approached the carrying capacity of the system (Figure 5). The resulting model for the natural population dynamics of P. clarkii behaved according to a temporal pattern of ‘explosion and collapse’ instead of a logistic pattern, because in this case the relationship between population size and relative growth rate was exponential (negative) insteadof linear.
Model equations
The variation in crayfish biomass (dCB/dt) expressed in kg/ ha was calculated from the balance between the production of biomass (PB) and destruction of biomass due to natural mortality(NM) and fishing (FM).
 (1)
(1)
The numerical approximation was done using the Euler integration method based on monthly estimates of the variables and coefficients and applying an integration step (DT in Stella) of 1/30. This basic scheme was connected with an estimate of the Natural Mortality rate (NM) as a second output of the statevariable.
The Production of Biomass (PB) was calculated by multiplyingCrayfish Biomass (CB) and Real Production Rate (RPR).
PB = CB×RPR (2)
The Real Production Rate (RPR) was expressed by theequation:
RPR = MPR +MRR×VRR× JSR (3)
which MPR is the minimum production rate representing the increase in crayfish biomass as an outcome of its populationgrowth; MRR is the maximum reproductive rate;
VRR is the variation in reproductive rate; and JSR is thejuvenile survival rate.
The Natural Mortality (NM) was dependent on the Mortality Rate (MR) and a Correction Factor (DD) depending on CrayfishBiomass (CB) (Figure 5).
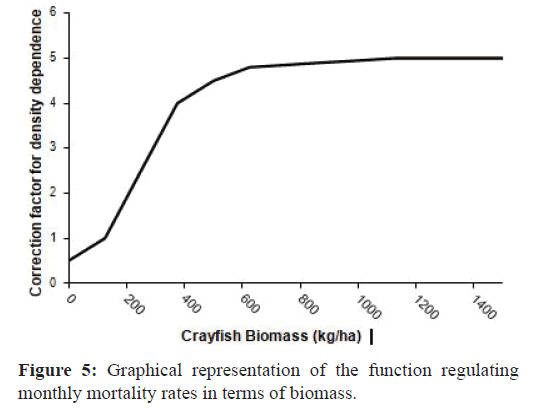
Figure 5:Graphical representation of the function regulating monthly mortality rates in terms of biomass.
NM = MR×DD×CB (4)
Fishing mortality (FM) was calculated by multiplying crayfish biomass per trap (CBT), the number of fishing days per month(FD), and the number of traps used per hectare per day (N).
FM = CBT × FD× N (5)
Moreover, crayfish biomass per trap (CBT) was dependent onthe crayfish biomass (CB) and was calculated as:
CBT = MCBT ×CT (6)
Where MCBT is the maximum trapped biomass per trap and CT (coefficient per trap) is a coefficient from 0 to 1 depending oncrayfish biomass (CB) (Figure 6).
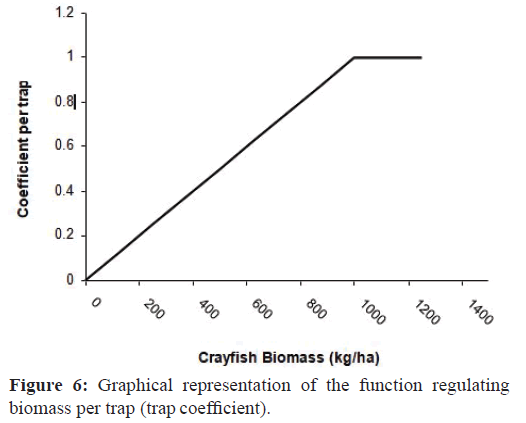
Figure 6:Graphical representation of the function regulating biomass per trap (trap coefficient).
Parameter estimation
The initial crayfish biomass (224 kg/ha) was calculated byaveraging all data from the ‘Brazo del Este’ area.
Minimum production rate (MPR)
This parameter represented the increase in biomass of individuals of P. clarkii from their growth rate to define theincrease in population biomass (Table 1).
Maximum reproductive rate (MRR)
The range of reproductive rates was established from the mean number of eggs found in female P. clarkii in the Lower Guadalquivir (Montes et al., 1993; Gutiérrez-Yurrita, 1997; Alcorlo et al., 2008). The sex ratio was 1:1 in the study area (Alcorlo et al., 2008); therefore, differences between females andmales were not distinguished in this model.
The mean number of eggs per female was thus divided by two. Considering that crayfish juveniles from 0-1 month of age had a mean weight of 0.11 g and using the mean weight of adults (Alcorlo et al., 2008), the defined values for 'reproductive rate' (expressed as a ratio of biomass) were established between 0.74and 3.74 (Table 1).
Variation in the reproductive rate (VRR)
This parameter defined the effect of temperature on the reproductive rate. The parameter was introduced considering the monthly variation of the temperature and the reproductive cycle of P. clarkii in the Lower Guadalquivir, being highest during the months of June and October, slightly lower between these month,and zero between November and April.
Juvenile survival rate (JSR)
The juvenile survival rate for the juvenile stage from 0-20 weeks used in this study was obtained by averaging the values calculated by Romaire (1976) and Huner (1978). These authors defined this rate as the ratio of the number of individuals of a size class and the number of individuals from the previous size class. In our model a mean juvenile survival rate per year of 0.6 was used (Table 1); however, values from the entire range of 0.1 to 0.9were used to calibrate the model.
Real production rate (RPR)
This results from the combination of the above parameters of Minimum Production Rate (MPR) plus the product of Maximum Reproductive Rate (MRR) per the Variation in the Reproductive Rate (VRR) per the Juvenile Survival Rate (JSR) and is expressedas kg of production/kg of population biomass.
Mortality rate (MR)
The values of the monthly mortality rate used in this study ranged from 0.02 to 0.72 (Table 1). The P. clarkii model was built considering that population mortality was dependent on the population density (Figure 5), as this has been observed in several studies (Cano & Ocete, 1994; McClain et al., 1992; Ramalho et al., 2008) and has been introduced in other simulation modelssimilar to ours (Anastácio et al., 1999).
Table 1. Summary of population dynamics parameters estimated for Procambarus clarkiiin different field and laboratory studies.
Number of fishing days per month (FD)
The values used in this study were taken from the current legislation. For Strategy 1, the number of fishing days per month were 30, 31, 30, 31, 31, 28, 31 and 15 days in September, October, November, December, January, February, March, and April, respectively, whereas Strategy 2 only considered the correspondingdays in September, October, November, and December.
Number of traps per hectare and day (N)
The value of this variable was 7.54 in Strategy 1 from the current regulations, which authorize a total of 6000 traps within ‘Brazo del Este’ (796 ha). This variable was modified in the scenarios that changed the number of fishing days per month to obtain a fishing effort (number of traps per fishing days) equivalent to the effort under the normal regulations (1700 traps in 227 daysin Strategy 1 and 1711 traps in 122 days in Strategy 2).
Crayfish biomass per trap (CBT), crayfish trapped biomassper trap (MCBT) and coefficient per trap (CT)
CBT represented the biomass per trap (kg/trap), which depends on the total biomass of crayfish in the population (CB). If the population was low, the traps contained less biomass. The relationship between the variables (CB and CBT) was defined with the ‘coefficient per trap’ variable (CT). MCBT, the mean maximum capacity of the traps (saturation of a trap), was definedas an mean value of 0.24 kg/trap according to Alcorlo et al. (2008)
Sensitivity analysis and model calibration
The sensitivity analysis examined the effects of changes in the parameters (coefficients) or external variables on the state variables and was evaluated by the S index (S = [δx/x] / [δP/P]) (Jørgensen, 1988) where δx is the change in the state variable (x) and δP is the change in the Parameter (P). The sensitivity analysis was carried out by varying the values of the parameters up to ±50%.
Fitting between observed values and predicted values was conducted manually by modifying values of the parameters within the ranges published in the bibliography (‘Estimation of parameters’). Special attention was payed to the calibration of the most important variables in the sensitivity analysis. The fit evaluation was conducted according slope between observed and predicted values, and the hypothesis of a slope equal to 1 andintercept equal to 0 was tested using a Student’s t–test (p <0.05).
Results
Results of sensitivity analysis and calibration
The results of the sensitivity analysis showed that the model was most sensitive to variation Mortality Rate (MR), which was dependent on the crayfish population density (CB). Table summarizes the results obtained with the most relevant parameters. The fitted evaluation between observed and predicted values (Figure 7) showed that the model explained 73.68% of the variance (R2 of the observed values vs. predicted values). The slope was not significantly different from 1 (p=0.503), or from 0(p=0.162).
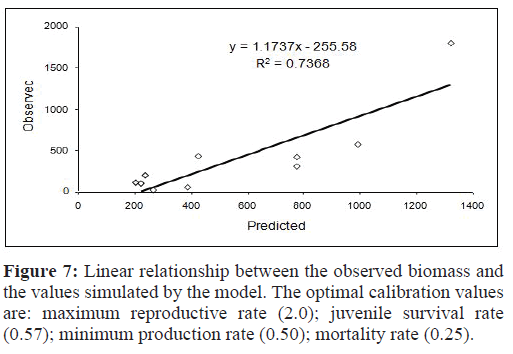
Figure 7:Linear relationship between the observed biomass and the values simulated by the model. The optimal calibration values are: maximum reproductive rate (2.0); juvenile survival rate (0.57); minimum production rate (0.50); mortality rate (0.25).
Simulation results
The evaluation of the results of the three management options that represented qualitatively different situations concerning the crayfish population dynamics were as follows: a) Strategy 0: no fishing, b) Strategy 1: assuming maximum allowable fishing from September 1st to April 15th (227 fishing days), and c) Strategy 2: a new proposed fishing period from September 1st to December 31st(122 fishing days).
Management option (a): Strategy 0
Continuous demographic growth and collapse events (Figure 8). The population peaks of greatest intensity occurred in October, which explained the subsequent collapse of the population. The minimum biomass values were approximately 210 kg/ha similarto the initial biomass in the simulation model.
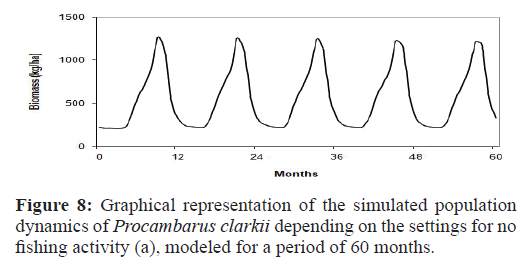
Figure 8:Graphical representation of the simulated population dynamics of Procambarus clarkii depending on the settings for no fishing activity (a), modeled for a period of 60 months.
Management option (b): Strategy 1
This option reflected the effect of a fishing effort carried out by 50 fishermen with 120 traps, all within ‘Brazo del Este’ (796 ha) (Table 3); this corresponded to a fishing effort of 1711 traps/ ha/year distributed over the total number of allowed fishing days (227 days). This effort provided 168 kg/ha of annual crayfish production. This value was higher than the production values calculated by other authors for our study area; Molina (1984) estimated a 61 kg/ha annual crayfish production in 1981 and 111 kg/ha in 1982. Population explosion events reached 1320 kg/ha of crayfish biomass, with an annual cycle. The minimum values of the population were approximately 200 kg/ha (per month) with anannual population biomass of 6425 kg/ha.
Table 3. Results of the sensitivity analysis. The model is most sensitive to changes in the death rate, which is influenced by the density of the population. In all cases the effect is somewhat less pronounced in the absence of fishing.
| Parameter |
Value |
S index in Crayfish Biomass (CB) parameter |
| |
|
Fishing |
No fishing |
| Maximum Reproductive rate (MRR) |
1.0 (-50%) 1.5 (-25%) 2.5 (+25%) |
0.359 0.359 0.367 |
0.370 0.370 0.378 |
| |
3.0 (+50%) |
0.523 |
0.530 |
| |
0.250 (-50%) |
0.359 |
0.370 |
| Juvenile Survival Rate |
0.375 (-25%) |
0.359 |
0.370 |
| (JSR) |
0.625 (+25%) |
0.367 |
0.378 |
| |
0.750 (+50%) |
0.523 |
0.530 |
| |
0.250 (-50%) |
0.525 |
0.582 |
| Minimum Production Rate |
0.375 (-25%) |
0.461 |
0.519 |
| (MPR) |
0.625 (+25%) |
0.458 |
0.473 |
| |
0.750 (+50%) |
0.467 |
0.481 |
| |
0.2 (-50%) |
-6.403 |
-6.016 |
| Mortality Rate |
0.3 (-25%) |
-1.394 |
-1.368 |
| (MR) |
0.5 (+25%) |
-0.653 |
-0.677 |
| |
0.6 (+50%) |
-0.585 |
-0.617 |
Management option (c): Strategy 2
This option maintained the same fishing effort as in the previous model, 1711b traps/ha/year, but distributed over the new proposed fishing season (122 days) from September 1st to December 31st.This effort provided 230 kg/ha/year of annual crayfish production
Discussion
The results from the three proposed scenarios of fishing management (i.e., no fishing and the two fishing strategies)produced different values of annual crayfish production.
Generally, Strategy 2 was more efficient than Strategy 1 in terms of crayfish biomass production, as it provided a higher total harvest than Strategy 1 (6480 vs. 6425 kg/ha) with the same fishing effort in half the time. This could be due to the fishing effort beingfocused on the reproductive season of crayfish in autumn.
In fact, while Strategy 2 assumed 90% of the fishing effort carried out in Strategy 1, it yielded 123% of the respective fishing production while maintaining 115% of the crayfish annualbiomass.
Concentrated fishing during the reproductive season may be an optimal strategy. This approach is beneficial because it avoids the overfishing that causes the decline of wild populations (Hein et al., 2007). However, to develop a new sustainable crayfish management plan, it will be necessary to consider the advantages and disadvantages associated with each of the two simulated alternatives and their respective environmental and socioeconomic impacts. This plan should combine the maximization of crayfish production while minimizing the environmental impact from fishing activities. Such an approach combining environmental and recreational preferences with economic factors has been successfully conducted for another exotic crayfish species, i.e., Pacifastacus leniusculus in Finland (Kirjavainen & Sipponen,2004) and Sweden (Gren et al., 2009).
Which option is the most profitable socioeconomically?
The results of the simulations showed that reducing the fishingseason from 8 to 4 months while maintaining the same fishing effort did not reduce the annual fishing volume. The new fishing periodproposed in Strategy 2 (from September 1st to December 31st)included two of the highest fishing production months (Septemberand October), excluding the lower production months (January,February and March). These results support the possibility ofreducing the current fishing season since the fishing volume is lowduring the early months of the year due to the decreased metabolicrate of P. clarkii.
For example, during 1999 and 2000 over 75% of the crayfish biomass captured by fishing in Doñana was obtained between Julyand November (Montes et al., 2001).
Strategy 2 provided 183 tons/year of annual crayfish production. This value can be considered important when it is placed in the context of the Lower Guadalquivir, in which the total production is estimated at 900-1000 tons/year (Montes et al., 2001), thus representing 18.3% of the total production. On the other hand, the time of the year when the fishing is carried out (in relation to the crayfish cycle life) is an important factor to consider in order to obtain captures of crayfish that ensure a threshold value for the abundance of individuals with the minimum marketable size. The size of harvested crayfish affects their market price. For example, medium-sized crayfish (30–40 individuals/kg) cost 0.24–0.30 €/kg, and large-sized crayfish (20–30 individuals/ kg) cost 1.05/1.20 €/kg. The latest mean value of the crayfish caught by fishermen was 1.1 €/kg (Martin-López et al., 2011). It is important to highlight that crayfish harvesting in the Lower Guadalquivir River represented 96.5% of the total transaction volume of the foreign trade of products from inland fishing in the Andalucía region during 2010 and 2011, providing gains of 7.73 and 6.93 × 10⁶ €/year, respectively, in trade with the United States, France and Finland, the main buyers of Spanish crayfish (Consejería de Agricultura, Pesca y Medio Ambiente, 2013). The annual minimum value of crayfish in markets is usually reached in September and October due to high fishing production in these months and a greater supply of crayfish (Figure 9). This means that Strategy 2 would be less advantageous if we only consider economic criteria (Table 4). The time of year when fishing iscarried out can modulate the population dynamics of crayfish and their size distribution (e.g., dense populations of smallerindividuals vs. sparse populations of larger individuals). In fact,Cano & Ocete (2000) observed that the mean size of crayfish fromdifferent habitats of the Lower Guadalquivir River (rice fields,channels and marshes) increases in December, which suggests anaging population, while a decrease in the mean size of the crayfishwould suggest a shift toward juveniles.
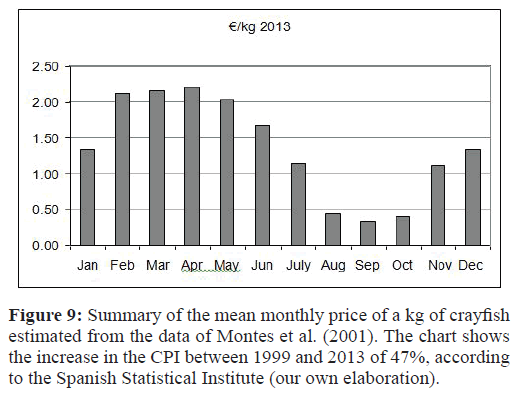
Figure 9:Summary of the mean monthly price of a kg of crayfish estimated from the data of Montes et al. (2001). The chart shows the increase in the CPI between 1999 and 2013 of 47%, according to the Spanish Statistical Institute (our own elaboration).
Table 4. Summary of fishery values used in the simulations of the two proposed management strategies. Strategy 1: Distributed fishing effort; Strategy 2: Concentrated fishing effort.
| |
Strategy 0 (no fishing) |
Strategy 1 |
|
Strategy 2 |
| Min. |
Max. |
Min. |
Max. |
| Total fishing days (days/year) |
0 |
227 |
227 |
122 |
122 |
| Traps/day/ha |
0 |
7.5 |
74 |
14.1 |
125 |
| Traps/year/ha |
0 |
1711 |
16798 |
6150 |
15111 |
| Annual crayfish biomass (kg/ha) |
6774 |
3564 |
6425 |
4090 |
6480 |
| Annual fishing biomass (kg/ha) |
0 |
168 |
843 |
230 |
1036 |
| Annual fishing production (€/ha) |
0 |
151 |
638 |
136 |
499 |
However, the negative influence of the autumn fishing on crayfish size could be countered if fishermen would supplement the fishing effort within ‘Brazo del Este’ with fishing in channelsor rice fields from December to September.
Crayfish populations can have several breeding periods in different seasons of the year according to environmental conditions. These breeding periods can occur in spring (when rice fields are being flooded), in mid–late summer (rice fields are flooded), and late autumn–winter (natural flooding due to heavy rains) (Cano & Ocete, 2000; Alcorlo et al., 2008). The result is that there are always crayfish populations with fishable–sized individuals in thedifferent habitats of the Lower Guadalquivir River.
Which of the two strategies would better reduce the fishingimpacts on ecosystems?
The effect of reducing the fishing impact within ‘Brazo del Este’ was noted some years ago when a closure of the season was implemented between April 15th and September 15th (Asensio, 1991). Fishing activity was regulated in relation to how traps should be set up to minimize the impact on the fauna. In fact, Diaz et al., (2002) showed that if the fishermen set up the trap with a pocket of air in its distal part, the mortality of trapped fish, amphibians and reptiles decreased considerably. For this reason, the main impact from crayfish harvesting becomes the damage done by fishermen walking along the banks and the consequent disruption of the vegetation and wildlife, and the sediment removed due to setting up and removing the traps (Geiger et al., 2005). These impacts, moreover, could cause more or less negative effects on ‘Brazo del Este’ depending on the hydrological levels of the ecosystem, water quality, effects of drought on vegetation, and extreme hydrological events such as heavy rains or floods. Overall, a reduction from 8 to 4 months of the fishing season would be beneficial to ensure the ecological integrity of this protected natural area; therefore Strategy 2 is the most suitable management option. This strategy follows the restrictions imposed by the regulations developed forcontrolling the expansion of exotic species (BOJA 152, 2016).
Conclusion
The management of the fishing activity within the ‘Brazo del Este’ natural protected area should consider the guidelines obtained from results of the simulation and predictive models concerning the effects of fishing activity on the population dynamics of P. clarkii. Considering the economic criteria, Strategy 2 seems to present some economic disadvantages in comparison to Strategy 1. However, considering the environmental criteria, Strategy 2 would be the most appropriate. Therefore, a modification of the duration of the open fishing season according to guidelines fromStrategy 2 should be recommended. The fishing effort considered in this strategy would provide 183 tons/year of crayfish biomass,which would ensure the development of socioeconomicallybeneficial fishing activities and long–term sustainable yields fromthe ‘Brazo del Este’ area. The reduction of the fishing season withinthis natural protected area could be augmented with fishing in ricefields between April and September. Indeed, fishing in channelsand rice fields could help to control the structural damage causedby crayfish in rice field walls as described in the Doñana area andother Mediterranean wetlands such as the Ebro Delta, as well ason the rice seeds and seedlings. Thus, fishermen could offset theeconomic losses, if any, from the new regulations on the openfishing season with the economic benefits resulting from fishingin other habitats close to ‘Brazo del Este’. Ecological modeling bysimulation is useful in managing natural resources such as crayfishas they allow one to ‘experience’ different management optionsand to evaluate their results before having to implement them inreal ecosystems. Indeed, it may be necessary to build simulationmodels considering each type of habitat where P. clarkii occursbecause each habitat will have a different hydroperiod and thus itscrayfish populations will show differences in their breeding cycles.Consequently, our methodological approach and results should beconsidered as a tool to improve the European Non Native Speciesin Aquaculture Risk Assessment for species not included in AnnexIV (e.g. Procambarus clarkii), of the EU Alien Species Regulationwhich is needed.
Acknowledgement
We thank Miguel Angel Bravo, Yolanda Díaz, and Marina Otero for their valuable assistance with field collections. This study was supported by the “Consejería de Medio Ambiente, Junta de Andalucía“, under the following project title: Evaluación del recurso, ordenación pesquera y cultivo del cangrejo rojo (Procambarus clarkii) en el Bajo Guadalquivir” and the FEDER funded project “Bioaccumulation and transformation of heavy metal and arsenic levels by Red Swamp Crayfish (Procambarus clarkii) populations living in the area affected by the Aznalcóllar mine accident and their implications for human consumption”.The authors declare no conflict of interest.
24370
References
- Acosta, C.A., Perry, S.A. (2000) Effective sampling area: A quantitative method for sampling crayfish populations in freshwater marshes. Crustaceana 73, 425-431.
- Alcorlo, P., Geiger, W., Otero, M. (2008) Reproductive biology and life cycle of the invasive crayfish Procambarus clarkii (Crustacea: Decapoda) in diverse aquatic habitats of South-Western Spain: Implications for populations control. Archiv Hydrobiol 173, 197-212.
- Alcorlo, P., Baltanás, A. (2013) The trophic ecology of the red swamp crayfish (Procambarus clarkii) in Mediterranean aquatic ecosystems: a stable isotope study. Limnetica 32, 121-138.
- Anastácio, P.M., Marques, J.C. (1995) Population biology and production of the red swamp crayfish Procambarus clarkii (Girard) in the lower Mondego River Valley, Portugal. J Crustacean Biol 15, 156-168.
- Anastácio, P.M., Marques, J.C. (1996) Crayfish (Procambarus clarkii) effects on initial stages of rice growth in the Lower Mondego River valley, Portugal. Freshwater Crayfish 11, 608-618.
- Anastácio, P.M., Nielsen, S.N., Marques, J.C. (1999) CRISP (Crayfish and Rice Integrated System of Production): 2. Modelling crayfish (Procambarus clarkii) population dynamics. Ecol Model 123, 5-16.
- Anastacio, P.M., Parente, V.S., Correia, A.M. (2005) Crayfish effects on seeds and seedlings: identification and quantification of damage. Freshwater Biol 50, 697-704.
- Angeler, D.G., Sánchez-Carrillo, S., García, G., Álvarez-Cobelas, M. (2001) The influence of Procambarus clarkii (Cambaridae, Decapoda) on water quality and sediment characteristics in a Spanish floodplain wetland. Hydrobiologia 464, 89-98.
- Asensio, J.M. (1991) Impact of the capture of the red crab on other animal populations of the Brazo del Este. J Andalus Humid Areas 1190, 107-115.
- BOJA 60, of July 27, 1989. LAW 2/1989, of July 18, which approves the Inventory of Protected Natural Areas of Andalusia, and additional measures are established for their protection.
- BOJA 60, of May 23, 1996. Order of April 23, 1996, regulating the exercise of fishing for red crab, Procambarus clarkii, in the Natural Area of Brazo del Este (Seville).
- BOJA 95, of August 20, 1996. Order of August 8, 1996, which modifies the Order of April 23, 1996, which regulates the exercise of fishing for the red crab, Procambarus clarkii, in the Paraje Natural del Brazo del Este (Seville).
- BOJA 152, of August 9, 2016. Order of August 3, 2016, which approves the Control Plan of the Red Crab (Procambarus clarkii) in the Marshes of the Guadalquivir.
- Cano, E., Ocete, M.E. (1994) Data on the carrying capacity of the Lower Guadalquivir marshes with respect to Procambarus clarkii Girard (Decapoda, Cambaridae). Pest Health Bulletin 20, 145-149.
- Cano, E., Ocete, M.E. (2000) Average size and reproductive ecology of Procambarus clarkii (Girard, 1852) (Decapoda, Cambaridae) in the marshes of the Lower Guadalquivir. Zoology Baetica 11, 17-26.
- Clark, D.F., Avault Jr, J.W., Meyers, S.P. (1975) Effects of feeding, fertilization and vegetation on production of red swamp crayfish, Procambarus clarkii. Freshwater Crayfish 2, 125-138.
- Ministry of Agriculture (2013) Fisheries and Environment, Junta de Andalucía.
- Constanza, R., Voinov, A. (2001) Modelling ecological and economic systems with STELLA: part III. Ecol Model 143, 1-7.
- Copp, G. H., Godard, M. J., Russell, I. C., Peeler, E. J., Gherardi, F., et.al (2016) A preliminary evaluation of the European Non‐native Species in Aquaculture Risk Assessment Scheme applied to species listed on Annex IV of the EU Alien Species Regulation. Fisheries Manag Ecol 23, 12-20.
- Dew, I.M. (2001) Theoretical model of a new fishery under a simple quota management system. Ecol Model 143, 59-70.
- Díaz, Y., Otero, M., Baltanás. A., Montes, C. (2002) Impact of the fishing of the red crab (Procambarus clarkii) in the Natural Area of Brazo del Este (Seville). XI Congress of the Spanish Association of Limnology, Madrid, Spain.
- Duarte, C., Montes, C., Agustí, S., Martino, P., Bernués, M., et al. (1990) Biomass of aquatic macrophytes in the marsh of the Doñana National Park (SW of 601 Spain): importance and environmental factors that control its distribution. Limnetica 6, 1-12.
- García-Llorente, M., Martín-López, B., Nunes, P.A., González, J.A., Alcorlo, P., et.al (2011) Analyzing the social factors that influence willingness to pay for invasive alien species management under two different strategies: eradication and prevention. J Environ Manage 48, 418-435.
- Geiger, W., Alcorlo, P., Baltanás, A., Montes, C. (2005) Impacts of an introduced Crustacean on the trophic webs of Mediterranean wetlands. Biol Invasions 7, 49-73.
- Gren, M., Campos, M., Edsman, L., Bohman, P. (2009). Incomes, attitudes and occurrences of invasive species: an application to signal crayfish in Sweden. J Environ Manage 43, 210-220.
- Gutiérrez-Yurrita, P.J. (1997) The ecological role of the red crab, Procambarus clarkii, in the aquatic ecosystems of the Donana National Park. A 621 Ecophysiological and Bioenergetic Perspective. Ph.D. Thesis, Department of Ecology, Faculty of Sciences, Autonomous University of Madrid p, 348.
- Habsburgo-Lorena, A.S. (1983) Socioeconomic aspects of the crawfish industry in Spain. Freshwater Crayfish 5, 552-554.
- Hein, C.L., Vanderzanden. M.J., Mangnuson, J.J. (2007) Intensive trapping and increased fish predation cause massive population decline of an invasive crayfish. Freshwater Biol 52, 1134-1146.
- Holdich, D.M., Gydemo, R., Rogers, G.M. (1999) A review of possible methods for controlling nuisance populations of alien crayfish. In: F. Gherardi and D.M. Holdich (Eds.), Crustacean Issues 11: Crayfish in Europe as Alien Species (How to make the best of a bad situation?) Rotterdam, Netherlands pp, 245-270.
- Huner, J.V. (1978) Crawfish population dynamics as they affect production in several small open commercial crawfish ponds in Louisiana. J World Aquacult Soc 9, 1-8.
- Jorgensen, S.E. (1988) Fundamentals of ecological modelling, First edition. Elsevier, Elsevier Science Publishers B p, 391.
- Kirjavainen, J., Sipponen, M. (2004) Environmental benefit of different crayfish management strategies in Finland. Fisheries Manag Ecol 11, 213- 642.
- Marchi, M., Jørgensen, S.E., Becarés, E., Corsi, I., Marchettini, N., et.al (2011a) Resistance and re-organization of an ecosystem in response to biological invasion: Some hypothesis. Ecological Modelling 222, 2992-3001.
- Marchi, M., Jørgensen, S.E., Becarés, E., Corsi, I,, Marchettini, N., et.al (2011b) Dynamic model of Lake Choza (León, NW Spain)-Decrease in eco- exergy from clear to turbid phase due to introduction of exotic crayfish. Ecol Model 222, 3002-3010.
- Martín-López, B., García-Llorente, M., Palomo, I., Montes, C. (2011) The conservation against development paradigm in protected areas: Valuation of ecosystem services in the Doñana social-ecological system (southwestern Spain). Ecol Econ 70, 1481-1491.
- Molina, F. (1984) The fishing of the American red crab and its influence in the surroundings of the Doñana park. Journal of Andalusian Studies 3, 151-160.
- Montes, C., Bravo-Utrera, M.A., Baltanás, A., Duarte, C., Gutiérrez-Yurrita, P.J. (1993)nEcological bases for the management of the Red Crab of the Marshes in the Doñana National Park (Technical Report). ICONA, Ministry of Agriculture and Fisheries. Madrid, Spain. p,207.
- Montes, C., Martínez, J., Otero, M., Díaz, Y., Baltanás, A. (2001) Evaluation of the resource, fishery management and cultivation of the red crab (Procambarus clarkii) in the Lower Guadalquivir (Technical Report). Department of Ecology UAM – Egmasa. p,315.
- Payne, J.F. (1996) Adaptive success within the cambarid life cycle. Freshwater Crayfish 11, 1-12.
- Ramalho, R.O., Correia, A.M., Anastácio, P.M. (2008) Effects of density on growth and survival of juvenile Red Swamp Crayfish, Procambarus clarkii (Girard), reared under laboratory conditions. Aquac Res 39, 577-586.
- Romaire, R. (1976) Population dynamics of red swamp crawfish, Procambarus clarkia (Girard), in ponds receiving fertilization and two agricultural forages as supplemental feed. M.S. Thesis, Lousiana State University, Baton Rouge.
- Savini, D., Occhipinti-Ambrogi, A., Marchini, A., Tricarico, E., Gherardi, F., et.al (2010) The top 27 animal alien species introduced into Europe for aquaculture and related activities. J Appl Ichthyol 26, 1-7.
- Tablado, Z., Tella, J.L., Sánchez-Zapata, J.A., Hiraldo, F. (2010) The paradox of the long-term positive effects of a North American crayfish on a European Community of predators. Conserv Biol 24, 1230-1238.


