Keywords
Water quality, environmental impacts, marine aquaculture, Karaburun Peninsula
Introduction
Global demand for aquatic food products is increasing, the production from capture fisheries has levelled off, and most of the main fishing areas have reached their maximum potential. Sustaining fish supplies from capture fisheries will, therefore, not be able to meet the growing global demand for aquatic food (Anonymous, 2006). In recent years, aquaculture production has been rapidly developing in all over the world (Silvert and Sowles, 1996; Karakassis et al., 2000; Tovar et al., 2000; Sàra et al., 2004). This development has been balancing decreasing natural fish reserves. Further, aquaculture carries weight with healthy and balanced diet (Güven and ?ener, 2005).
More than 220 species of finfish and shellfish are farmed; the range includes giant clams, which obtain most of their nutrients from symbiotic algae; mussels, which filter plankton; carps, which are mainly herbivorous; and salmon, which are carnivorous (Naylor et al., 2000).
Development of aquaculture industry generates profit and income, but it also bears risks of negative environmental impacts which are discharge of untreated wastes into coastal waters, landscape modification, harmful genetic interactions with wild fish, transfer of parasites and diseases, displacement of wild fish populations, use of chemical and antibiotics or biodiversity change (Tovar et al., 2000; Weber, 2003).
Turkey with 8333 km coastline and 25 million hectare utilizable sea water has a bright future for marine aquaculture. The sea which is semi-closed geographical position has different biological, physical, chemical and ecological characteristics. There is a great potential for aquaculture development in Turkey. Sparus aurata is first cultured finfish species in Turkey. (Deniz et al., 1997; Deniz, 1999).
In order to reduce the negative impact of aquaculture, several countries arranged some policies, regulations and legal directives which include environmental monitoring studies (Dosdat and De La Pomelie, 2000; Fernandes et al., 2000; Jonsson, 2000; Maroni, 2000; McMahon, 2000; Papoutsoglou, 2000; Rosenthal and Hilge, 2000; Sánches-Mata and Mora, 2000; Varjopuro et al., 2000; Costello et al., 2001; Lee et al., 2003; Read and Fernandes, 2003).
The aim of this study was the monitor probable impacts of marine aquaculture farm produced Sparus aurata and Dicentrarchus labrax on water column and sediment in vicinity Karaburun Penunsula. In this way, negative impacts for public health and environment were determined. Therefore, this study will lead the way to all aquaculture society and legislators.
Material and Methods
The impact of marine aquaculture on water column and sediment was studied in the Gülbahçe Bay in the Karaburun Peninsula in Izmir (Turkey, Eastern Aegean Sea). In the region (Fig. 1), a cage station (Gülbahçe Cage Station - GBC) and a reference station (Gülbahçe Reference Station - GBR) are determinated. Sea bream and sea bass were produced in marine cages in the farm that was located at a distance no less than 100 m from the shore. Total annual production of the farm was 1000 tonnes.
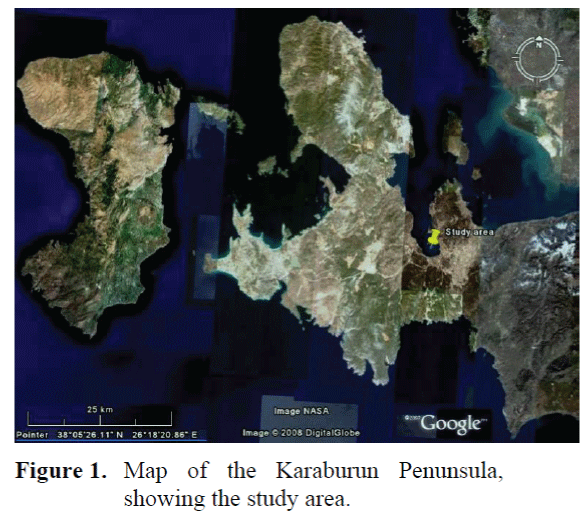
Figure 1. Map of the Karaburun Penunsula, showing the study area.
Posidonia sp., P. oceanica and Zosteria marina were observed under the cages by Koçak and Kata?an (2005).
Yücel Gier et al. (2004) reported that mean current velocity was 5.01 cm/s in the winter season and 5.49 cm/s in the summer season, furthermore current direction was east to west in the winter season and both west and east in the summer season in the area.
The water and the sediment samples were collected monthly during December 2004 - November 2005 at 2 stations. The water was filled from the surface (about 0.3 m depth) and the bottom (about 1 m above from the bottom) in the polyethylene bottles. Water and sediment samples were brought back to the laboratory and processed within a few hours.
All ionic nutrient, salinity, organic carbon (%) and amount of burnable substances (%) analyses were conducted in the Ege University Fisheries Faculty Water Chemistry Laboratory. Dissolved nitrite, nitrate, ammonia, phosphate and silicate are quantified on a spectrometer that is Spectronic 21 trademark (Strickland and Parsons, 1972; Parsons et al., 1984). Salinity was determined using the Mohr-Knudsen method.
Temperature was measured by using a graduated lab thermometer and pH with a Orion 420 A in situ. Dissolved oxygen (DO) was determined using the Winkler method.
Modified Walkley-Black titration method was used for organic carbon determination in the sediments (Gaudette et al., 1974). Amount of burnable substances of the sediments were determined as the percentage of weight loss by ignition (600°C) for 2 hours and then obtained values were calculated by following formula (Egemen, 2000).
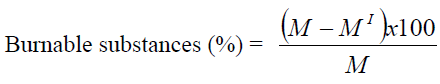
M = Weighing sediment sample (g)
M? = After ignition weighing sediment sample (g)
The SPSS 11.0 statistical package was used to perform attained data.
Results and Discussion
Physico-chemical parameters
Measured values for the water temperature changed between 13.5 – 31.0 ºC in the Gülbahçe Bay. All of the stations are alkaline-slightly alkaline type with 8.29 and 7.92 pH values. The salinity ranged between 33.93 - 39.78 psu in the stations. Surface concentration of the DO varied from 6.00 - 9.20 mg/L for the Gülbahçe Bay. Bottom concentration of the DO varied from 6.80 - 9.60 mg/L for the Gülbahçe Bay (Table 1). Any statistical significant difference was not detected for the water temperature, pH, the salinity and the DO between cage and reference stations in the region (p>0.05).
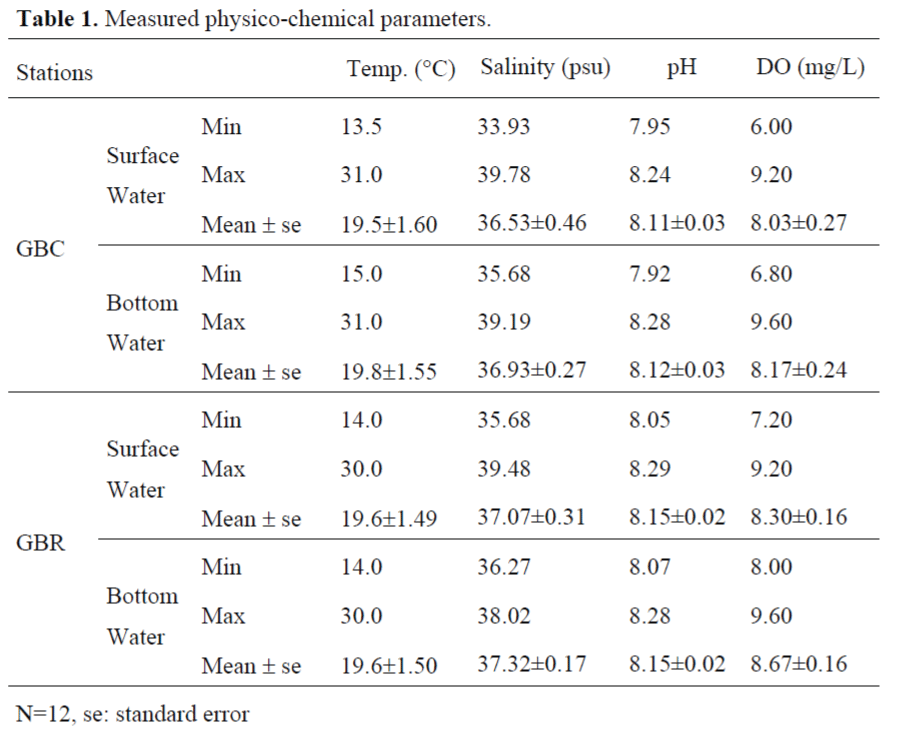
Table 1. Measured physico-chemical parameters.
The secchi disc depths had the maximum score (14 m) in the GBR and the minimum score (4 m) in the GBC. Statistical significant differences were detected for the secchi disc depths between the GBC and the GBR (p<0.05). The secchi disk depths are given Figure 2.
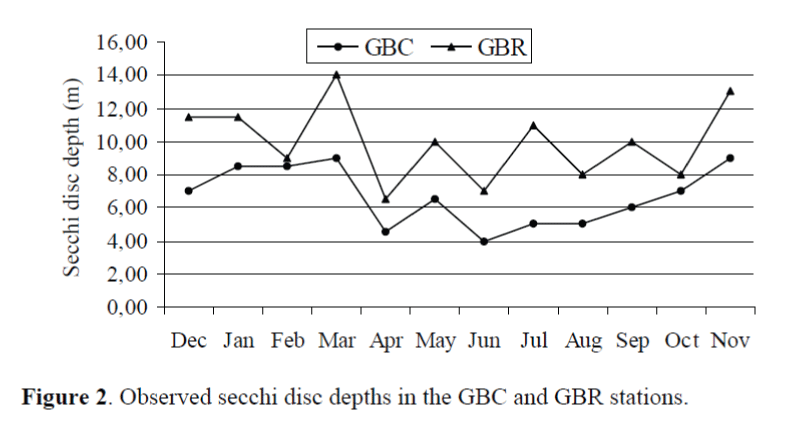
Figure 2. Observed secchi disc depths in the GBC and GBR stations.
Nutrients
Nitrite-N concentration in the Gülbahçe Bay did not exceed 0.24 μg-at/L at any time during the study. Nitrite-N concentration reached the maximum values of 0.24 μg-at/L in the GBR in December. Minimum nitrite-N concentration was not detected because it was below the detection limits. Statistical significant differences were detected for the concentration of nitrite-N between the GBC and the GBR (p<0.05).
Nitrate-N concentration was detected between 0.04 μg-at/L in the GBR in December and 0.80 μg-at/L in the GBC in May. Any statistical significant differences were not detected (p>0.05).
Minimum ammonia-N was 0.15 μg-at/L in the GBC in January. The concentration of ammonia- N reached the maximum of 1.70 μg-at/L in the GBC in June. Statistical significant differences were detected for the concentration of ammonia-N between the GBC and the GBR (p<0.05).
Phosphate-P concentration did not exceed 0.32 μg-at/L at any time during the study. The minimum phosphate-P concentration was not detected because it was below the detection limits. Any statistical significant differences were not detected (p>0.05).
Minimum silicate concentration was 0.11 μgat/ L in the GBC in June and in the GBR in August. Silicate concentration did not exceed 6.35 μg-at/L in the GBR in January. Any statistical significant differences were not detected (p>0.05)
The Organic Carbon and the Amount of Burnable Substances
The concentration of organic carbon was measured minimum at 1.22 % in the GBR in November, maximum 11.81 % in the GBR in January and the amount of burnable substances was measured minimum 4.36 % in the GBR in December, maximum 28.11 % in the GBR in March in the sediment samples. Any statistical significant difference was not detected for the concentration of organic carbon and the amount of burnable substances (p>0.05).
The water temperature is important for living organisms in aquatic environment (Egemen, 2006). Huge differences were not detected between cage and reference stations (p>0.05) and normal seasonal variation was observed. An investigation that was studied by Aksu (2005) in Gülbahçe Bay indicated similar results for the water temperature (p>0.05).
pH of the ocean and sea water was generally between 7.5-8.4 (Geldiay and Kocata?, 1998). Measured pH values were within this limits and showed small variations.
The salinity is approximately between 33-39 psu in the Aegean Sea (Poulos et al., 1997; Friligos and Krasakopoulou, 2001). Measured salinity values were in these this limits and showed a bit seasonal variatiations. In an investigation that was studied by Ak and Ho?sucu (Ak and Ho?sucu, 2001) the salinity was detected between 36.15 - 38.61 psu in the same region.
The DO values are below the optimum level of 5.0 mg/L during tides with the high organic loading from fish wastes and excess feeds (Jacinto, 2006). This value was accepted to critical DO level in sea water by Dirican (2005). Detected DO values were not bellow 6.0 mg/L in the study area.
The secchi disc depth is an indicator of relative primary production and pollution levels in the marine environment (Ergen et al., 2006). The secchi disk depth in the GBR was observed higher than the GBC (p<0.05). This result is probably due to the fish farming activities (fish feces, fish feed). Finner particulates lead to increased turbity in the vicinity of fish farms (Silvert and Sowles, 1996). 300.000 kg x 1.8 (FCR)/year feed draw into the study area.
Nutrient levels in clear and polluted seawater are shown on the Table 2.
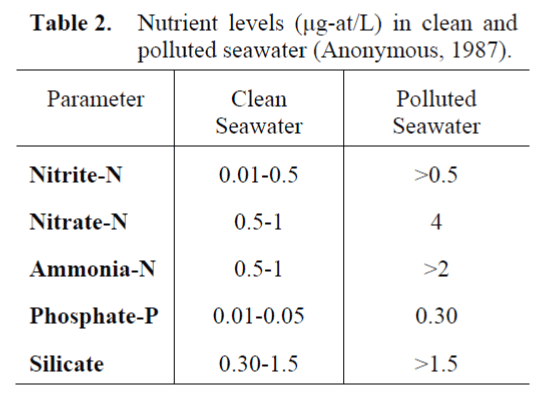
Table 2. Nutrient levels (μg-at/L) in clean and polluted seawater (Anonymous, 1987).
According to the Table 2, the seawater in this study has poor character for phosphate-P and silicate and weak for ammonia-N. The fish farm and their effluents are probably responsible for the poor water quality observed. But, only ammonia- N in this three inorganic nutrients was observed higher in the GBC than the GBR (p<0.05).
Carbon and amount of burnable substances are the most important indicators for the pollution in marine sediments (Ayd?n and Sunlu 2004; Sunlu et al., 2005). The organic matter generated is likely to be found scattered over a wide “action zone” surrounding the farms, rather than directly under the cages (Maldonado, 2005).
Probably the current system in the area was caused similar effect for phosphate-P and silicate on GBC and GBR in this study.
Conclusions
The results from the area indicated a substantial increase in organic carbon, in the amount of burnable substances and the concentrations for each of the three inorganic nutrients (phosphate-P, silicate and ammonia-N). The source of the dominant nutrient input and organic enrichment in the area was possibly due to the fish feed and fish excretion.
Coastal water has much more variable water quality and anthropogenic activities affect easily on it.
Lack of heavy industry facilities and urbanization in the area leads to the conclusion that nutrients and organic load are built up due to the fish farming activities, mineralization and the effects of wind and water movements.
We therefore suggest taking into consideration the following chief goals: (I) Choosing of the place where fish farming will be practiced, (II) using certified legal chemicals, (III) development and application of integrated farming systems, (IV) development of feeding and management strategies, (V) arrangement of seminars and brochures for the fish farmers.
1459
References
- Ak, Y., Hoşsucu, B., (2001), İzmir Körfezi kemikli balıklarına ait pelajik yumurta ve larvaların tür çeşitliliği, dağılımı ve bolluğu. Ege Üniversitesi Su Ürünleri Dergisi, 18(1- 2): 155-173
- nAksu, M., (2005), İzmir Körfezi’nin farklı bölgelerindeki bazı balık çiftliklerinin sucul çevreye etkilerinin karşılaştırılması, Doktora Tezi, Danışman Kocataş, A., Ege Üniv. Fen Bilimleri Enstitüsü, İzmir
- nAnonymous, (1987), CRC handbook of chemistry and physics, 68th Edn., CRC Press, Boca Raton, Florida
- nAnonymous, (2006), State of world aquaculture: 2006, 134, FAO Fisheries Technical Paper 500; Rome
- nAydın, A., Sunlu, U., (2004), Güney Ege Denizi sedimentlerinde karbon ve yanabilen madde düzeylerinin araştırılması. Ege Üniversitesi Su Ürünleri Dergisi, 21(3-4): 229-234
- nCostello, M.J., Grant, A., Davies, I.M., Cecchini, S., Papoutsoglou, S., Quigley, D., Saroglia, M., (2001), The control of chemicals used in aquaculture in Europe. Journal of Applied Ichthyology, 17: 173-180
- nDeniz, H., (1999), Marine aquaculture in Turkey and potential finfish species, Recent advences in Mediterranean aquaculture finfish species diversification, Seminar of the CIHEAM Network on Technology of Aquaculture in the Mediterranean, 349-358, Zaragoza, Spain
- nDeniz, H., Korkut, A.Y., Tekelioğlu, N., (1997), Developments in the Turkish marine aquaculture sector, Mediterranean offshore mariculture, Advanced Course of the CIHEAM Network on Technology of Aquaculture in the Mediterranean, 71-77, Zaragoza, Spain
- nDirican, S., (2005), Salih Adası (Bodrum-Muğla) civarında su ürünleri yetiştiriciliğinin dip canlıları üzerine etkisinin araştırılması. Doktora Tezi, Danışmanı Katağan, T., Ege Üniv. Fen Bilimleri Enstitüsü, İzmir
- nDosdat, A., De La Pomelie, C., (2000), Regulation and monitoring of marine aquaculture in France, Journal of Applied Ichthyology, 16: 157-162
- nEgemen, Ö., (2000). Çevre ve su kirliliği, 120, Ege Üniv. Su Ürünleri Fakültesi Yayın No:42, İzmir
- nEgemen, Ö. (2006), Su kalitesi (ders kitabı), 150, Genişletilmiş VI. Baskı, Ege Üniversitesi Su Ürünleri Fakültesi Yayın No:14, İzmir
- nErgen, Z., Çınar, M.E., Dağlı, E., Kurt, G., (2006), Seasonal dynamics of soft-bottom polychaetes in İzmir Bay (Aegeran Sea, Eastern Mediterranean). Scientia Marina, 70 S3: 197- 207
- nFernandes, T., Miller, K.L., Read, P.A., (2000), Monitoring and regulation of marine aquaculture in Europe. Journal of Applied Ichthyology, 16: 138-143
- nFriligos, N., Krasakopoulou, E., (2001), Chemical observations in the seawater and surface sedimentsof the Aegean Sea, 7th Intarnational Conference on Environmental Science and Technology, Ermoupolis, Syros Island, Greece
- nGaudette, H.E., Flight, W.R., Toner, L., Folger, W., (1974), An inexpensive titration method for determination of organic carbon in recent sediments. Journal of Sedimentory Petrology, 44(1): 249-253
- nGeldiay, R., Kocataş, A. (1998), Deniz Biyolojisine Giriş, 562, Ege Üniv. Fen Fakültesi Kitaplar Serisi; 31, İzmir
- nGüven, E., Şener, E., (2005), Ağ kafeslerde kullanılan yemlerin deniz kirliliğine etkisi, 359-367; Deniz kirliliği, temel kirleticiler ve analiz yöntemleri, uluslar arası sözleşmeler; Tüdav Yayınları 21, İstanbul
- nJacinto, G.S., (2006), Case studies: fish cage farming in coastal waters, Environmental, Biological, Social and Governance Issues, pp.48-56, In: B.V.L. Querijero, C.R. Pagdilao and S.V. Ilagan (eds.). Guidelines in the Establishment of Fish Cages and Other Structures in Lakes and Coastal Waters, 174, PCAMRD Book Series No. 36/2006, Los Baños, Laguna, Philippines
- nJonsson, G.S., (2000), Licensing, monitoring and regulation of aquaculture in Iceland. Journal of Applied Ichthyology, 16: 172-176
- nKarakassis, I., Tsapakis, M., Hatziyanni, E., Papadopoulou, K.N., Plaiti, W., (2000), Impact of cage farming of fish on the seabed in three Mediterranean coastal areas. ICES Journal of Marine Sciences, 57: 1462-1471
- nKoçak, C., Katağan, T., (2005), İzmir Körfezi (Ege Denizi, Türkiye)’nde yer alan üç balık çiftliğinin makrofauna üzerine etkilerinin karşılaştırılması. Ege Üniversitesi Su Ürünleri Dergisi, 22(3-4), 287-296
- nLee, J.H.W., Choi, K.W., Arega, F., (2003), Environmental management of marine fish culture in Hong Kong. Marine Pollution Bulletin, 47: 202-210
- nMaldonado, M., Carmona, M.C., Echeverría, Y., Riesgo, A., (2005), The environmental impact of Mediterranean cage fish farms at semi-exposed locations: does it need a re-assessment? Helgoland Marine Research, 29(2): 121-135
- nMaroni, K., (2000), Monitoring and regulations of marine aquaculture in Norway. Journal of Applied Ichthyology, 16: 192-195
- nMcmahon, T., (2000), Regulation and monitoring of marine aquaculture in Ireland. Journal of Applied Ichthyology, 16: 177-181
- nNaylor, R.L., Goldburg, R.J., Primavera, J.H., Kautsky, N., Beveridge, M.C.M, Clay, J., Folke, C., Lubchenco, J., Money, H., Troel, M., (2000), Effect of aquaculture on world fish supplies. Nature, 405: 1017-1024
- nPapoutsoglou, S.E., (2000), Monitoring and regulation of marine aquaculture in Greece; licensing, regulatory control and monitoring guidelines and procedures. Journal of Applied Ichthyology, 16: 167-171
- nParsons, T.R., Maita, Y., Lalli, M., (1984), A manual of chemical and biological methods for sea water analysis, 173, Pergamon Pres., New York
- nRead, P., Fernandes, T., (2003), Management of environmental impacts of marine aquaculture in Europe, Aquaculture, 226: 139-163
- nRosenthal, H., Hilge, V., (2000). Aquaculture production and environmental regulations in Germany. Journal of Applied Ichthyology, 16, 163-166
- nSánchez-Mata, A., Mora, J., (2000), A review of marine aquaculture in Spain: production, regulations and environmental monitoring, Journal of Applied Ichthyology, 16: 209-213
- nSarà, G., Scilipoti, D., Mazzola, A., Modica, A., (2004), Effects of fish farming waste to sedimentary and particulate organic matter in a southern Mediterranean area (Gulf of Castellammare, Sicily): a multiple stable isotope study (δ13C and δ15N). Aquaculture, 234: 199-213
- nSilvert, W., Sowles, J.W., (1996), Modelling environmental impacts of marine finfish aquaculture. Journal of Applied Ichthyology, 12: 75-81
- nStrickland, J.D.H., Parsons, T.R., (1972), A practical handbook of sea water analysis, 310, Fisheries Research Board of Canada, Bulletin 167, Ottowa
- nSunlu, U., Aydın, A., Eğrihancı Özçetin, N.E., (2005), Kuzey Ege Denizi sedimentlerinde karbon ve yanabilen madde düzeylerinin araştırılması. Ege Üniversitesi Su Ürünleri Dergisi, 22(3-4): 263-268
- nTovar, A., Moreno, C., Mánuel-Vez, M.P., Garcia- Vargas, M., (2000), Environmental impacts of intensive aquaculture in marine waters. Water Research, 34(1): 334-342
- nVarjopuro, R., Sahivirta, E., Mäkinen, T., Helminen, H., (2000), Regulation and monitoring of marine aquaculture in Finland. Journal of Applied Ichthyology, 16: 148-156
- nWeber, M.L., (2003), What price farmed fish: A review of the environmental & social costs of farming carnivorous fish, 52, Sea Web Aquaculture Clearinghouse; Rhode Island
- nYücel Gier, G., Sayın, E., Pazı, İ., Öztürk, C., Adalıoğlu, S., (2004), Engeceli Limanı suyunun fiziksel özellikleri ve akıntı sisteminin balık çiftliğine olan etkisi. Türk Sucul Yaşam Dergisi, 2(3): Ulusal Su Günleri 2004, 494- 501, İzmir.


