Research Article - (2022) Volume 16, Issue 1
On the Estimation of Cure Rate in the Presence of Prognostic Factors using Various Discrete Count Distributions
Seema Pant1,
Manoj Kumar Varshney2,
Gurprit Grover3 and
Seema Pant4*
1Department of Statistics, Mata Sundri College for Women, University of Delhi, India
2Department of Statistics, Hindu College, University of Delhi, India
3Department of Statistics, Faculty of Mathematical Sciences, University of Delhi, India
4Department of Statistics, Ram Lal Anand College, University of Delhi, India
*Correspondence:
Seema Pant, Department of Statistics, Ram Lal Anand College, University of Delhi,
India,
Email:
Received: 29-Dec-2021, Manuscript No. iphsj-22-12229;
Editor assigned: 02-Jan-2022, Pre QC No. P-12229;
Reviewed: 16-Jan-2022, QC No. Q-12229;
Revised: 21-Jan-2022, Manuscript No. iphsj-22-12229 (R);
Published:
29-Jan-2022, DOI: 10.36648/1791-809X.16.1.910
Abstract
Background: Owing to the new treatments and medicines, many cancer patients get cured of the disease and they do not experience the event of interest (death). Such patients constitute the cure fraction. To analyze survival data related to diseases with cured fraction, cure rate models have been found to be more appropriate as compared to the standard survival models. Promotional Time Cure Rate Model is one such model and it assumes that the patient death may have been caused due to some latent competing causes. In our case we have assumed that the number of competing causes follow either Binomial or Poisson or Negative Binomial Distribution.
Material and Methods: Parameter estimation has been done by Bayesian approach, using Markov Chain Monte Carlo (MCMC) technique. A real dataset from a breast cancer data of 85 patients is used to illustrate the proposed methodology. The software’s Open BUGS and STATA is used for the analysis purpose.
Results: The DIC value of binomial distribution is 143.8 which is least among the three distributions which we have considered for analysis. Also, the predictors Age, tumor size and tumor Grade are found to be significant. The cure rate is found to be 11.58 using the Binomial distribution as the distribution of the latent variable N. The overall cure rate is found to be 13.94 in the presence of predictors.
Conclusion: The findings revealed that Binomial – Exponential distribution with a cure fraction can be an interesting option to explain/predict the survival time and distribution of latent variables in Promotional Time Cure Model as compared to Negative Binomial and Poisson distribution in breast cancer patients.
Keywords
Cure rate; Binomial distribution; Latent variables; Promotional time cure model; MCMC technique; Bayesian estimatese
Introduction
In statistical literature, cure models have been continuing to play a pivotal role. Although under-utilized as a statistical tool, their importance can be understood in studying, characterizing, analyzing and describing survival of cancer patients when observed from a long term perspective. The standard survival models assume the same level of susceptibility to disease for all the subjects. They don’t take into account those subjects who will never experience the event of interest as they are cured of the disease. This calls in the need for special models in the case of diseases like Cancer, HIV where in there are long time survivors or cured patients. Due to the modern treatments and medicines there are some patients who are cured permanently and hence they have the same chance of a relapse or dying from the disease as the individuals who do not have the disease. Such patients are called cured or immunes. Their survival times are censored at the end of the follow- up time. Those patients who do not get cured are called susceptible. By plotting KM curve, we can find out if there is a proportion of patients who are long term survivors and can be put in the category of cured or immunes. A long plateau on the right reflects that there is a cured fraction in the data and cure models should be employed to model the life times of long time survivors.
For estimating cure fraction, we have two types of cure models viz. Mixture Cure Models introduced by Boag2 and Non Mixture Cure Models developed by Yakovlev.
In mixture cure model the survival function of the population is defined as:
S (t) = p + (1- p) S*(t)
where p is the fraction of cured patients and S*(t) denotes the survival distribution of susceptible. Several authors like Borges, Berkson et.al. Cancho et. al. has explored different choices for S*(t). Non Mixture Models have been developed assuming that the cured patients are left with a number of diseased cells which may grow with time and can cause a relapse of the disease. Several parametric and non-parametric approaches have been employed in these models to meet the objective of estimating cure fraction. These models help in estimating the cured proportion in a clinical trial on one hand, while on the other, also offer an estimate on the probability of survival of the uncured patients over certain time window.
Although enjoying considerable popularity on account of its extensive usage, the mixture cure rate model has certain shortcomings based on different factors. Estimating the cure fraction is quite difficult in mixture cure rate model when time-to-event of study is very large. Secondly, the assumption that cause is responsible for occurrence of event, is not always true, as the event of interest may happen due to different latent competing causes during the course of clinical trials. Thirdly, an important property of standard cure rate model is the presence of a proportional hazard structure in uncured patients and not in cure patients. Fourthly, the parameter p (fraction of cured patients), yielding improper posterior distributions for many types of non-informative improper priors on inclusion of covariates through p. This is an important shortcoming of this model. Keeping these shortcomings into consideration, an alternative model named as the Promotion Time Cure Rate model has been found to be more relevant.
The promotion time cure model has couple of advantages over the standard cure rate model. It is based on the assumption that there could be various unobserved latent factors responsible for generating event of interest for each individual. From the perspective of understanding the presence of proportional hazard structure, it can be seen that in Promotion Time Cure Rate Model, there is a proportional hazard structure in presence of cure group unlike the standard cure rate model where this structure is present only in the presence of uncured group. Several authors have utilized this model to obtain the estimates of cure fraction employing different distributions like Generalized Poisson Lindely distribution [1,2], Generalized Power Series distribution [3], Negative Binomial [4], Poisson [5] and Geometric [6,7]. Ortega et al. [8] modeled the survival data with cure fraction using a Negative Binomial-Generalized Gamma distribution. A survival model with long time survivors and random effects using Promotional Time Cure Rate Model had been investigated by Lopes et al [9]. They considered both Classical and Bayesian approaches for parameter estimation. Gallardo et al [10-15] took forward their work by assuming random effects for both survival time of susceptible and cured proportion. They have also developed a Promotional Time Cure Rate model assuming Bivariate Normal distribution for both susceptible and cured proportion [16, 17]. Lambert et al. [18] considered the problem of cure rate estimation in the presence of covariates which affect both long term and short-term survival.
Grover et al. [19] have estimated cure fraction by using Promotional Time Cure Rate model under Negative Binomial-exponential distribution approach. Varshney et al [20] estimated cure fraction among HIV/AIDS patients undergoing antiretroviral therapy (ART) using cure rate models.
As the number of competing causes (N) exhibits count data therefore, we have considered Binomial, Poisson and Negative Binomial distribution for N and have compared them by using DIC. The best fit distribution among them is the one with the minimum value of DIC. We have employed a Bayesian framework for parameter estimation and analysis under Markov chain Monte Carlo (MCMC) techniques in Open BUGS software. We have considered multivariate normal prior for the regression coefficients because conjugate priors exist for exponential distribution and normal distribution belongs to this family [21].
Methods
Promotion time cure rate model (PTCRM)
Let N be the number of carcinogenic cells (Latent Variables that remain actives after treatment) which can produce detectable cancer. Suppose that N follows Poisson distribution with mean alpha (α). Let Yi be the random variable for the time until the ith carcinogenic cell produces a detectable cancer. The variables Yi are assumed to be independent and identically distributed with a common distribution function F (t) =1-S (t) and are also independent of N. For cured subjects, N=0 and it is assumed that P (Y0=∞) = 1. For non-cured subjects, N>0, with Yi, i= 1, 2… N, independent and identically distributed with common survival function S (t). The distribution function F is related to the susceptible and, in general, it is a proper function in the sense that 
The time to relapse of cancer can be defined by the random variable T = min {Yi, 0 ≤ i ≤ N}. In other words, for non-cured individuals, the failure time is the minimum among the times the cells may take to, eventually, produce a detectable cancer whereas cured individuals will never experience the event of interest and the failure time in this case is infinity. Under such conditions, survival function for the random variable T, also called the population survival function, is given by
Spop (t) = P (no cancer by time t)
= P (N=0) +P (Y1 > t, …, YN > t, N ≥ 1)
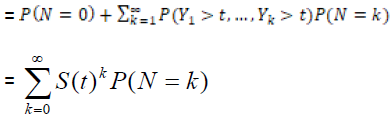
= GN (S(t) , (2)
Where GN (.) is the Probability Generating Function (pgf) of N.
Let us assume that number of competing causes (N) follow Poisson distribution with parameters α
Case 1: N ~ Poisson (α)
So, the probability mass function can be defined as:
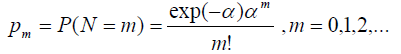
With E (N) = α and V (N) = α
The pgf of N is given by
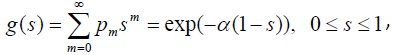
and the survival function for the population becomes
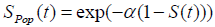 , (using equation (2)) (3)
Where S (t) = exp (-λt) is the survival function of exponential distribution.
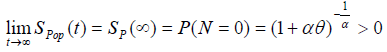
The cure fraction (i.e. the cure rate) in the population, from (3), is given by:
 (4)
(4)
We can also see from (4) that the cure fraction i.e. the cure rate is given by Sp (∞) >0, which is not a proper survival function. As α→ ∞, the cure fraction tends to 0, whereas as α→0, the cure fraction tends to 1. The pdf of population corresponding to Poisson distribution is:
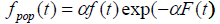 (5)
(5)
where 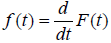 is not a proper pdf as SP (t) is not a proper survival function.
Now 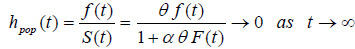
Here fpop (t) and hpop(t) are improper functions, as Spop(t) is not a proper survival function.
In the similar way we can assume the distribution of N to follow Binomial and Negative binomial distribution with parameters (r, p) and (α, θ) i.e.
N~bin (r, p) and N~NB (α, θ) respectively.
Case 2: N~bin (r, p)
So the probability mass function can be defined as:

With E (N) = r p and V (N) = r p (1-p) with
The cure rate is

Case 3: N~NB (α, θ)
Piegorschet.al.20 and Saha K et al [15] estimated cure rate estimation if N follows Negative Binomial Distribution. So, the probability mass function can be defined as:
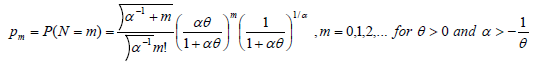
With E (N) = θ and V (N) = θ (1+αθ), so
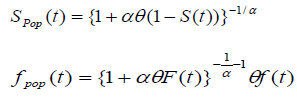
The cure rate is
The likelihood function
Let Ni be the number of carcinogenic cells that can produce detectable tumor cells for the ith (i=1, 2… n) subject. Here Ni’s are independent Negative Binomial random variables with mean θi,, i=1, 2... n. Further assume that Yi1,Yi2,…,YiNi are the iid random variables representing the times for the development of Ni carcinogenic cells in the ith subject, which are unobserved with common cdf F(.), i=1,2,…,n and are observed to follow exponential distribution with mean λ. Let ti denote the failure time and δi denote the censoring time for the ith individual, so that we observe
zi = min (ti , δi),
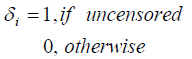
The complete data can be represented by D= (n, z, δ, N). The corresponding likelihood function is then given by:
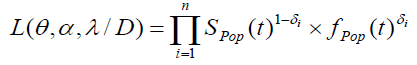
with 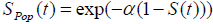 , (as defined in eqn. (3) & (5))

Where S(t) is the survival function of promotion time of N carcinogenic cells that can be from any of the common survival distribution like Weibull, exponential, gamma. Here we have observed that the survival times follow exponential distribution with parameter λ and N follows Poisson distribution with parameter α.
Incorporation of covariates: For the model (2), the covariates are incorporated through the cure rate parameter θ. In the presence of covariates, we have different cure rate parameter θi, for each patient, i =1, 2...n. Let  be the k ×1 vector of covariates and
  be the k ×1 vector of regression coefficients. The covariates depend on cure rate θ through the direct relationship
  , which implies an increase in cure rate with increase in the covariate coefficient, so that the cure rate for patient i is given by:
The parameters are estimated through Bayesian approach using the MCMC technique in Open BUGS software. The significant prognostic factors can be identified using Credible Interval which is the Bayesian analogue of a confidence interval [22,23].
Model comparison criteria
In order to compare the models under Binomial, Poisson and Negative Binomial setup, we use the DIC (Deviance Information Criteria) proposed by which one of the best criterion for the comparison of Bayesian Models is.
The DIC for any model can be defined as follows;
Where  is the deviance average (-2LogLikelihood) over the posterior distribution, and Dˆ is the deviance calculated at the posterior mean parameters.
The model with the smallest value of DIC is known to be the best one.
Results
Analysis is done on 85 breast cancer patients diagnosed from Jan, 2009 to Dec, 2010. About 82.4% of the cases (70 patients) were alive during follow up time. The median age of patients at the time of diagnosis is 49 years. A total of 6 predictors are used in analysis.
The descriptive characteristics of the data are shown in Table 1.
| Predictors |
Frequency |
Mean |
Std. Dev. |
Min |
Max |
| Age |
85 |
50.09 |
12.82 |
25 |
85 |
| Tumor Size |
85 |
3.72 |
1.62 |
1 |
8 |
| Nodal Metastasis |
85 |
4.36 |
4.70 |
0 |
15 |
| Tumor Grade |
85 |
1.96 |
0.71 |
1 |
3 |
| NPI |
85 |
4.81 |
1.34 |
2.12 |
7.6 |
| CA-15 |
85 |
32.08 |
6.16 |
15.2 |
46 |
Table 1 Descriptive characteristics of breast cancer patients (N=85).
To confirm the presence of cured patients in this breast cancer dataset we first plot the Kaplan Meier survival curve.
Figure 1 displays a Kaplan -Meier plot for overall survival, which shows a "plateau" in the survival curve, and thus a cure rare model appears suitable for this data.
The PP plot and QQ plot in Figure 2 justify the use of exponential distribution for the baseline survival function.
Table 2, given below, shows the summary statistics of posterior estimates obtained from Poisson distribution, Negative binomial distribution and Binomial distribution. The DIC value (Table 2) of Binomial distribution is smallest as compared to Poisson distribution and Negative binomial distribution. Hence we use Binomial distribution as latency distribution to estimate cure rate and to find the significant predictors. The cure rate using Binomial distribution is found to be [24].
| Parameters |
Poisson Model |
Negative Binomial Model |
Binomial Model |
| Mean |
SD |
95 % HPD |
Mean |
SD |
95 % HPD |
Mean |
SD |
95 % HPD |
| alpha |
2.335 |
0.341 |
(1.712,3.067) |
0.037 |
0.052 |
(0.006,0.169) |
|
|
|
| lambda |
0.436 |
0.739 |
(0.305,0.601) |
0.436 |
0.076 |
(0.305,0.591) |
0.932 |
0.191 |
(0.616,1.318) |
| theta |
|
|
|
2.337 |
0.345 |
(1.751,3.073) |
|
|
|
| p |
|
|
|
|
|
|
0.854 |
0.020 |
(0.925,0.999) |
| N |
|
|
|
|
|
|
1.124 |
0.226 |
(0.729,1.623) |
| DIC |
176.8 |
178.7 |
143.8 |
Table 2 Posterior estimates obtained using Binomial, Poisson and Negative Binomial Distribution.
| Parameters |
mean |
S D |
val2.5pc |
val97.5pc |
| a0 |
0.1517 |
0.09798 |
0.06649 |
0.4168 |
| Age |
-0.08643 |
0.05337 |
-0.2278 |
-0.03538 |
| tumor size |
-0.03729 |
0.01319 |
-0.05851 |
-0.01543 |
| tumor grade |
0.02717 |
0.01234 |
0.0156 |
0.05842 |
| NPI |
0.02387 |
0.01751 |
-0.0152 |
0.04214 |
| Nodal Metastasis |
0.02141 |
0.02046 |
-0.02012 |
0.05259 |
| CA15 |
0.01773 |
0.02971 |
-0.03375 |
0.06298 |
| K |
0.8977 |
0.5885 |
0.3716 |
2.514 |
| Lambda |
0.3545 |
0.2269 |
0.1521 |
0.9711 |
| p |
0.4856 |
0.2832 |
0.02945 |
0.8983 |
Table 3 Posterior estimates obtained using Binomial Distribution (in presence of Covariates).
Discussions
The purpose of this study is to estimate the cure rate of breast cancer patients under the approach of Promotional Time Cure Model using baseline survival distribution as exponential distribution.
The cure rate models are used to analyze lifetime data with cured fraction. Cured fraction is the proportion of patients who are assumed to be cured and would never experience, the event of interest. We can estimate the cure fraction using cure rate models. These models are based on the assumption that the event of interest (death) can happen because of a single cause, but in practice, it may happen due to different latent competing causes. The model with this assumption is known as Promotional time cure model. As number of carcinogenic cells (competing causes) exhibits count data, and for analyzing count data with over dispersion, it’s preferred to use discrete count distributions such as Binomial, Poisson and Negative Binomial (NB) distribution. In this article we propose this new family of cure rate models (Promotional Time Cure rate model) introduced by Yakovlev and Tsodikov [23]. This paper uses MCMC methods as a reasonable way to get Bayesian inference for analyzing survival data with immunes. On the basis of DIC, we found that Binomial distribution can better explain the latent distribution as compared to Negative binomial and Poisson distribution. On the basis of covariate analysis, we found that age, tumor grade and tumor size are significant prognostic factors.
REFERENCES
- Baghestani AR, Rahimzadeh M, Pourhoseingholi MA (2014) Generalized Poisson-Lindely Distribution in Promotion Time Cure Model. Pak J Stat Oper Res 10.
Google scholar
- Boag JW (1949) Maximum likelihood estimates of the proportion of patients cured by cancer therapy. J R Stat Soc Series B Stat Methodol 11: 15-53.
Indexedat Google Scholar Crossref
- Borges P, Rodrigues J, Balakrishnan N (2012) Correlated destructive generalized power series cure rate models and associated inference with an application to a cutaneous melanoma data. Comput Stat Data Anal 56: 1703-1713.
Indexedat Google Scholar Crossref
- Berkson J, Gage RP (1952) Survival curve for cancer patients following treatment. J Am Stat Assoc 47: 501-515.
Indexedat Google Scholar Crossref
- Cancho VG, Rodrigues J, de Castro M (2011) A flexible model for survival data with a cure rate: a Bayesian approach. Appl Stat 38: 57-70.
Indexedat Google Scholar Crossref
- Chen MH, Ibrahim JG, Sinha D (1999) A new Bayesian model for survival data with a Surviving fraction. J Am Stat Assoc 94: 909-919.
Google Scholar Crossref
- Cooner F, Banerjee S, Carlin BP, Sinha D (2007) Flexible cure rate modeling under latent activation schemes. J Amer Statist Assoc 102: 560-572.
Indexedat Google Scholar Crossref
- Duffy MJ (2006) Serum tumor markers in breast cancer: are they of clinical value? Clin Chem 52: 345-351.
Indexedat Google Scholar Crossref
- Ewell M, Ibrahim JG (1997) The Large Sample Distribution of the Weighted Log Rank Statistic under General Local Alternatives. Lifetime Data Anal 3:5-12.
Indexedat Google Scholar Crossref
- Goldman AI (1984) Survivorship Analysis When Cure is a Possibility: A Monte Carlo Study. Stat Med 3: 153-163.
Indexedat Google scholar
- Gallardo DI, Bolfarine H, Pedroso-de-Lima AC (2013) Promotion time cure rate model with random effects: An application to a multi-center clinical trial of carcinoma. Statistics Research Letters 2: 44-52.
Google Scholar Crossref
- Gallardo DI, Bolfarine H, Pedroso-de-Lima AC (2015) Promotion time cure rate model with bivariate random effects. Commun Stat B: Simul Comput 45: 603-624.
Google Scholar Crossref
- Grover G, Goel K (2017) Estimating the Cure Fraction among Cancer Patients by using Promotional Time Cure Rate Model with Negative Binomial Distribution. J Appl Quant Methods 12.
Google Scholar Crossref
- Ewell M, Ibrahim JG (1997) The Large Sample Distribution of the Weighted Log Rank Statistic Under General Local Alternatives. Lifetime Data Anal 3: 5-12.
Indexedat Google Scholar Crossref
- Lambert P, Bremhorst V (2018) Estimation and Identification issues in the promotion time cure model when the same covariates influence long and short – term survival. Biometrical Journal 61: 275-289.
Indexedat Google Scholar Crossref
- Lopes CMC, Bolfarine H (2012) Random effects in promotion time cure rate models. Comput Stat Data Anal 56: 75-87.
Google Scholar Crossref
- Maller RA, Zhou X (1996) Survival analysis with long term survivors. New York: Wiley.
Indexedat Google Scholar Crossref
- Ortega EMM, Barriga GDC, Hashimoto EM, Cancho VG, Cordeiro GM (2014) A New Class of Survival Regression Models with Cure Fraction. Data Sci J 12: 107-136.
Indexedat Google Scholar Crossref
- Rodrigues J, Cancho VG, Castro MA, Louzada-Neto F (2009) On the unification of the long-term survival models. Stat Probab Lett 79: 753-759.
Indexedat Google Scholar Crossref
- Piegorsch WW (1990) Maximum likelihood estimation for the Negative Binomial dispersion parameter. Biometrics 46: 863-867.
Indexedat Google Scholar Crossref
- Saha K, Paul S (2005) Bias-corrected maximum likelihood estimator of the Negative Binomial dispersion parameter. Biometrics 61: 179-185.
Indexedat Google Scholar Crossref
- Spiegelhalter DJ, Best NG, Carlin BP, van der Linde VA (2002) A Bayesian measures of model complexity and fit. J R Statist Soc Ser B 64: 583-639.
Indexedat Google Scholar Crossref
- Varshney M, Grover G, Vajala R, Thakur AK (2018) Cure Fraction Model for the Estimation of Long –term Survivors of HIV/AIDS Patients under Antiretroviral Therapy. J Commun Disea 50: 1-10.
Google Scholar Crossref
- Yakovlev AY, Tsodikov AD (1996) Stochastic Models of Tumor Latency and Their Bio statistical Applications. World Scientific, Singapore, Hackensack, NJ.
Google Scholar Crossref
Citation: Goel K, Varshney MK, Grover G,
Pant S (2021) On the Estimation of Cure
Rate in the Presence of Prognostic Factors
using Various Discrete Count Distributions.
Health Sci J. Vol. 16 No. 1: 910.


