Kato H. C. A1*, Freitas AA2
1Researcher, Department of Technology Transfer, Embrapa Fisheries and Aquaculture Technology Transfer Sector, Qd 104S, LO01, 34 77020020 Palmas, Brazil
2Analyst, Department of Technology Transfer, Embrapa Fisheries and Aquaculture Technology Transfer Sector, Qd 104S, LO01, 34 77020020 Palmas, Brazil
*Corresponding Author:
Kato H. C. A., Researcher
Department of Technology Transfer, Embrapa Fisheries and Aquaculture Technology Transfer Sector, Qd 104S, LO01, 34 77020020 Palmas, Brazil
E-mail: hellen.almeida@embrapa.br
Tel: +55 (063) 3229-7800
Received date: 10 June 2015 Accepted date: 02 July 2015 Published date: 07 July 2015
Editorial
The global fish production and consumption has been growing over the past decades, and this increase is due to an improved perception of the nutritional and healthful characteristics of this protein source. This increasing interest is generated in part by several studies that have associated fish consumption to obesity reduction, improvements in cognitive development and prevention of cardiac and metabolic diseases such diabetes (Mozaffarian and Elvevoll, 2010). However, in some countries like Brazil, there are still limiting factors for consumption, mainly related to price and lack of access to convenience products. In countries where consumption is traditional, like China and Norway, others factors acts limiting purchases: the growing concern with issues such as fish contamination due to the quality of fishing/farming water, mainly metal contaminants (Jensen, 2006; Feng et al., 2009).
To meet theses many different requirements in growing, or already established, markets, in a global scale, aquaculture increasingly expands, with its benefits of standardization, supply of maintenance throughout the year and better sanitary control. In 2012, the Earth Policy Institute reported that for the first time in history, the production of fish and other seafood in captivity overtook beef production. The production was 66.5 million tons of fish against 63 million tons of red meat (Larsen and Roney, 2013). In a World Bank study (2013), scenarios for the fish consumer market were created for the year 2030 and it is estimated that in the future, aquaculture already corresponds to 62% of all fish consumed in the world.
In Brazil, the fish trading market is booming, driven in part by the increase in per capita consumption and consequent production growth. However, this volume produced is not enough to supply the domestic market, still very dependent on exports. Between 2002 and 2010, fish imports more than tripled, reaching a deficit of 594.241 tons for the amount of fish exported. The increase in consumption is then basically supplied by the increase in imports and domestic culture or capture, which undergoes a gradual transformation. The production of fish by capture is still prevalent in the country, but the growth of aquaculture has intensified. In 2000 it accounted for 20.55% of national production, and in 2013, 38.26% of total output (Figure 1) (FAO, 2015).
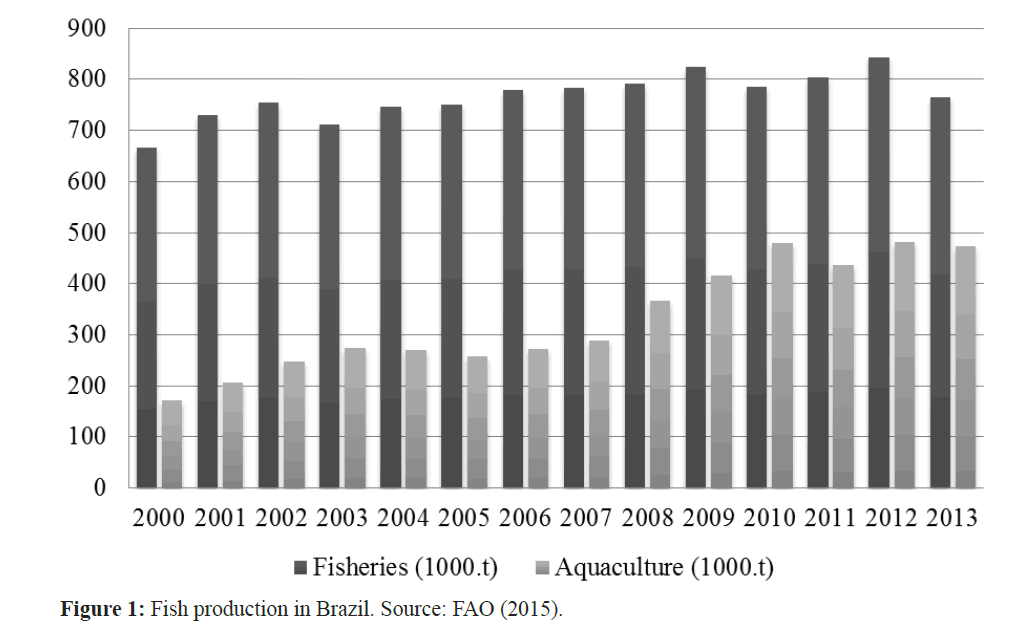
Figure 1: Fish production in Brazil. Source: FAO (2015).
In Brazil, the gradual replacement of capture by cultivation can be credited to two questions: decreased of fish stocks combined with greater environmental restrictions on fishing and industrial demand for standardized products and regular supply. The aquaculture production in 2012 corresponds to 1.1% of world production, which places Brazil in 14th among the major countries that practice aquaculture. This condition still does not reflect the potential that Brazil has in water volume and climate, especially if we take into account the conditions of the countries that are ahead, such as Egypt, Myanmar, Thailand, and Chile (FAO, 2014).
The Brazilian aquaculture production tends to growth, reflecting increased consumption, since research shows that the country recognize the fish as a quality meat, and its nutritional value as an appeal to the purchase of this protein. However, the factor that negatively influences its growth is the higher price of fish compared to the other animal proteins, which requires the development of more efficient production processes, to reduce costs while maintaining the quality of the offered product.
These observations are corroborated by statistical research carried out in the country. Although there are divergences between the data presented by the Annual Family Budget Survey (POF) developed by Brazilian Geography and Statistics Institute (IBGE), the data of Ministry of Fisheries and Aquaculture (MPA) and Food and Agriculture Organization of the United Nations (FAO), in all cases, there are the same regional differences in the consumption and an outstanding trend in the increase of fish per capita amount consumed in Brazil.
The MPA indicates that the per capita apparent consumption was 6.76 kg/year in 2002 and 9.03 kg/year in 2009, representing an increase of 133.5% in this period (MPA, 2012). FAO presents similar data from 6.20 kg/year in 2012 to 8.30 kg/year in 2009 and 10.6 kg/year in 2011 (FAO, 2015).
In the POF 2008-2009, fish acquisition was 4 kg/year per capita, but, in the North Region, the average per capita was 17.5 kg/year, remaining well above the average of other regions (Northeast was 4.9 kg/year; Southeast 2.0 kg/year; in the South 1.5 kg/year and in the Midwest region 1.6 kg/year) (IBGE, 2011). The previous data of POF 2002-2003 identified a per capita consumption of fish at 4.6 kg/year. In the North region was 24.6 kg/year; Northeast 4.9 kg/year; Southeast 2.1 kg/year; in the South 1.7 kg/year and in the Midwest 1.3 kg/year (IBGE, 2004).
The slight decrease in per capita consumption highlighted by POF between 2002 and 2009 is due to a sharp reduction in consumption of the North Region, considered the largest national average. Costa et al. (2013) associate this decrease to the growth of monthly family income in the region, which is associated with an increase in the consumption of beef, chicken and pork, as these sources incorporate a concept of abundance, power and prestige of higher socio-economic layers (farmers and local breeders).
Minozzo et al. (2008) analyzed three cities in the states of São Paulo and Santa Catarina, highlighting that the increase in the desire to consume fish is generated by the association of this protein with a low-calorie diet, geared to healthiness and longevity. The cost of acquiring was cited as the biggest barrier to increased consumption, another barrier is the lack of standardized and convenience products in the market.
Gonçalves et al. (2008) analyzing the trend of fish consumption in the city of Porto Alegre (RS, South Region), concluded that the population studied showed preference for innovative products like sausages, seasoned fish ready to bake, nuggets and burgers. The study also indicated that consumers created expectations of quality, and associates certain attributes of the product with the daily purchases, using these attributes as a non-specific pattern of satisfaction with the purchase after consumption.
Analyzing interviews in a university cafeteria in Mossoró (Northeast Region), Silva and Gonçalvez (2012) state that if there is diversity of quality products, easy preparation and good presentation, plus a practical and informative packaging, it would make easier for the marketing work and consequently the fish placing on the market, contributing to increase the levels of its consumption.
The tendency to expansion of consumption through products that add new technologies can also be demonstrated by analyzing the data from the Annual Survey of Industry Products (PIA) (IBGE, 2012). In 2012, the total value of Brazilian industrial production in the item "Preservation of fish and fish products manufacturing" was almost U$ 1 billion, a value 21.06% greater than the value recorded in 2011.
Also according to the PIA, between 2008 and 2012, there was an increase of 81.65% in the total production values, especially the sectors of canned and frozen fish. This percentage increase was greater than the increase in Brazilian industry production (63.14%) and when is compared to other animal protein industries, the growth in fish industry is superior to pigs and poultry industry (72.89%), second only to the growth of slaughter and processing of cattle (127.5%) (IBGE, 2012).
Another indicator that the trend of consumption for products with some processing level has intensified can be obtained by evaluating the data on the trade balance and the main export products. Comparing the results obtained in 2007 and 2009 in tons there is a 14% increase in fish imports, their products and byproducts, and a predominance of cod, salmon, frozen hake fillets and other fishes.
The data depicted demonstrate that there is a wide path to research, industry and commerce sectors in expanding the fish consumption, and in ensuring that this growth must be linked to the ability of these sectors in generating innovative products that have aggregated healthiness and practicality values.
6894
References
- World Bank, (2013). Fish to 2030: Prospects for Fisheries and Aquaculture, World Bank Report Number 83177-Glb. Available at https://www.fao.org/docrep/019/i3640e/i3640e.pdf. Accessed on line at Feb 2015
- nCosta, T.V., Silva, R.R.S, Souza, J.L., Batalha, O.S., Hoshiba, M.A., (2013).Aspectos do consumo e comércio de pescadoemParintins.Boletim do Instituto de Pesca, 39 (1): 63–75
- nFAO – Food and Agriculture Organization of the United Nations, (2014).The State of World Fisheries and Aquaculture: Oportunities and Challenges. FAO, Rome
- nFAO – Food and Agriculture Organization of the United Nations, (2015).Fisheries Statistics.Available at https://www.fao.org/fishery/statistics/global-aquaculture-production/en.Accessed on line at Jun 2015
- nFeng, W., Jian, Z., Weisong, M., Zetian, F., Xiaoshuan, Z., (2009).Consumers’ perception toward quality and safety of fishery product.Food Control, 20(10): 918-922. doi:10.1016/j.foodcont.2009.01.008
- nGonçalves, A.A., Passos, M.G., Biedrzycki, A., (2008).Tendência do consumo de pescadonacidade de Porto Alegre: um estudoatravés de análise de correspondência. Estudostecnológicos, 4 (1):21-36
- nIBGE – Brazilian Geography and Statistics Institute, (2004).Pesquisa de orçamentosfamiliares 2002-2003, Coordenação de Trabalho e Rendimento. Rio de Janeiro, IBGE
- nIBGE – Brazilian Geography and Statistics Institute, (2011).Pesquisa de orçamentosfamiliares 2008-2009, Coordenação de Trabalho e Rendimento. Rio de Janeiro, IBGE
- nIBGE – Brazilian Geography and Statistics Institute, (2012).Pesquisa industrial anual.Rio de Janeiro, v. 31, n.2, p.1-192
- nJensen, H.H., (2006). Changes in seafood consumer preference patterns and associated changes in risk exposure.Marine Pollution Bulletin, 53:591–8. doi:10.1016/j.marpolbul.2006.08.014
- nLarsen, J., Roney, J.M., (2013). Farmed Fish Production Overtakes Beef. Plan B Updates, Earth Policy Institute. Available at https://www.earth-policy.org/plan_b_updates/2013/update114.Accessed on line at Jan 2015
- nMinozzo, M.G., Haracemiv, S.M.C., Waszczynskyi, N., (2008). Perfil dos consumidores de pescado de São Paulo (SP), Toledo (PR) e Curitiba (PR) no Brasil.RevistaAlimentação Humana, 14 (3): 133-140
- nMozaffarian, D., Elvevoll, E.O., (2010). Benefits of seafood consumption on health.Joint FAO/WHO Expert Consultation on the Risks and Benefits of Fish Consumption. Rome, Italy, Jan 2010. FAO, Rome, 94 p
- nMPA – Ministry of Fisheries and Aquaculture, (2012).BoletimEstatístico da Pesca e Aquicultura 2010. Brasília, MPA. Available at https://www.mpa.gov.br/images/Docs/Informacoes_e_Estatisticas/Boletim%20Estat%C3%ADstico%20MPA%202010.pdf.Accessed on line at Jan 2015
- nSilva, D.C.F., Gonçalvez, A.A., (2012).Perfil de consumo de pescado dos usuários do restauranteuniversitário da UFERSA. RevistaCaatinga, Mossoró, 25 (3): 125-129.


