Keywords
Real-Time PCR, Quantification, Fish fillets, Total bacteria, Universal primers
Introduction
Fishery products deteriorate rapidly postmortem as a consequence of microbial growth and metabolism. Most products are rejected by sensory evaluation within one week of chilled storage (Beauchat 1995; Rodriguez et al., 2004; Skjerdal et al., 2004). There is a need for a rapid and reliable method for determining the total number of bacteria on seafood following refrigerated storage and before sale, in order to prevent the distribution to consumers of poor quality fish products with notably short refrigerated storage life, in addition to facilitating the establishment of absolute criteria of quality. Many methods have been developed to enumerate bacteria in foods, such as plate counts, microscopic counts, estimation of metabolic activity, immuno assays, and PCR (Dalgaard 1995; Gonzalez et al., 1999). PCR is presently one of the more rapid techniques for quantification of bacteria in foods. Quantification of bacterial numbers of specific species by PCR has been determined with most probable number PCR (MPN-PCR), competitive PCR, and PCR-ELISA (Hielm et al., 1996; Lee et al., 1996; Gonzalez et al., 1999) techniques. However, these methods require multiple handling and time consuming procedures after PCR. Improved methodology therefore is still needed for more rapid quantification of total numbers of bacteria on seafood tissue. Recently, real-time PCR assays have been developed for detection and quantification of specific DNA sequence products by using TaqMan probes, molecular beacons or SYBR® Green (Levin 2004). Real-time PCR has several advantages including enhanced speed and the absence of post-PCR steps. The incorporation of SYBR® Green into real-time PCR assays constitutes the simplest and least expensive reporter system. Unlike dual labeled fluorescent probes, the intensity of fluorescence of SYBR® Green increases when bound to the minor groove of double helical DNA (Levin 2004). The resulting increase in the intensity of fluorescence after each PCR cycle reflects the extent of amplification of the targeted DNA sequence. The use of SYBR® Green also has the advantage of allowing a DNA melting curve and Tm value of the amplicon to be obtained following real-time PCR, which allows distinction of the amplified product from primer dimers.
The purpose of this study was to develop methodology for the quantitative real-time PCR estimation of the total number of bacteria on refrigerated fish fillets. In our approach, universal primers based on conserved 16S rDNA bacterial sequences were used for realtime PCR.
Materials and Methods
Fish samples
The fish used in this study were cod fillets (Gadus morhua) purchased from local retail sources. The fillets were kept on ice and processed as soon as they arrived at the laboratory.
Development of mixed bacterial cultures from fish tissue for establishing a standard curve relating the Ct value to the log of the number of genomic targets
All media were from Difco. A sample of cod muscle (1g) was transferred to a 250 ml flask containing 100 ml of sterile Tryptic Soy Broth supplemented with 0.5% dextrose (TSB+). The flask was incubated at 20°C with rotary agitation (250 rpm) until the mid-logarithmic growth phase was just reached. Developments of the cultures were periodically assessed from absorbance readings at 600nm in cuvets of 1 cm path length. The resulting broth cultures was then decimally diluted in TSB+, and 0.1 ml of dilutions surface smeared onto triplicate plates of Plate Count Agar supplemented with 0.5% NaCl (PCA+). The plates were then incubated aerobically at 20°C for 3 days for determination of CFU. At the same time, direct microscopic counts on the broth cultures were obtained by using a Petroff- Hausser bacteria-counting chamber with dark phase microscopy and correlated with plate counts. Numerical values for microscopic bacterial cell counts were derived from the mean of three-specimen counts. After microscopic enumeration, the cells in 10 ml of the broth cultures were harvested by centrifugation (10.000g for 5 min), resuspended in 10 ml of 0.85% NaCl plus 1mM MgSO4 (SMS), and diluted in SMS for establishing a standard curve relating the Ct values of amplified DNA and the log of the number of genomic targets from which the DNA in each real-time PCR assay was derived.
Preparation of fish tissue samples for quantification of bacterial numbers by plate counts and real-time PCR
All of the cod fillets were purchased from local retail sources. Each fillet sample (10g) was stomached with 90 ml of SMS in a filter containing stomacher bag, using a stomacher 400 (Tecmar Co., Cincinnati, Ohio, USA) at normal speed for 1 min. Portions of homogenized samples (3.0 ml) were centrifuged at 1.000 rpm (160g) for 3 min at 4°C to pellet tissue debri. Most of the supernatant (2.0 ml) was then divided into two 1.0 ml portions and transferred to microcentrifuge tubes. The first tube was subjected to direct plate count and real-time PCR assays. The second tube was centrifuged at 10.000 rpm (16.000g) for 10 min at 4°C to pellet bacterial cells, and the supernatant was discarded. The pellet was then resuspended in 1.0 ml of SMS. The resulting samples were used for plate count and realtime PCR assays. All samples were decimally diluted with TSB+ and total aerobic plate counts were determined as described above. Plate counts were expressed as log CFU/g of tissue. Real-time PCR was initiated by lysing the cells present in 100 ml of samples as described below.
Lysing of bacterial cells
Portions (100 μl) of the resulting cell suspensions from above were mixed with equal volumes of double strength (2X) TZ lysing solution (Abolmaaty et al. 2000) in 1.5 ml microcentrifuge tubes. TZ lysing solution consisted of 2.0% Triton X-100 and 2.5 mg/ml sodium azide in 0.1 M Tris.HCl buffer at pH 8.0. The samples were lysed by heating the tubes in a boiling water bath for 10 min. and cooled to room temperature. They were then centrifuged at 10,000g for 5 min. to pellet cell debris. A portion (2.0 μl) of the crude supernatants were added directly to real-time PCR mixtures.
Real-time PCR
The real-time thermocycler used in this study was a DNA Engine Opticon® 2 system (MJ Research Corp., Waltham, MA, USA). The universal forward DG74: 5’-AGG-AGGTGA- TCC-AAC-CGA-A-3’ and reverse RW01: 5’-ACC-TGG-AGG-AAG-AAG-GTGGGG- AT-3’ primers (Greisen et al. 1994) used amplify a 370-bp sequence of the 16S rDNA gene. The universal primers were synthesized by Sigma Genosys (The Woodlands, TX, USA). These primers are broadly homologous to conserved 16S rDNA bacterial genomic sequences not present in eukaryotes. 25 μl of the real-time PCR mixtures consisted of 12.5 μl of 2 x iQ™ SYBR® Green Supermix (cat. no. 170-8882, Bio-Rad, Hercules, CA, USA), 1 μl of 0.4 μM forward primer and 1 μl of 0.4 μM reverse primer, 2 μl of DNA template and 8.5 μl of deionized water. Each set of samples included a negative control, in which deionized water was substituted for the DNA sample. The iQ™ SYBR® Green Supermix consisted of 0.4 mM of each dNTP, 50 U/ml iTaq DNA polymerase, 6 mM MgCl2, SYBR Green I, and 20 nM fluorescein. Real-time PCR was performed with initial denaturation at 95°C for 3 min., followed by 40 cycles of denaturation at 95°C for 25 sec., primer annealing at 60°C for 25 sec and primer extension at 72°C for 1 min. The fluorescent product was detected after the extension step of each cycle. Following amplification, melting temperature analysis of PCR products was performed to determine the specificity of the PCR. The melting curves were obtained by slow heating at 0.5°C/sec from 55 to 90°C, with collection of fluorescence after each increase of 0.5°C.
Visualization of PCR products
Following amplification, the real-time PCR mixture was mixed with 5 μl of gel loading solution (cat. no. G-7654, Sigma-Aldrich, St. Louis, Mo, USA) resulting in a total volume of 30 μl and 12 μl were loaded into wells of 1.5% high-melting agarose (cat. no. BP164500, Fisher Scientific, Pittsburgh, PA, USA) gels. The PCR reaction samples were separated using a horizontal electrophoresis chamber in 1 x TBE (89 mM Tris base, 89 mM boric acid, and 2.0 mM EDTA at pH 7.8). Electrophoresis was conducted at 72 V for 1 hr. Agarose bands were stained with 0.2 mg/ml of ethidium Bromide (EB) for 30 min, and destained in deionized water for 7 min. DNA bands in the gels were visualized with an ultraviolet transilluminator (TR-302, Spectronics corporation, West bury, NY, USA). Gels were run with a DNA marker (cat. 69278-3, Novagen, Madison, Wisconsin, USA).
Determination of real-time PCR amplification efficiency of target DNA from tissue
DNA from fillets with varying numbers of genomic targets (determined from plate counts) was incorporated into real-time PCR assays with and without the washing step applied to tissue samples. Amplification efficiency was derived from Ct values obtained by first plotting ΔRn (relative fluorescence) values against cycle numbers where ΔRn= Rn+ - Rn- , Rn+ is the fluorescence intensity after each real-time PCR cycle, and Rnis the fluorescence intensity of the base-line. From the mean Ct values, the number of target cells represented by the amount of DNA per real-time PCR assay was obtained from a standard curve relating the log of the number of genomic targets (from CFU values) to Ct values. The equation E = Xn/Xo was then used, where Xn is the log number of target cells derived from the Ct value, Xo is the initial known log of CFU, and E is the amplification efficiency of the real-time PCR assay. Thus, when the amplification efficiency is 100%, the E value becomes 1.0. Each mean value for E was derived from triplicate realtime PCR assays.
Data analysis
In real-time PCR a threshold level of emission above the base line is selected and the point at which the amplification plot crosses the threshold level is defined as the Ct value (Levin, 2004). The threshold is usually set at 10 times the standard deviation of the base line. Ct and Tm values were automatically determined by the Opticon Monitor 2 software. Resulting Ct values were plotted against the log of genomic targets (derived from plate counts) per real-time PCR. The equation describing the linear curve is in the form: y = -ax + b, where y is the Ct value, a is the slope, x is the log of the number of genomic targets per real-time PCR, and b is the y intercept. The quantification of total bacteria from fish fillets utilizing Ct values was determined using the equation: Q = cd, where Q is the log of genomic targets/g of tissue, c is the log of the number of genomic targets/realtime PCR, and d is the multiplication factor of the sample.
Student’s T-test was used to determine the correlation between the counts derived from real-time PCR assays and plate counts. Data from both methods were transformed into the log of CFU/g of tissue before undergoing statistical analysis. The SAS system for windows 6.12 software (SAS Institute Inc., Cary, NC.) was used to determine the statistical significance of results obtained. A confidence interval at the 99% level (p < 0.01) was assessed for each set of data.
Results and Discussion
The amplification patterns and sensitivity of the real-time PCR Assay
The real-time PCR amplified products from sequential dilutions of a mixed bacterial culture revealed sigmoid-shaped curves (Fig. 1), typical of PCR assays (Fortin et al. 2001; Fitzmaurice et al. 2004). Ct values were found to be characteristically smaller for samples containing higher numbers of DNA targets than for those containing lower numbers of DNA targets (Fig. 1). Sensitivity tests were performed by generating plots as depicted in Figure 1, with resulting Ct values obtained by incorporating DNA derived from 3.2 x 100 to 1 x 10⁵ CFU/real-time PCR. The lowest level of real-time PCR detection was determined to be the DNA from approximately 3.2 target cells/PCR derived from a Ct value of 38.2 ±0.15. All of these amplification reactions were performed in duplicate involving three mixed cultures derived respectively from three different cod fillets.
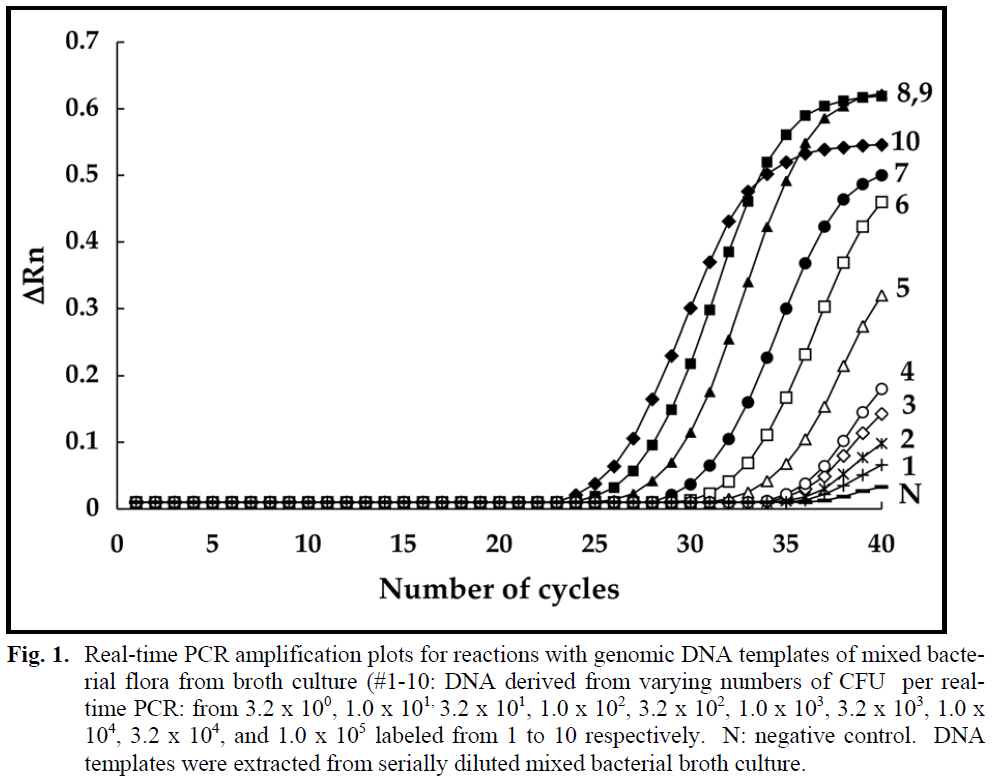
Figure 1: Real-time PCR amplification plots for reactions with genomic DNA templates of mixed bacterial flora from broth culture (#1-10: DNA derived from varying numbers of CFU per realtime PCR: from 3.2 x 100, 1.0 x 101, 3.2 x 101, 1.0 x 10², 3.2 x 10², 1.0 x 10³, 3.2 x 10³, 1.0 x 10⁴, 3.2 x 10⁴, and 1.0 x 10⁵ labeled from 1 to 10 respectively. N: negative control. DNA templates were extracted from serially diluted mixed bacterial broth culture.
Thermal denaturation profiles and reagent contamination issue with universal 16S rDNA primers
The number of cycles at which the fluorescence intensity rose above the threshold levels ranged from 24.5 (DNA from 1 x 10⁵ CFU/real-time PCR) to 38.2 (DNA from 3.2 x 10° CFU/real-time PCR) (Fig. 1). The use of subsequent melting curve data aided PCR product confirmation, particularly with the incorporation of DNA derived from low numbers of cells at the limit of detection. Plots of the negative derivatives of the thermal denaturation data yielded bell shaped symmetrical curves, the mid-point of which yielded the Tm values for the amplified products. As the temperature increased from 84 to 86°C, the amplicon from 1 x 10⁴ mixed genomic targets was gradually melted and the Tm value obtained was 86.5° ±0.00°C (data not shown).
Interestingly, we consistently obtained amplicons from the negative controls where no DNA was added to real-time PCR reaction tubes. The Tm value of these amplicons was 86°C ±0.20 (data not shown), presumably derived from bacterial contamination of PCR reagents. The 16S rDNA gene is present in the genomes of all known bacteria that belong to the eubacterial kingdom (Greisen et al., 1994; Corless et al., 2000). It has been well documented that the amplification of 16S rDNA target sequences with universal primers by the PCR can be confounded by problems with bacterial contamination of reagents, such as Taq DNA polymerase (Corless et al., 2000). This is particularly true, at or near the limit of detection. DNA from 3.2 CFU per real-time PCR assay resulted in a mean Ct value of 38.2 ±0.15. The mean Ct value derived from negative controls (no DNA added to real-time PCR tubes) was 38.9 ±0.89. This means that the practical limit of minimal detection of DNA targets per real-time PCR assay is greater than 3.2, namely 10. The mean Ct value obtained with DNA from 10 CFU per real-time PCR assay was 37.4 ±0.30 which reproducibly fell below the mean and standard deviation of the mean Ct value of 38.9 ±0.89 for the negative controls.
Correlation between log number of genomic targets and corresponding Ct values derived from mixed cultures
The use of a standard curve based on known concentrations of template DNA makes it theoretically possible to quantify bacteria from any source (Ludwig and Schleifer, 2000). Genomic DNA preparations from serial dilutions of an overnight mixed culture from cod tissue were subjected to real-time PCR with the universal primer pair DG74/RW01. A standard curve was then constructed by plotting the number of genomic targets per real-time PCR versus the corresponding Ct values (Fig. 2). The insert in Figure 2 represents a typical agarose gel image of the 370-bp PCR products obtained by amplification of 1x101 to 1x10⁵ genomic targets per real-time PCR. The size of the amplicons was confirmed from a DNA ladder (not shown). The correlation coefficient (R2 = 0.998) reflected a strong linear relationship (Fig. 2). The standard curve in Figure 2 was used for quantification of the total number of genomic targets on fish fillets.
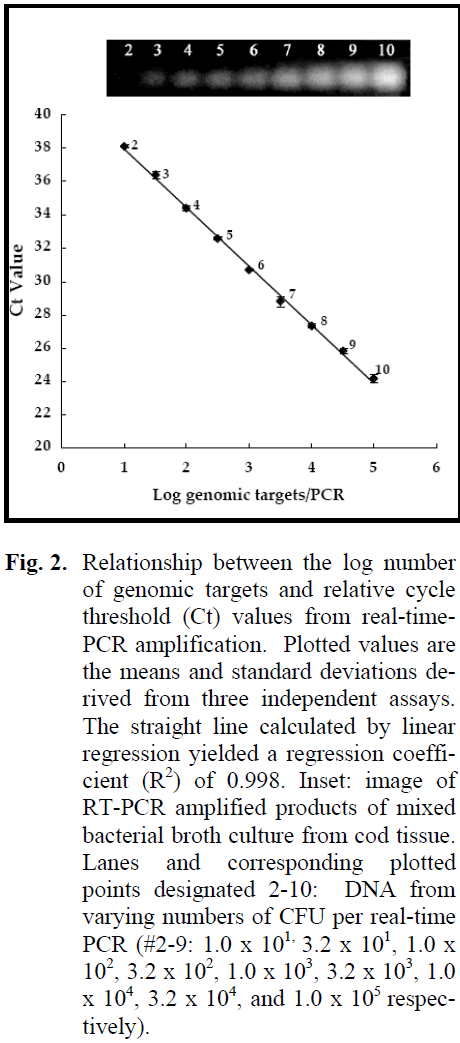
Figure 2: Relationship between the log number of genomic targets and relative cycle threshold (Ct) values from real-time-PCR amplification. Plotted values are the means and standard deviations derived from three independent assays. The straight line calculated by linear regression yielded a regression coefficient (R2) of 0.998. Inset: image of RT-PCR amplified products of mixed bacterial broth culture from cod tissue. Lanes and corresponding plotted points designated 2-10: DNA from varying numbers of CFU per real-time PCR (#2-9: 1.0 x 101, 3.2 x 101, 1.0 x 10², 3.2 x 10², 1.0 x 10³, 3.2 x 10³, 1.0 x 10⁴, 3.2 x 10⁴, and 1.0 x 10⁵ respectively).
PCR amplification efficiency of mixed bacterial flora from tissue
The Ct values from samples of fish tissue derived from stomaching, differential centrifugation, and washing were then compared to samples without washing as described in Materials and Methods. The resulting Ct values derived from incorporating 1 x 10⁴ genomic targets per real-time PCR (Fig. 3) were then used to calculate the efficiency of amplification Washing the pellets derived from differential centrifugation of the homogenized tissue dramatically increased the efficiency of amplification (Rosen et al. 1992; Al-Soud et al. 1998; Olsen 2000). This reduced the mean Ct value of 31.3 ±0.14 cycles without washing by 5.1 ±0.32 cycles to 26.1 ±0.18 and increased the ΔRn value from 0.60 ±0.07 to 0.48 ±0.02 or 1.25-fold (Fig. 3). The Ct values allowed calculation of the mean amplification efficiency which was 0.99 with washing and 0.80 without washing. In addition, the log of the total number of genomic targets per gram of tissue obtained from interpolation of the standard curve in Figure 2 was compared to plate counts of the tissue. The log of the number of genomic targets per gram of tissue with the washing step (8.36 ±0.05), estimated by real-time PCR was similar to the magnitude of the CFU obtained from plate counts (8.39 ±0.02). In contrast, the log of the number of genomic targets per gram of tissue without the washing step (6.87 ±0.05), estimated by realtime PCR was notably below the actual CFU derived from plate counts (8.39 ±0.02). Relative amplification efficiencies involving tissue samples from cod fillets with log 5.3 to log 9.5 CFU/g are presented in Table 1. Complex biological samples such as foods have been reported to inhibit the PCR (Rosen et al., 1992; Powell et al., 1994). Many substances such as, proteins, chelating agents, and haeme compounds have been found to be PCR inhibitors (Rosen et al. 1992; Buffone et al., 1991; Akane et al., 1994; Powell et al., 1994). The washing step was therefore critically required to obtain reliable counts by real-time PCR.
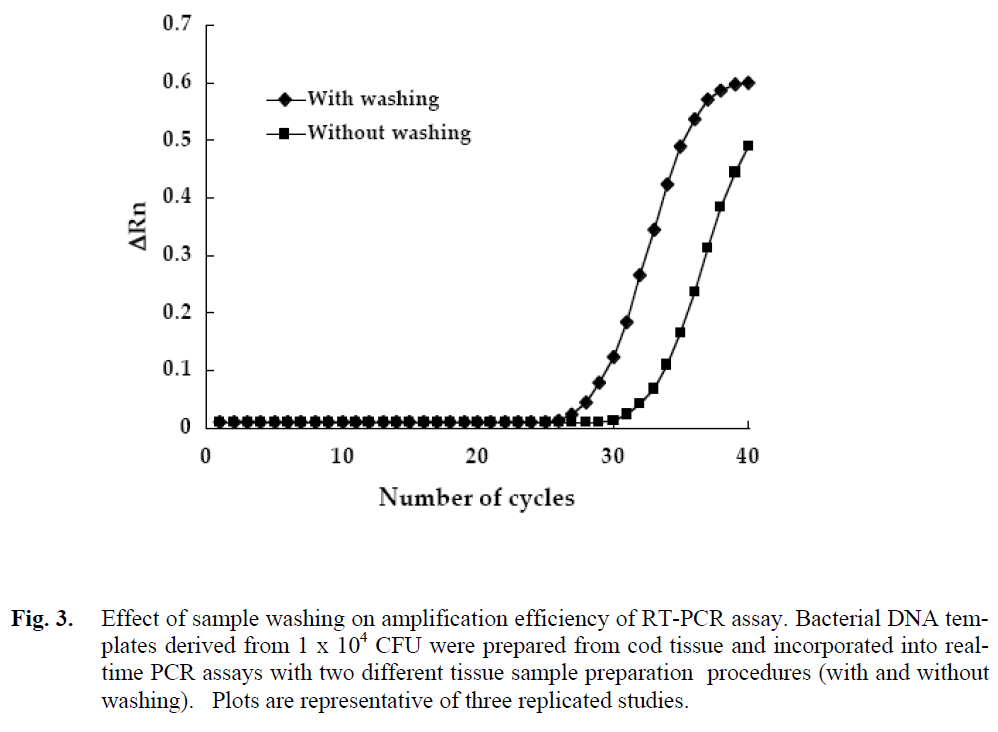
Figure 3: Effect of sample washing on amplification efficiency of RT-PCR assay. Bacterial DNA templates derived from 1 x 10⁴ CFU were prepared from cod tissue and incorporated into realtime PCR assays with two different tissue sample preparation procedures (with and without washing). Plots are representative of three replicated studies.
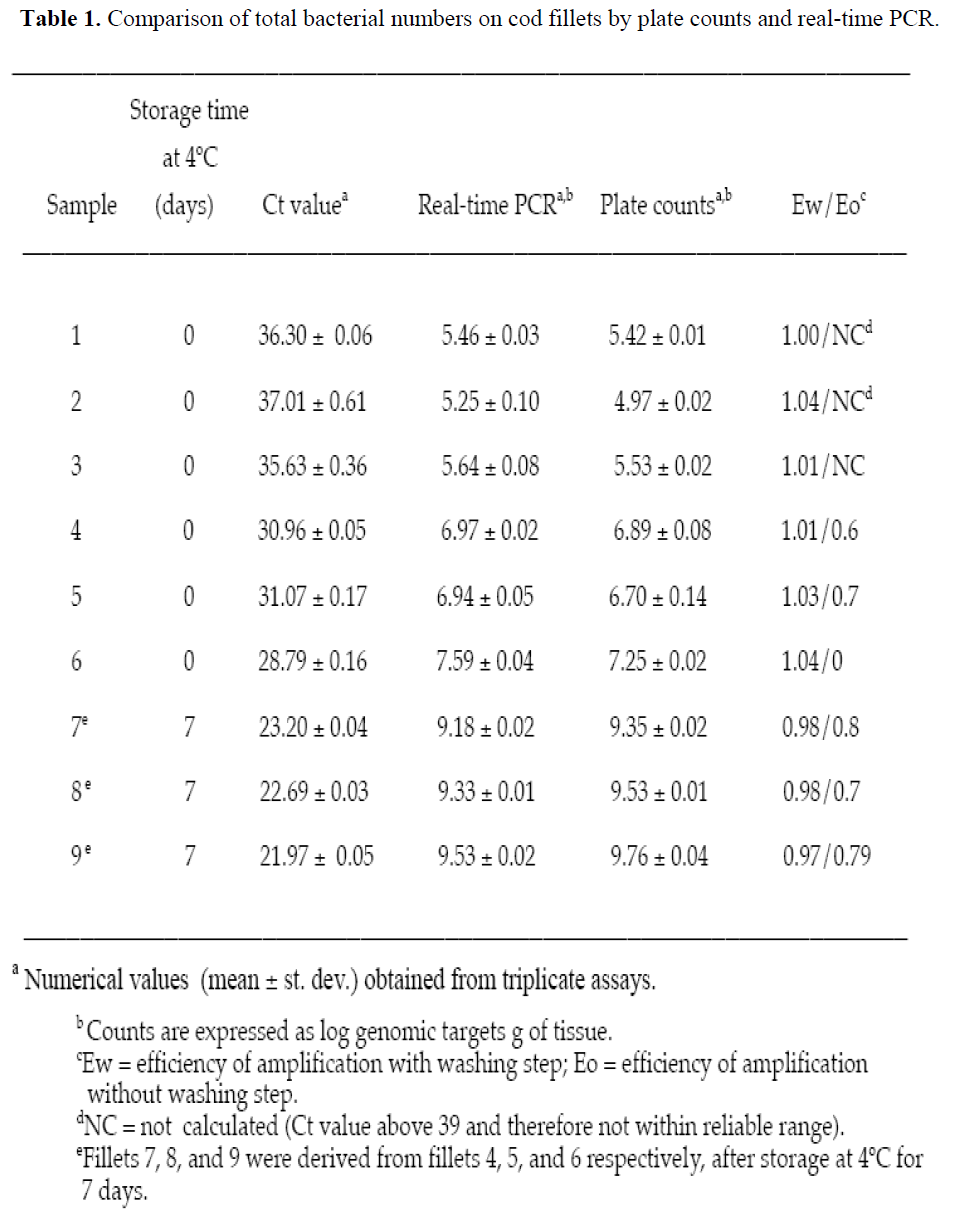
Table 1: Comparison of total bacterial numbers on cod fillets by plate counts and real-time PCR.
Comparison of bacterial counts derived from the RT-PCR and plate counts from randomly procured fish fillets
Quantification of total bacterial numbers was performed on randomly procured cod fillets. The log of the number of bacteria per gram of tissue was obtained from the RT-PCR assay of each sample using the standard curve in Figure 2. The total number of bacteria from tissue derived from real-time PCR assays showed no statistically significant difference (P >0.01) from numerical values obtained by plate counts (Table 1). Fillets 1, 2, and 3 were selected because their zero time CFU counts were 5.2 to 5.6 log/g and represented the lowest counts normally encountered commercially. Fillets 4, 5, and 6 were selected because their zero time CFU counts were at an intermediate level of 106 to 107/g. Fillets 7, 8, and 9 were derived from fillets 4, 5, and 6 after being held at 4oC for 7 days so as to yield maximum or near maximum counts (>109 CFU/g).
Conclusion
Our results indicate that the real-time PCR assay was able to reliably determine the total number of bacterial genomic targets from 105 to >109/g. It should be noted, that the PCR will not normally discriminate between target DNA sequences derived from viable and dead bacterial cells. The reason we obtained such close correlations between plate counts and counts from real-time PCR is due to the fact that the vast majority of bacterial cells on the fillets were viable and capable of forming colonies. Studies are presently being completed that allow real-time PCR discrimination of viable from dead bacterial cells derived from fish fillets using methodology previously described (Wang and Levin, 2006).
Acknowledgments
Jung-Lim Lee was supported in part by a postdoctoral fellowship grant from the Korea Research Foundation funded by the government of Korea (MOEHRD, Basic Research Promotion Fund, M01-2004-000-20192-0) and by a U.S.D.A Special Seafood Safety grant. This is paper no. 3388 from the Massachusetts Agricultural Experiment Station, University of Massachusetts, Amherst, MA, U.S.A.
1749
References
- Abolmaaty, A., Vu, C., Oliver, J. and Levin, R. E. (2000). Development of a new lysis solution for releasing genomic DNA from bacterial cells for DNA amplification by polymerase chain reaction. Microbios. 101: 181-189.
- Akane, A., Matsubara, K., Nakamura, H., Takahashi, S. and Kimura, K. (1994). Identification of the heme compound copurified with deoxyribonucleic acid (DNA) from blood strains, a major inhibitor of polymerase chain reaction (PCR) amplification. J. Forensic Science. 39: 362-372.
- Al-Soud, W. A., Lantz, P., Bäckman, A., Olcen, P. and Rådström, P. (1998). A sample preparation method which facilitates detection of bacteria in blood cultures by the polymerase chain reaction. J. Microbiol. Mets. 32: 217-224.
- Beauchat, L. R. (1995). Pathogenic microorganism associated with fresh produce. J. Food Prot. 59: 204-216.
- Buffone, G. J., Demmler, G. J., Schimbor, C. M. and Greer, J. (1991). Improved amplification of cytomegalovirus DNA from urine after purification of DNA with glass beads. Clin. Chem. 37: 1945-1949.
- Corless, C. E., Guiver, M., Borrow, R., Edwards-jones, V., Kaczmarski, E. B. and Fox, A. J. (2000). Contamination and sensitivity Issues with a Real-Time universal 16S rRNA PCR. J. Clin. Microbiol. 38: 1747-1752.
- Dalgaard, P. (1995). Qualitative and quantitative characterization of spoilage bacteria from packaged fish. International J. Food Microbiol. 26: 319-333.
- Fitzmaurice, J., Glennon, M., Duffy, G., Sheridan, J. J., Carroll, C. and Maher, M. (2004). Application of real-time PCR and RT-PCR assays for the detection and quantitation of VT1 and VT2 toxin genes in E.coli O157:H7. Molec. Cell. Probes. 18: 123-132.
- Fortin, N. Y., Mulchandani, A. Chen, W. (2001). Use of Real-Time Polymerase chain reaction and molecular beacons for the detection of Escherichia coli O157:H7. Anal. Biochem. 289: 281-288.
- Gonzalez, I., Garcia, T., Fernandez, A., Sanz, B., Hernandez, P. E. and Martin, R. (1999). Rapid enumeration of Escherichia coli in oysters by a quantitative PCRELISA. J. Appl. Microbiol. 86: 231-236.
- Greisen, K., Loeffelholz, M., Purohit, A. and Leong, D. (1994). PCR Primers and probes for the 16S rRNA gene of most species of pathogenic bacteria, including bacteria found in cerebrospinal fluid. J. Clin. Microbiol. 32: 335-351.
- Hielm, S., Hyytia, E., Ridell, J. and Korkeala, H. (1996). Detection of Clostridium botulinum in fish and environmental sampling using polymerase chain reaction. Int. J. Food Microbiol. 31: 357-365.
- Lee, S.-Y., Bollinger, J., Bezdicek, D. and Ogram, A. (1996). Estimation of the abundance of an uncultured soil bacteria strain by a competitive PCR method. Appl. Environ. Microbiol. 62: 3787-3793.
- Levin, R. E. (2004). The application of Real- Time PCR to food and agricultural systems. a review. Food Biotechnol. 18: 97- 133.
- Ludwig, W. and Schleifer, K. H. (2000). How quantitative is quantitative PCR with respect to cell counts? Syst. Appl. Microbiol. 23: 556-562.
- Olsen, J. E. (2000). DNA-based methods for detection of food-borne bacterial pathogens. Food Res. Int. 33: 257-266.
- Powell, H. A., Gooding, C. M., Garrett, S. D., McKee, R. A. and Lund, B. M. (1994). Proteinase inhibition of the detection of Listeria monocytogenes in milk using the polymerase chain reaction. Lett. Appl. Microbiol. 18: 59-61.
- Rodriguez, O., Losada, V., Aubourg, P. S. and Barros-Velazquez, J. (2004). Enhanced shelf-life of chilled European hake (Merluccius merluccius) stored in slurry ice as determined by sensory analysis and assessment of microbiological activity. Food Res. Int. 37: 749-757.
- Rossen, L., Norskov, P., Holmstrom, K. and Rasmussen, O. F. (1992). Inhibition of PCR by components of food samples, microbial diagnostic assays and DNA extraction systems. Int. .l Food Microbiol. 17: 37-43.
- Skjerdal, O. T., Lorentzen, G., Tryland, I. and Berg, J. D. (2004). New method for rapid and sensitive quantification of sulphideproducing bacteria in fish from arctic and temperature waters, Int. J. Food Microbiol. 93: 325-333.
- Wang, S. and Levin, R. E. (2006). Discrimination of viable Vibrio vulnificus cells from dead cells in real-time PCR. J. Microbiol. Meth. 64: 1-8.


